

SUMMARY
Convergent input from different presynaptic partners shapes the responses of postsynaptic neurons. Whether developing postsynaptic neurons establish connections with each presynaptic partner independently, or balance inputs to attain specific responses is unclear. Retinal ganglion cells (RGCs) receive convergent input from bipolar cell types with different contrast responses and temporal tuning. Here, using optogenetic activation and pharmacogenetic silencing, we found that type 6 bipolar cells (B6) dominate excitatory input to ONα-RGCs. We generated mice in which B6 cells were selectively removed from developing circuits (B6-DTA). In B6-DTA mice, ONα-RGCs adjusted connectivity with other bipolar cells in a cell-type-specific manner. They recruited new partners, increased synapses with some existing partners, and maintained constant input from others. Patch clamp recordings revealed that anatomical rewiring precisely preserved contrast- and temporal frequency response functions of ONα-RGCs, indicating that homeostatic plasticity shapes cell-type-specific wiring in the developing retina to stabilize visual information sent to the brain.
INTRODUCTION
To extract specific information, postsynaptic neurons combine input from different presynaptic cell types in precise ratios. During development, molecular interactions between pre- and postsynaptic partners set up initial connectivity patterns, which are subsequently refined (Sanes and Yamagata, 2009; Williams et al., 2010; Yogev and Shen, 2014). Refinement occurs at many levels, from the molecular composition and the architecture of individual synapses (Turrigiano and Nelson, 2004; Wefelmeyer et al., 2016), the formation of new synapses and elimination of existing ones (Morgan et al., 2011; Purves and Lichtman, 1980), to the large-scale organization of neuronal projections and cell numbers (Antonini and Stryker, 1993; Riccomagno and Kolodkin, 2015; Yu et al., 2004). Remarkably, refinement balances changes across all levels to stabilize activity in emerging circuits (i.e. homeostatic plasticity). The importance of homeostatic plasticity to circuit development is underscored by recent evidence for its failures in many neurodevelopmental disorders (Ebert and Greenberg, 2013; Ramocki and Zoghbi, 2008; Turrigiano and Nelson, 2004). Homeostatic plasticity is known to mediate interactions between pre- and postsynaptic partners that maintain constant average firing rates of neurons by controlling synaptic scaling (Davis and Muller, 2015; Hengen et al., 2013; Pozo and Goda, 2010). Whether homeostatic plasticity also mediates interactions between different presynaptic inputs and adjusts patterns of convergent innervation (i.e. circuit-level plasticity) to stabilize specific computations of postsynaptic neurons is unknown.
In the mammalian retina, approximately 15 types of bipolar cells relay photoreceptor signals from the outer to the inner plexiform layer (IPL) (Euler et al., 2014; Shekhar et al., 2016). Bipolar cell types differ in their contrast responses and in their temporal filtering of photoreceptor signals (Baden et al., 2013; Borghuis et al., 2013; Euler et al., 2014; Franke et al., 2017; Ichinose et al., 2014). In the IPL, bipolar cell types converge in specific ratios onto the dendrites of 30–40 RGC types (Calkins and Sterling, 2007; Dunn and Wong, 2014; Helmstaedter et al., 2013), which inherit the contrast responses and temporal tuning of their combined inputs (Baden et al., 2016; Murphy and Rieke, 2006). The relationship of bipolar cell innervation and light responses has been characterized particularly well for ONα-RGCs. Compared to other RGCs, ONα-RGCs encode contrast linearly and with high sensitivity (Murphy and Rieke, 2006; Zaghloul et al., 2003). Anatomical circuit reconstructions suggest that ONα-RGCs are innervated by several bipolar cell types, with B6 cells accounting for approximately 70 % of excitatory synapses on their dendrites (Morgan et al., 2011; Schwartz et al., 2012). The responses of ONα-RGCs are accurately predicted by their excitatory input (Grimes et al., 2014; Murphy and Rieke, 2006; Zaghloul et al., 2003), and a receptive field model based on B6 innervation alone captures many response features (Schwartz et al., 2012). However, whether B6 cells provide functional input to ONα-RGCs has not been directly tested, and whether during development ONα-RGCs form connections with converging bipolar cells independently or balance inputs to attain specific responses is unclear.
Here, using optogenetic activation and acute pharmacogenetic silencing, we found that in wild-type mice ONα-RGC responses rely on excitatory input from B6 cells. We generated mice in which B6 cells were selectively removed from developing circuits by transgenic expression of diphtheria toxin. Anatomical circuit reconstructions and patch clamp recordings revealed that B6 cell removal elicited circuit-level plasticity in which other bipolar cell types took over innervation in specific ratios that precisely conserved contrast responses and temporal tuning of excitatory inputs and spiking of ONα-RGCs.
RESULTS
B6 cells provide dominant excitatory input to ONα-RGCs
ONα-RGCs receive convergent input from several bipolar cell types (Figure 1A). Although anatomical studies suggested that B6 cells account for approximately 70 % of excitatory synapses on ONα-RGC dendrites (Morgan et al., 2011; Schwartz et al., 2012), the functional input from B6 cells to ONα-RGCs has not yet been explored. To gain genetic access to B6 cells, we screened a set of Cre driver lines (Taniguchi et al., 2011) by crossing to a fluorescent reporter strain (Ai9, tdTomato) (Madisen et al., 2010). In CCK-ires-Cre Ai9 mice, which were previously shown to label several RGC and amacrine cell types (Tien et al., 2015; Zhu et al., 2014), tdTomato expression in the bipolar cell layer was restricted to a single cell type. The somata of these cells were arranged in a mosaic (Figures 1B and S1); their axon terminals stratified in the ON sublamina of the IPL and stained for synaptotagmin II (SytII) (Figure 1C) (Fox and Sanes, 2007). This identifies the bipolar cells labeled in Cck-ires-Cre Ai9 mice as B6 cells, consistent with a recent gene expression profiling study, which revealed Cck as a specific marker of B6 cells (Shekhar et al., 2016).
Figure 1. B6 cells provide dominant excitatory input to ONα-RGCs.

(A) Schematic illustrating converging bipolar cell input to ONα-RGCs. X, 6, 7, and 8 refer to cone bipolar cell types (Euler et al., 2014), whereas R indicates rod bipolar cells, which in wild-type mice provide mostly indirect input via AII amacrine cells (AII) and cone bipolar cells to ONα-RGCs. (B) Distribution of tdTomato-expressing cells in the inner nuclear layer of a P21 whole-mount Cck-ires-Cre Ai9 retina. (C) Vibratome section of a P21Cck-ires-Cre Ai9 retina showing tdTomato expression in some amacrine cells, RGCs, and B6 cells. The latter is confirmed by immunostaining of synaptotagmin II (SytII), an axonal marker of B2 and B6 cells. (D and E) Representative EPSC traces (D) and summary data of excitatory conductances (E) of ONα-RGCs elicited by optogenetic stimulation of B6 cells in the absence (black) or presence (blue) of AMPA and NMDA receptor antagonists (Ctrl: 12.81 ± 2.54 nS, -GluR: : 0.08 ± 0.11 nS, n = 8, p = 0.002). L-AP4, ACET and hexamethonium were included in the bath all the time. (F) Schematic of the AAV virus injected for pharmacogenetic silencing experiments. (G and I) Representative EPSC traces (G) and spike responses (I) of ONα-RGCs in AAV-Grm6S-PSAMcon injected retinas before (Before), during (PSEM) and after (Wash) the addition of PSEM308. (H and J) Summary data of excitatory conductances (H) and spike responses (J) of ONα-RGCs with (PSAM) or without (Ctrl) AAV-Grm6S-PSAMcon injection before (Before), during (PSEM) and after (Wash) the addition of PSEM308. Circles (error bar) indicate mean (±SEM) of respective population. In (H), PSAM: PSEM 0.479 ± 0.064 (mean ± SEM); Wash 1.370 ± 0.163; Before vs PSEM p = 4 *10−5; PSEM vs Wash p = 5 *10−4; Before vs Wash p = 0.053. In (H), Control: PSEM 1.088 ± 0.064; Wash 1.321 ± 0.108; Before vs PSEM p = 0.19; PSEM vs Wash p = 0.068; Before vs Wash p = 0.009. In (J), PSAM: PSEM 0.489 ± 0.121; Wash 1.177 ± 0.160; Before vs PSEM p = 0.02; PSEM vs Wash p = 0.03; Before vs Wash p = 0.349. In (J), Control: PSEM 1.343 ± 0.081; Wash 1.409 ± 0.127; Before vs PSEM p = 0.006; PSEM vs Wash p = 0.53; Before vs Wash p = 0.02.
To test for functional connectivity of B6 cells with ONα-RGCs, we crossed Cck-ires-Cre mice to a strain in which channelrhodopsin-2 is expressed wherever Cre-mediated recombination occurs (Ai32) (Madisen et al., 2012). With photoreceptor input to bipolar cells blocked by application of L-AP4 and ACET, and cholinergic transmission blocked by inclusion of hexamethonium, optogenetic stimulation of B6 cells elicited large excitatory postsynaptic currents (EPSCs) in ONα-RGCs (Figure 1D and 1E). These currents were sensitive to AMPA and NMDA receptor antagonists, demonstrating that B6 cells provide glutamatergic input to ONα-RGCs.
To probe the contributions of B6 input to photoreceptor-mediated light responses of ONα-RGCs, we generated adeno-associated viruses (AAVs) that drive expression of the pharmacogenetic silencer PSAML141F, Y115F-GlyR-IRES-GFP (Magnus et al., 2011), PSAM for short, from promoter elements of the metabotropic glutamate receptor 6 (Grm6S) (Lagali et al., 2008), conditioned upon Cre-mediated recombination (AAV-Grm6S-PSAMcon, Figure 1F). Because Grm6S sequences promote transcription only in ON bipolar cells (Lagali et al., 2008), their intersection with CCK-ires-Cre should restrict expression to B6 cells. We generated AAV-Grm6S-GFPcon by removing PSAM-IRES sequences from AAV-Grm6S-PSAMcon, to improve visualization of GFP. After injection of AAV-Grm6S-GFPcon intravitreally in CCK-IRES-Cre Ai9 mice, GFP expression was restricted to the bipolar cell layer, and nearly all GFP-positive cells (99%) were also tdTomato positive (Figure S2). This confirmed the cell-type-specificity of our intersectional strategy. Next, we injected AAV-Grm6S-PSAMcon in CCK-ires-Cre mice. In retinas of these mice, application of the exogenous ligand PSEM308 greatly reduced light-evoked EPSCs (Figures 1G and 1H) and spike responses of ONα-RGCs (Figures 1I and 1J). By contrast, without AAV-Grm6S-PSAMcon injections, PSEM308 had no significant effect on EPSCs of ONα-RGCs (Figure 1H) and slightly enhanced their spike responses (Figure 1J). EPSCs and firing rates of ONα-RGCs were increased upon washout of PSEM308 irrespective of PSAM expression, likely due to off-target effects of the agonist. (Figures 1H and 1J). Given that AAVs infected only a subset of B6 cells (Figure S2), the strong pharmacogenetic suppression of EPSCs, together with previous anatomical studies (Morgan et al., 2011; Schwartz et al., 2012) and results from optogenetics, suggests that B6 cells dominate excitatory input to and are required for normal light responses of ONα-RGCs.
We next measured excitatory input to ONα-RGCs during brief (250 ms) steps of varying contrast in a 300-μm diameter spot centered on the recorded cell. In addition to reducing the amplitude of tonic and stimulus-evoked EPSCs, application of PSEM308 in AAV-Grm6S-PSAMcon-injected mice, resulted in less inwardly rectified excitatory contrast response functions (Figure S2), indicating that the functional properties of B6 input differ from those of non-B6 inputs to ONα-RGCs.
An intersectional transgenic strategy to remove B6 cells from the developing retina
To probe interactions of converging bipolar cell types during ONα-RGC innervation, we next wanted to remove selectively B6 cells from the developing retina. We devised an intersectional strategy similar to that used for pharmacogenetic silencing of B6 cells (Figure 1F), and crossed mice that conditionally express an attenuated version of diphtheria toxin in ON bipolar cells (Grm6L-YFP-DTAcon, Figure 2A) (Morgan et al., 2011) to CCK-ires-Cre mice. We refer to double transgenic offspring from these crosses as B6-DTA mice from here on. To estimate the time course of DTA expression in these mice, we first counted tdTomato-expressing bipolar cells in CCK-ires-Cre Ai9 mice at different ages. The number of these cells increased dramatically from postnatal day 10 (P10) to P15 (Figure 2B). Because Ai9 can express tdTomato in the retina at least from birth on (data not shown), this time course likely reflects the rise of Cre in B6 cells. By comparison, yellow fluorescent protein (YFP) in Grm6L-YFP-DTAcon and other fluorescent proteins in other Grm6L transgenics become detectable between P3 and P7 (Kerschensteiner et al., 2009; Morgan et al., 2006; Morgan et al., 2011). Thus, the onset of DTA expression in B6-DTA mice appears to be limited by Cre expression and falls between P10 and P15.
Figure 2. An intersectional strategy to remove B6 cells from the developing retina.
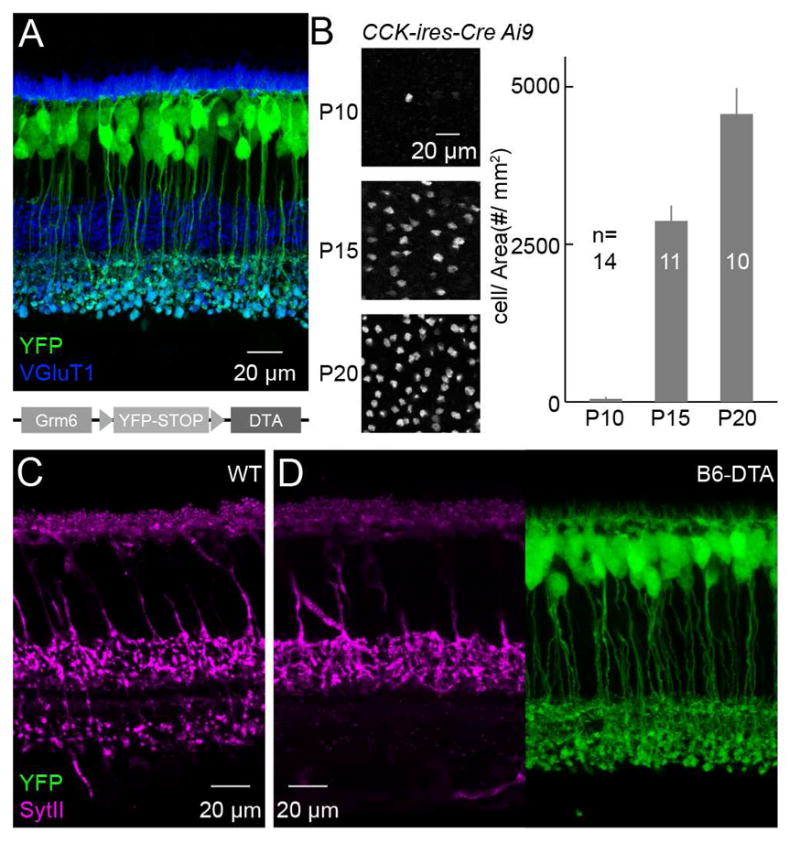
(A) Representative image of a retinal section showing YFP expression in a Grm6L-YFP-DTAcon mouse retina without Cre-recombination. Schematic at the bottom illustrates the genetic construct used to generate Grm6L-YFP-DTAcon mice. (B) Representative images (left) and summary data (right) for the timecourse of tdTomato expression in CCK-ires-Cre Ai9 mice. P10: 48.5 ± 30.5 # / mm2 (mean ± SEM); P15: 2872.2 ± 245.6 # / mm2; P20: 4569.3 ± 411.9 # / mm2. (C and D) Vertical sections of wild-type (C) and B6-DTA (D) retinas stained for SytII and, in (D), YFP. SytII and YFP signals from the same section are shown side by side in (D).
To evaluate the extent and specificity of B6 cell removal in B6-DTA mice, we stained sections and flat mounts of P20 retinas for SytII. In wild-type retinas, SytII labeled B2 and B6 axons in the ON and OFF sublamina of the IPL, respectively. In B6-DTA mice, SytII staining in the ON sublamina was lost, but staining in the OFF sublamina was unchanged (Figures 2C and 2D). In addition, YFP expression in non-B6 ON bipolar cell types was unaffected in B6-DTA mice. We quantified these observations in retinal flat mounts (Figure S3), confirming that >95 % of B6 cells are removed from B6-DTA retinas by P21. Moreover, the reduction in the density of all ON bipolar cells in B6-DTA mice matched the density of B6 cells in wild-type mice (Figures 2B and S3F). Approximately half of the B6 cells in B6-DTA retinas were deleted by P15 (Figure S3), indicating that the time course of cell removal closely matched that of Cre expression. Together, these results show that B6 cells are removed selectively and nearly completely from B6-DTA retinas during the period of bipolar cell-RGC synaptogenesis (Fisher, 1979; Morgan et al., 2008; Morgan et al., 2011).
Effects of B6 cell removal on ONα-RGC dendrites and synapses
To begin to analyze effects of B6 cell removal on ONα-RGCs, we biolistically labeled these cells with cytosolic tdTomato and postsynaptic density protein 95 fused to YFP (PSD95-YFP), a marker of excitatory synapses (Kerschensteiner et al., 2009; Morgan et al., 2011). We found that stratification and length of ONα-RGC dendrites were indistinguishable between B6-DTA mice and wild-type littermates (Figures 3A–3D). The density of PSD95-YFP puncta on ONα-RGC dendrites was reduced in B6-DTA mice (Figure 3E), but only by 30 %, much less than the fraction of synapses (70 %) contributed by B6 cells in wild-type mice (Morgan et al., 2011; Schwartz et al., 2012). This suggests that either many PSD95-YFP puncta in B6-DTA mice are not apposed by presynaptic release sites (i.e. orphan postsynapses), or that other bipolar cells take over ONα-RGC innervation from B6 cells. To distinguish between these possibilities, we stained retinas with biolistically labeled ONα-RGCs for CtBP2, a component of presynaptic ribbons in bipolar cells (Schmitz et al., 2000) (Figure 3F). An identical fraction (85 %) of PSD95-YFP puncta on ONα-RGC dendrites colocalized with CtBP2 in B6-DTA mice and wild-type littermates (Figure 3G), indicating that in the absence of B6 cells other bipolar cells increase their connectivity with ONα-RGCs.
Figure 3. Effects of B6 cell removal on ONα-RGC dendrites and synapses.

(A and B) Top-down (top) and side (bottom) views of ONα-RGCs biolistically labeled with cytosolic tdTomato and PSD95-YFP in wild-type (A) and B6-DTA (B) retinas. Insets show enlarged views of PSD95-YFP puncta along ONα-RGCs dendrites. (C–E) Summary data (mean ± SEM) of dendritic parameters of ONα-RGCs in wild-type (grey) and B6-DTA (pink) mice. In (C), WT: 1.22 ± 0.05 μm; B6-DTA: 1.29 ± 0.05 μm; p = 0.17. In (D), WT: 3471 ± 206 μm; B6-DTA: 3195 ± 166 μm; p = 0.31. In (E), WT: 0.492 ± 0.03 synapses / μm; B6-DTA: 0.347 ± 0.02 synapses / μm; p < 0.001. (F and G) Representative images (F) and summary data (G) showing the colocalization of PSD95-YFP puncta with CtBP2 in wild-type (top row) and B6-DTA (bottom row) ONα-RGCs. In (G), WT: 86.7 ± 1.9 %; B6-DTA: 84.4 ± 2.2 %; p = 0.44.
Cell-type-specific rewiring of cone bipolar cells with ONα-RGCs in B6-DTA mice
Dendrites of ONα-RGCs overlap with axons of several ON cone bipolar cells types (B6, B7, B8, and XBC) (Dunn and Wong, 2014; Helmstaedter et al., 2013; Morgan et al., 2011). We wanted to test which of these replace input from B6 cells in B6-DTA mice, and whether rewiring occurs by uniform upregulation of connectivity or is cell type specific. We sparsely labeled ON bipolar cells by intravitreal injection of a virus expressing tdTomato under control of Grm6S (AAV-Grm6S-tdTomato, Figure 4A), and biolistically labeled ONα-RGCs and bipolar cell-RGC synapses with cytosolic YFP and PSD95-CFP, respectively. This allowed us to analyze the connectivity of pairs of individual bipolar cells and ONα-RGCs.
Figure 4. Cell-type-specific rewiring of cone bipolar cells with ONα-RGCs following B6 cell removal.

(A) Schematic of AAV-Grm6S-tdTomato injection to sparsely label ON bipolar cells. (B and C) Examples of isolated B7 – ONα-RGC pairs in wild-type (B) and B6-DTA (C) retinas. Maximum intensity projections of confocal image stacks are shown on the left. The panels on the right show single planes from the image stacks at contact points between B7 cell axons (red) and ONα-RGC dendrites (blue). Synapses were identified by PSD95 puncta (green). (D–F) Summary data for axon territories (D), axo-dendritic contacts (E) and synapse numbers (F) for B7 – ONα-RGC pairs in wild-type (grey) and B6-DTA (pink) retinas. In (D), WT: 229 ± 18 μm2 (mean ± SEM); B6-DTA: 245 ± 28 μm2; p = 0.63. In (E), WT: 4.38 ± 0.68; B6-DTA: 3.89 ± 0.93; p = 0.68. In (F), WT: 2.56 ± 0.56; B6-DTA: 5.22 ± 0.98; p < 0.05. (G–K) Analogous to B and C (G and H) and D–F (I–K) but for XBC – ONα-RGC pairs. In (I), WT: 393 ± 54μm2; B6-DTA: 344 ± 38 μm2; p = 0.47. In (J), WT: 2.50 ± 0.92; B6-DTA: 1.90 ± 0.31; p = 0.56. In (K), WT: 0.00 ± 0.00; B6-DTA: 1.30 ± 0.47; p = 0.02. (L–P) Analogous to B and C (L and M) and D–F (N–P) but for B8 – ONα-RGC pairs. In (N), WT: 897 ± 210 μm2; B6-DTA: 724 ± 210 μm2; p = 0.47. In (O), WT: 8.68 ± 0.9; B6- DTA: 5.83 ± 1.66; p = 0.17. In (P), WT: 6.14 ± 0.84; B6-DTA: 5.17 ± 1.74; p = 0.63.
We distinguished bipolar cell types by their characteristic dendritic and axonal morphologies (Dunn and Wong, 2012; Helmstaedter et al., 2013; Morgan et al., 2011; Wassle et al., 2009). B7 cells were previously characterized as a minor input to ONα-RGCs (Morgan et al., 2011; Schwartz et al., 2012). We confirmed these observations in wild-type mice and found that in B6-DTA retinas, B7 cells more than doubled the number of connections with ONα-RGCs (Figures 4B, C, F). This was accomplished without changes in the axon territories of B7 cells (Figure 4D) or the number of contacts between B7 axons and ONα-RGC dendrites (Figure 4E), by conversion of a larger fraction of contacts to synapses (i.e. connectivity fraction). In wild-type mice, axons of XBC cells occasionally touched dendrites of ONα-RGCs, but none of these contacts bore synapses (Figures 4G, 4J, 4K). In B6-DTA mice, XBC axon size and contact numbers with ONα-RGCs did not change, but nearly all contacts contained synapses (Figures 4H–4K). However, bipolar cell connectivity was not uniformly upregulated in B6-DTA mice, as the large axons of B8 cells, which formed a significant number of synapses with ONα-RGCs in wild-type mice, were unchanged in their morphology and connectivity (Figures 4L–4P). Thus, B6 cell removal from developing circuits triggers cell-type-specific rewiring of cone bipolar cells with ONα-RGCs, which elevates a minor input to become the major one (B7), recruits a novel input type (XBC), and leaves unaltered the connections of another (B8). Rewiring is accomplished by selective changes in the connectivity fraction of bipolar cell axons without changes to their morphology or the frequency of contacts between bipolar cell axons and ONα-RGC dendrites.
Increased direct input from rod bipolar cells to ONα-RGCs in B6-DTA mice
In wild-type mice, rod bipolar cells (RBCs) provide input to ONα-RGCs - and other RGCs - predominantly by an indirect path: RBC axons form excitatory synapses with AII amacrine cells, which are electrically coupled to ON cone bipolar cells, which convey signals to ONα-RGCs (Bloomfield and Dacheux, 2001; Demb and Singer, 2015). During development, RBCs initially form synapses with ONα-RGC dendrites, but subsequently eliminate most of their connections as B6 cells increase connectivity with ONα-RGCs (Morgan et al., 2011). We wondered whether RBCs retain synapses with ONα-RGCs in B6-DTA mice, in which B6 cells are removed during development. We sparsely labeled RBCs by AAV-Grm6S-tdTomato injections, and ONα-RGCs and excitatory synapses by biolistics. Similar to our observations for cone bipolar cells, we found that axon territories and the number of contacts with ONα-RGC dendrites did not change for RBCs in B6-DTA mice (Figures 5A–5D). However, the probability of synaptic connections more than doubled (Figure 5E), suggesting that RBCs retain synapses with ONα-RGCs when B6 cells are removed.
Figure 5. Increase in connectivity between rod bipolar cells and ONα-RGCs in B6-DTA mice.

(A and B) Examples of isolated RBC – ONα-RGC pairs in wild-type (A) and B6-DTA (B) retinas. Maximum intensity projections of confocal image stacks are shown on the left. The panels on the right show single planes from the image stacks at contact points between RBC axons (red) and ONα-RGC dendrites (blue). (C–E) Summary data of axon territories (C), axo-dendritic contacts (D), and synapses (E) for RBC – ONα-RGC pairs in wild-type (grey) and B6-DTA (pink) retinas. In (C) WT: 63.9 ± 2.5 μm2; B6-DTA: 61.30 ± 2.36 μm2; p = 0.46. In (D), WT: 1.54 ± 0.11; B6-DTA: 1.46 ± 0.08; p = 0.58. In (E), WT: 0.36 ± 0.07; B6-DTA: 0.85 ± 0.11; p = 2 * 10−4. (F and G) Representative EPSC traces (F) and summary data (G) of ONα-RGC responses to dim light steps (3 rhodopsin isomerizations / rod /s or R*) in the absence (left, Ctrl) or presence (right, MFA) of MFA. In (G) WT: 13.6 ± 0.8 %; B6-DTA: 25.6 ± 4.5 %; p = 0.03.
Indirect input from RBCs to ONα-RGCs depends on gap junctions between AII amacrine cells and ON cone bipolar cells, whereas direct synaptic input does not. In patch clamp recordings from ONα-RGCs, we found that a larger fraction of excitatory input elicited by stimuli that predominantly recruit the RBC pathway (Murphy and Rieke, 2006) was resistant to the gap junction blocker meclofenamic acid (MFA) in B6-DTA mice compared to wild-type littermates (Figures 5F and 5G). This shows that anatomical rewiring mediates changes in functional connectivity in B6-DTA mice, which involve both cone and rod bipolar cells.
Bipolar cell rewiring precisely preserved light responses of ONα-RGCs in B6-DTA mice
Our pairwise analysis revealed cell-type-specific changes in the connectivity of bipolar cells with ONα-RGCs in B6-DTA mice (Figures 4 and 5). We hypothesized that ONα-RGCs recruit bipolar cell types in specific ratios (Figure S4) (see STAR Methods) to best replace the input from B6 cells and to preserve their characteristic light responses. To test this hypothesis, we analyzed light responses of ONα-RGCs using patch clamp recordings. In stark contrast to acute pharmacogenetic silencing of B6 cells (Figures 1G–1J), the amplitudes of excitatory inputs and spike responses of ONα-RGCs were not significantly different between B6-DTA mice and wild-type littermates (Figures 6A–6H). This was true both for stimuli preferentially activating rods (Figures 6A, 6B, 6D, and 6E) and for stimuli preferentially activating cones (Figures 6G, 6H, 6J and 6K). Moreover, the characteristic contrast response functions of ONα-RGC EPSCs and spiking (Murphy and Rieke, 2006; Zaghloul et al., 2003), were precisely preserved in B6-DTA mice in dim (Figures 6C and 6F) and bright light conditions (Figures 6I and 6L).
Figure 6. Cell-type-specific rewiring preserves contrast responses of ONα-RGCs in B6-DTA mice.

(A and D) Representative EPSC traces (A) and spike responses (D) of ONα-RGCs in wild-type (grey) and B6-DTA (pink) mice in illumination conditions preferentially activating rods (mean intensity: 1.5 R*). (B and E) Summary data of excitatory conductances (B) and spike responses (E) of ONα-RGCs in wild-type (grey) and B6-DTA (pink) mice in illumination conditions preferentially activating rods. In (B), WT: 5.16 ± 0.55 nS; B6-DTA: 4.69 ± 0.35 nS; p = 0.48. In (E), WT: 70 ± 6.9 sp / s; B6-DTA: 78.3 ± 11.9 sp / s; p = 0.56. (C and F) Contrast response functions of the normalized excitation (C, WT: n = 11; B6-DTA: n = 9) and spike rate (F, WT: n = 12; B6-DTA: n = 10). (G and J) Analogous to A (G) and D (J), but in conditions preferentially activating cones (mean intensity: 1,500 R*). (H and K) Analogous to B (H) and E (K) but in illumination conditions preferentially activating cones. In (H), WT: 7.98 ± 1.48 nS; B6-DTA: 6.05 ± 0.92 nS; p = 0.29. In (K), WT: 112.4 ± 10.5 sp / s; B6-DTA: 120.4 ± 9.9 sp / s; p = 0.59. (I and L) Analogous to C (I, WT: n = 9; B6-DTA: n = 5) and F (L, WT: n = 14; B6-DTA: n = 8) but in illumination conditions preferentially activating cones.
In addition to contrast responses, the temporal tuning of RGCs is determined by combined input from different bipolar cell types with unique response kinetics (Baden et al., 2013; Borghuis et al., 2013; Franke et al., 2017; Ichinose et al., 2014). Measuring EPSCs during white noise stimulation, we found that the temporal tuning of bipolar cell input to ONα-RGCs was indistinguishable between B6-DTA mice and wild-type littermates (Figure 7A–7D).
Figure 7. Cell-type-specific rewiring preserves temporal tuning of ONα-RGCs in B6-DTA mice.
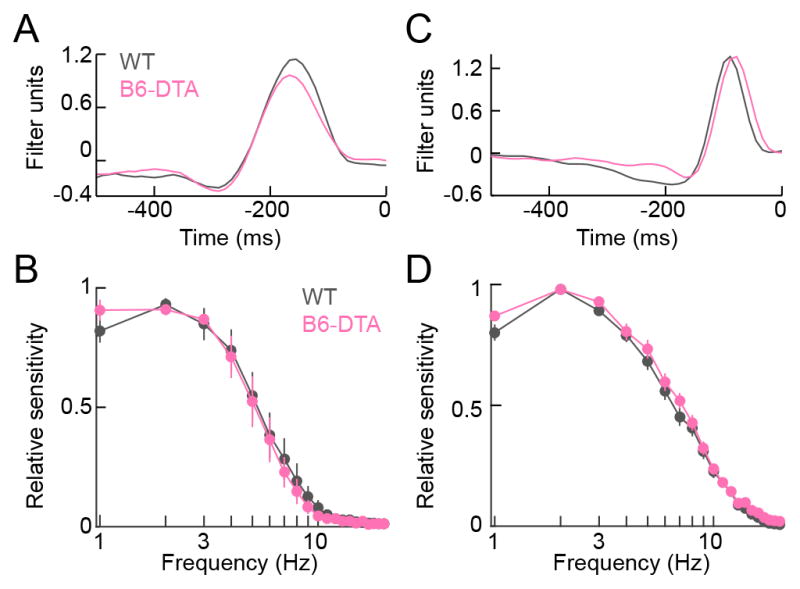
(A and C) Representative response-weighted stimulus response profiles of excitatory input to ONα-RGCs in conditions preferentially activating rods (A, mean intensity: 1.5 R*) and in conditions preferentially activating cones (C, mean intensity: 1,500 R*) recorded in wild-type (grey) and B6-DTA (pink) retinas. (B and D) Summary data (mean ± SEM) of temporal frequency-response functions computed from Fourier transforms of response-weighted stimulus response profiles in conditions preferentially activating rods (B, WT: n = 9, grey; B6-DTA: n = 8, pink) and in conditions preferentially activating cones (C, WT: n = 17, grey; B6-DTA: n = 17, pink).
Although our results clearly showed that presynaptic rewiring contributed to the preservation of ONα-RGCs’ light responses, it was unclear, whether postsynaptic scaling also played a role in this homeostasis (Pozo and Goda, 2010; Turrigiano, 2008). To address this question, we recorded spontaneous EPSCs (sEPSCs) from ONα-RGCs in wild-type and B6-DTA retinas. Recordings were performed in conditions that lowered the probability of vesicle fusion (i.e. zero extracellular calcium) to reduce coincidence of bipolar cell release events. We found that the distributions of sEPSC amplitudes were indistinguishable between wild-type and B6-DTA retinas (Figure S5). To explore further possible postsynaptic plasticity, we focally puffed glutamate onto dendrites of ONα-RGCs while recording EPSCs. We included a fluorescent dye (Alexa 488) in the puff solution and used 2-photon imaging to measure the application area. These experiments revealed smaller amplitudes of EPSCs per application area in B6-DTA mice compared to wild-type littermates (Figure S5). The amplitude reduction (31.6%) matched closely the reduction in synapse density on ONα-RGCs’ dendrites (29%) (Figure 3E). Together these findings exclude broad changes in postsynaptic strength as a major contributor to the response homeostasis, and support the notion that, following B6 removal, ONα-RGCs adjust their connectivity with other bipolar cell types in specific ratios to replace the lost input and to preserve precisely their light responses (i.e. circuit-level homeostatic plasticity).
DISCUSSION
During development, most postsynaptic neurons recruit multiple presynaptic partners (i.e. convergence), and by establishing precise numbers of synapses with each partner attain specific function. Whether postsynaptic neurons establish cell-type-specific connectivity patterns with each input independently, or balance synapses from different input types to achieve specific function is unclear (Okawa et al., 2014b; Yogev and Shen, 2014). Here, we addressed this question in the convergent innervation of ONα-RGCs by bipolar cells.
Anatomical studies suggested that ONα-RGCs receive input from multiple bipolar cell types, with B6 cells contributing approximately 70 % of the excitatory synapses (Morgan et al., 2011; Schwartz et al., 2012; Soto et al., 2012). In our study, optogenetic activation of B6 cells elicited large EPSCs in ONα-RGCs (Figure 1), indicating that functional connectivity in the inner retina matches anatomical connectivity (Morgan and Lichtman, 2013), and that anatomical connectivity was correctly inferred from light microscopic circuit reconstructions (Figures 4 and 5) (Morgan et al., 2011; Schwartz et al., 2012; Soto et al., 2012).
Understanding how signals from the 15 bipolar cell types are distributed and mixed among the 30–40 RGC types is a major challenge in deciphering the functional organization of the retina (Asari and Meister, 2012; Baden et al., 2016; Euler et al., 2014). The results of our pharmacogenetic silencing experiments (Figure 1) indicate that in wild-type mice the light responses of ONα-RGCs are dominated by a single bipolar cell type (B6). These data are consistent with a recent receptive field model, which accurately predicts responses of ONα-RGCs to a variety of stimuli based on their input from B6 cells (Schwartz et al., 2012). Whether dominant input from a single bipolar cell type is the rule or an exception among RGCs remains to be determined (Calkins and Sterling, 2007).
Using an intersectional transgenic strategy (B6-DTA mice), we selectively removed B6 cells from the developing retina (Figure 2). In B6-DTA mice, ONα-RGCs increased their connectivity with B7 cells, converting this minor input into the major one, formed connections de novo with XBCs (Figures 3 and 4), and maintained synapses from RBCs (Figure 5), which are normally eliminated during circuit maturation (Morgan et al., 2011). Connections of B8 cells with ONα-RGCs were unaffected by B6 removal (Figure 4). Because B8 cells form synapses with ONα-RGCs in wild-type mice, but XBCs do not, the observed rewiring cannot solely reflect competition between bipolar cells. Rewiring reveals that postsynaptic neurons can dynamically adjust connectivity with converging presynaptic inputs rather than forming a fixed number of synapses with each independently. Thus, synaptic specificity in the inner retina is plastic rather than hard-wired. To what extent this is true of other neural circuits, remains to be determined (Yogev and Shen, 2014). Interestingly, in the spinal cord, interneurons fail to innervate alternative partners when their primary targets (i.e. sensory fibers) are removed during development (Betley et al., 2009). Differences in the stringency of synaptic specificity may have arisen to limit plasticity to circuits whose function it benefits.
In the retina, as elsewhere in the nervous system, multiple cellular mechanisms are sequentially engaged to establish synaptic specificity (Sanes and Yamagata, 2009; Williams et al., 2010; Yogev and Shen, 2014). Relatively early during development, bipolar cell axons and RGC dendrites stratify in narrow sublaminae of the IPL (Kerschensteiner et al., 2009; Kim et al., 2010; Morgan et al., 2006; Morgan et al., 2008). Laminar targeting constrains potential connectivity, differs between cell types, and is determined by a combination of repulsive and adhesive cues (Duan et al., 2014; Matsuoka et al., 2011a; Matsuoka et al., 2011b; Yamagata and Sanes, 2008, 2012). After lamination is complete, connectivity patterns of co-stratifying bipolar cell axons are initially similar, but subsequently diverge through cell-type-specific changes in the conversion of axo-dendritic contacts into synapses (i.e. connectivity fraction) (Morgan et al., 2011). We find that plasticity elicited by B6 removal selectively engages this mechanism. The morphologies of bipolar cell axons and ONα-RGC dendrites, and the numbers of contacts between them are unchanged in B6-DTA compared to wild-type mice, but the connectivity fractions of axo-dendritic contacts are altered in a cell-type-specific manner (Figures 3–5). Because bipolar cell types with similar responses show overlapping axonal stratification patterns (Baden et al., 2013; Borghuis et al., 2013; Euler et al., 2014; Franke et al., 2017), rewiring within a constant laminar position may best allow ONα-RGCs to regain their specific function. Even within a constant laminar position, however, ONα-RGCs make distinct choices in normal development (Morgan et al., 2011) and in plasticity (e.g. not to increase connectivity with B8). Furthermore, it is worth noting that the laminar constraint on rewiring is not absolute. Thus, when several ON cone bipolar cell types as well as rod bipolar cells are removed during development, ONα-RGC extend dendritic arbors into outer IPL and recruit input from OFF cone bipolar cells (Okawa et al., 2014a).
Homeostatic plasticity had previously been shown to stabilize average firing rates (Hengen et al., 2013; Turrigiano and Nelson, 2004) and spontaneous activity patterns of neurons (Blankenship and Feller, 2010; Kerschensteiner, 2014), but how it regulates their unique circuit functions remained unclear. In assessing the functional consequences of plasticity in B6-DTA mice, we find that it not only rescues overall activity levels of ONα-RGCs, but indeed precisely restores their contrast (Figure 6) and temporal response properties (Figure 7), both of which RGCs inherit from their combined bipolar cell inputs. Our sEPSC recordings and glutamate puff experiments suggest that postsynaptic scaling does not play a major role in this response preservation (Figure S5). Instead, homeostatic plasticity controls cell-type-specific wiring of presynaptic inputs (i.e. bipolar cells) expanding its reach beyond the intrinsic and synaptic mechanisms previously characterized at the level of individual neurons (Pozo and Goda, 2010; Turrigiano, 2008; Wefelmeyer et al., 2016). In this way, circuit-level homeostatic plasticity shapes cell-type-specific wiring in the inner retina and stabilizes visual information sent to the brain.
STAR METHODS
CONTACT FOR REAGENT AND RESOURCE SHARING
Further information and requests for reagents should be directed to and will be fulfilled by the Lead Contact, Daniel Kerschensteiner (kerschensteinerd@wustl.edu).
EXPERIMENTAL MODEL AND SUBJECT DETAILS
Mice
Throughout this study, we used CCK-ires-Cre (Taniguchi et al., 2011) mice (i) crossed to a tdTomato reporter strain (Ai9) (Madisen et al., 2010), (ii) crossed to a channelrhodopsin-2 reporter strain (Ai32) (Madisen et al., 2012), (iii) crossed to mice in which a 9 kb fragment of the Grm6 promoter (i.e. Grm6L) (Ueda et al., 1997) drives expression of YFP or, upon Cre-mediated recombination, of an attenuated version of diphtheria toxin Grm6L-YFP-DTAcon (Morgan et al., 2011), or (iv) injected with AAVs. For our experiments, we isolated retinas from young adult (postnatal day 20–40) mice of both sexes. All procedures were approved by the Animal Studies Committee of Washington University School of Medicine and performed in compliance with the National Institutes of Health Guide for the Care and Use of Laboratory Animals.
METHOD DETAILS
Adeno-associated viruses
To label ON cone bipolar and rod bipolar cells, we generated adeno-associated viruses (AAVs) in which four concatenated repeats of a 200 bp fragment of the Grm6 promoter (Grm6S) (Lagali et al., 2008) drive expression of tdTomato, a red fluorescent protein (plasmid: pAAV-Grm6S-tdT). The pAAV-Grm6S-PSAMcon vector for pharmacogenetic silencing was derived by replacing tdTomato sequences of pAAV-Grm6S-tdT with a FLEX-rev-PSAML141F, Y115F-GlyR-IRES-GFP cassette (Addgene plasmid: 32480) (Magnus et al., 2011). The pAAV-Grm6s-GFPcon plasmid was generated by removing PSAM-IRES sequences from pAAV-Grm6S-PSAMcon. Viral particles were packaged and purified as previously described (Grimm et al., 2003; Klugmann et al., 2005). Briefly, AAV1/2 chimeric virions were produced by co-transfecting HEK-293 cells with pAAV-Grm6S-tdT, pAAV-Grm6S-PSAMcon or pAAV-Grm6s-GFPcon, and helper plasmids encoding Rep2 and the Cap for serotype 1 and Rep2 and the Cap for serotype 2. Forty-eight hours after transfection, cells and supernatant were harvested and viral particles purified using heparin affinity columns (Sigma). Viruses (250 nL) were injected with a NanojectII (Drummond) into the vitreous chamber of newborn mice anesthetized on ice.
Tissue preparation
Mice were euthanized with CO2 followed by decapitation and enucleation. For imaging, eyes were transferred into oxygenated mouse artificial cerebrospinal fluid (mACSFHEPES) containing (in mM): 119 NaCl, 2.5 KCl, 1 NaH2PO4, 2.5 CaCl2, 1.3 MgCl2, 20 HEPES, and 11 glucose (pH adjusted to 7.37 using NaOH). Retinas were either isolated and mounted flat on filter paper, or left in the eyecup for 30 min fixation with 4 % paraformaldehyde in mACSFHEPES (Tien et al., 2016). For patch clamp recordings, mice were dark adapted at least 2 hr before their retinas were isolated under infrared illumination (> 900 nm) in oxygenated mACSFNaHCO3 containing (in mM) 125 NaCl, 2.5 KCl, 1 MgCl2, 1.25 NaH2PO4, 2 CaCl2, 20 glucose, 26 NaHCO3 and 0.5 L-glutamine equilibrated with 95 % O2 / 5 % CO2 (Tien et al., 2016).
Immunohistochemistry
After blocking for 2 hr with 5 % Normal Donkey Serum in PBS, vibratome slices (60 μm in thickness) embedded in 4 % agarose (Sigma) were incubated overnight at 4 °C with primary antibodies. Slices were then washed in PBS (3 × 20 min) and incubated in secondary antibodies for 2 hr at room temperature. Flat-mount preparations were frozen and thawed three times after cryoprotection (1 hr 10 % sucrose in PBS at RT, 1 hr 20 % sucrose in PBS at RT, and overnight 30 % sucrose in PBS at 4 °C), blocked with 5 % Normal Donkey Serum in PBS for 2 hr, and then incubated with primary antibodies for 5 d at 4 °C and washed in PBS (3 × 1 hr) at RT. Subsequently, flat mounts were incubated with secondary antibodies for 1 d at 4 °C and washed in PBS (3 × 1 hr) at room temperature. The following primary antibodies were used in this study: mouse anti-synaptotagmin II (znp-1, 1:500, Zebrafish International Resource Center), rabbit anti-tdTomato (1:1000, Clontech Laboratories), guinea pig anti-VGluT1 (1:500, Millipore), chicken anti-GFP (1:500, thermos Fisher Scientific) and mouse anti-CtBP2 (1:500, BD Biosciences). Secondary antibodies were Alexa 568- and Alexa 633 conjugates (1:1000, Invitrogen).
Electrophysiology
Cell-attached and whole-cell patch clamp recordings were obtained in the dorsal halves (Wang et al., 2011) of dark-adapted flat-mounted retinas superfused (5–7 mL / min) with warm (30–33 °C) mACSFNaHCO3 as previously described (Tien et al., 2016). ONα-RGCs were selected under infrared illumination based on their large soma size (diameter > 20 μm); and correct targeting was confirmed by inclusion of Alexa 488 or Alexa 568 (0.1 mM) in the intracellular solution and 2-photon imaging at the end of each recording. The intracellular solution for current-clamp recordings contained (in mM) 125 K-gluconate, 10 NaCl, 1 MgCl2, 10 EGTA, 5 HEPES, 5 ATP-Na2, and 0.1 GTP-Na (pH adjusted to 7.2 with KOH). The intracellular solution voltage-clamp recordings contained (in mM) 120 Cs-gluconate, 1 CaCl2, 1 MgCl2, 10 Na-HEPES, 11 EGTA, 10 TEA-Cl, 2 Qx314, ATP-Na2, and 0.1 GTP-Na (pH adjusted to 7.2 with CsOH). Patch pipettes had resistances of 3–6 MΩ (borosilicate glass). Liquid junction potentials were corrected off-line. Signals were amplified with a Multiclamp 700B amplifier (Molecular Devices), filtered at 3 kHz (8-pole Bessel low-pass), and sampled at 10 kHz (Digidata 1440A, Molecular Devices). Excitatory postsynaptic currents (EPSCs) were measured at the reversal potential of inhibitory (−60 mV) conductances. For optogenetic experiments, the following reagents were applied individually or in combinations: L-AP4 (20 μM, Tocris), ACET (10 μM, Tocris), HEX (300 μM, Tocris), D-AP5 (30 μM, Tocris) and NBQX (40 μM, Tocris). For pharmacogenetic silencing, PSEM308 (20 μM, Apex Scientific Inc.) was bath-applied for at least 15 min. Meclofenamic acid (MFA, 200 μM, Sigma) was used to block gap junctions. To isolate the spontaneous excitatory synaptic currents (sEPSCs), the tissue was bathed in mACSFNaHCO3 with zero calcium concentration to block neurotransmission. In puff experiments, glutamate (1 mM in mACSFNaHCO3, Sigma) was focally applied near the primary dendrites of ONα-RGCs by delivering pressure (5 psi) to a patch pipette via a Picospritzer II (Parker Hannifin). Alexa 488 (0.1 mM) was included in the puff solution to estimate the application area under two-photon imaging (Akrouh and Kerschensteiner, 2013). Two to three primary dendrites were tested per cell, and five to six puffs of glutamate of various durations (5–100 ms) were applied to the same location.
Light stimulation
For optogenetic experiments, light from a mercury bulb (Olympus) was band-pass filtered (426–446 nm, Chroma) and focused onto RGC side of the retina (intensity: 3.15 × 10⁻⁴ W / mm2) through a 20 × 0.95 NA water immersion objective. Stimulus timing was controlled by a Uniblitz shutter (Vincent Associates). To probe photoreceptor-mediated light responses, stimuli were written in MATLAB (The MathWorks), presented on an organic light-emitting display (eMagin; refresh rate, 60 Hz) using Cogent graphics extensions (John Romaya, University College London, London, UK), and focused onto the photoreceptor side of the retina via a substage condenser. Stimuli were centered on the soma of the recorded cell with mean intensity of either 1.5 or 1500 rhodopsin isomerization / rod / s (R*). To test contrast sensitivity, short luminance steps (250 ms) were presented every 2.25s in a circular area (diameter: 300 μm). To probe spatiotemporal tuning, the stimulus display was divided into vertical bars (width: 50 μm, height: 600 μm), and the intensity of each bar randomly updated from a Gaussian distribution every 33 ms (refresh rate: 30 Hz) for 15 min.
Biolistic transfection
Gold particles (1.6 μm diameter, Bio-Rad) were coated with plasmids encoding cytosolic tdTomato or YFP under the cytomegalovirus promoter, and postsynaptic density protein 95 (PSD95) fused at its C terminus to CFP (Morgan et al., 2011). We used a helium-pressurized gun (40 psi, Bio-Rad) to deliver particles to RGCs and incubated the transfected retinas into mACSFHEPES in a humid oxygenated chamber at 33 °C for 16–18 hr.
Imaging
Images were acquired on an Fv1000 confocal microscope (Olympus) using a 20 × 0.85 NA or 60 × 1.35 NA oil immersion objective. Image stacks of ONα-RGC dendrites and synapse patterns were acquired at a voxel size 0.103–0.3 μm (x/y-z axis). Bipolar cell image stacks were acquired at a voxel size range of 0.11, 0.082 or 0.066 μm-0.3 μm (x/y-z axis). Bipolar cell types were identified by their characteristic axonal and dendritic morphology (Dunn and Wong, 2012; Helmstaedter et al., 2013; Kerschensteiner et al., 2009; Morgan et al., 2011).
QUANTIFICATION AND STATISTICAL ANALYSIS
Electrophysiology analysis
For contrast steps as well as optogenetic stimulation, baseline-subtracted averaged responses (spike rate or conductance) were measured during 100–200 ms time windows. Temporal response profiles were calculated by reverse correlation of the stimulus with the response and averaged for stimulus bars overlaying the receptive field center (i.e. response-weighted stimulus averages) (Kim et al., 2015). Frequency tuning was then computed by Fourier transforms of the temporal response profiles. All analyses above were performed using custom scripts written in MATLAB. Area and amplitude thresholds (Mini Analysis, Synaptosoft) were optimized to detect sEPSC events in each recording (Kerschensteiner et al., 2009). sEPSCs traces presented in the figures were additionally low-pass filtered at 2 kHz for display. For puff experiments, baseline-subtracted averaged responses (conductance) were normalized by the application area measured by 2-photon imaging of the Alexa 488 included in the puff solution.
Imaging Analysis
ONα-RGC dendrites and synapse patterns were reconstructed from image stacks using local thresholding in Amira (FEI Imaging) and previously described custom software written in MATLAB (Kerschensteiner et al., 2009; Morgan et al., 2008). For the stratification calculation, dendrites were skeletonized into segments of ~0.5 μm length. For each segment, the distance of its z-position to the median z-position of all segments within a 30-μm radius was computed, and this measure averaged across all segments of a cell to quantify its stratification. Use of a 30-μm radius prevents broader distortions of the tissue from influencing measurements of stratification. Dendritic skeletonization and stratification analysis was performed using custom scripts written in MATLAB (Morgan et al., 2011). Colocalization of PSD95 puncta and CtBP2 puncta was assessed visually in Fiji (Schindelin et al., 2012). The connectivity of pairs of bipolar cells and ONα-RGCs was analyzed in image stacks as previously described (Morgan et al., 2011). Briefly, dendrites of ONα-RGCs and axons of bipolar cells were masked in 3D using local thresholding in Amira. Contacts were defined as points of overlap between axon and dendrite masks exceeding 50 connected voxels; and synapses counted when PSD95 puncta were found within such a volume of axon-dendrite overlap. Bipolar cell axon territories were measured by the area of the smallest convex polygons encompassing their arbors in a maximum intensity projection.
Statistics
Paired and unpaired t-tests were used to assess the statistical significance of differences between single parameter characteristics (e.g. dendrite length) of experimental groups. Cumulative probabilities of sEPSCs amplitudes, Contrast- and temporal frequency response functions of B6-DTA mice and wild-type littermates (or before, during and after PSEM308 application) were compared using bootstrapping with 10,000 replicates. Differences in the average response curves of B6-DTA and wild-type mice were compared to differences generated by random assignments of data to the two genotypes (confidence interval: 95 %). For all figures significance corresponds to *p < 0.05, **p < 0.01, ***p < 0.001, ****p < 0.0001 for the comparisons indicated in the figure or figure legend.
Supplementary Material
Acknowledgments
We thank members of the Kerschensteiner lab for helpful comments and suggestions throughout this study, and Lei Zhao for expert technical assistance. We are grateful to Dr. Peter Lukasiewicz for lending us equipment for puff experiments. We thank Dr. Mae Gordon and her team for advice on statistics. This work was supported by the National Institutes of Health (EY023341 and EY026978 to DK and the Vision Core Grant EY0268) and the Research to Prevent Blindness Foundation (Career Development Award to DK, and an unrestricted grant to the Department of Ophthalmology and Visual Sciences at Washington University).
Footnotes
AUTHOR CONTRIBUTIONS
N.-W.T. and D.K. designed this study. N.-W.T. performed and analyzed the experiments. F.S. provided reagents. N.-W.T. and D.K. wrote software and the manuscript with input from F.S.
Publisher's Disclaimer: This is a PDF file of an unedited manuscript that has been accepted for publication. As a service to our customers we are providing this early version of the manuscript. The manuscript will undergo copyediting, typesetting, and review of the resulting proof before it is published in its final citable form. Please note that during the production process errors may be discovered which could affect the content, and all legal disclaimers that apply to the journal pertain.
References
- Akrouh A, Kerschensteiner D. Intersecting circuits generate precisely patterned retinal waves. Neuron. 2013;79:322–334. doi: 10.1016/j.neuron.2013.05.012. [DOI] [PMC free article] [PubMed] [Google Scholar]
- Antonini A, Stryker MP. Rapid remodeling of axonal arbors in the visual cortex. Science (New York, NY) 1993;260:1819–1821. doi: 10.1126/science.8511592. [DOI] [PubMed] [Google Scholar]
- Asari H, Meister M. Divergence of visual channels in the inner retina. Nat Neurosci. 2012;15:1581–1589. doi: 10.1038/nn.3241. [DOI] [PMC free article] [PubMed] [Google Scholar]
- Baden T, Berens P, Bethge M, Euler T. Spikes in mammalian bipolar cells support temporal layering of the inner retina. Current biology : CB. 2013;23:48–52. doi: 10.1016/j.cub.2012.11.006. [DOI] [PubMed] [Google Scholar]
- Baden T, Berens P, Franke K, Roman Roson M, Bethge M, Euler T. The functional diversity of retinal ganglion cells in the mouse. Nature. 2016;529:345–350. doi: 10.1038/nature16468. [DOI] [PMC free article] [PubMed] [Google Scholar]
- Betley JN, Wright CV, Kawaguchi Y, Erdelyi F, Szabo G, Jessell TM, Kaltschmidt JA. Stringent specificity in the construction of a GABAergic presynaptic inhibitory circuit. Cell. 2009;139:161–174. doi: 10.1016/j.cell.2009.08.027. [DOI] [PMC free article] [PubMed] [Google Scholar]
- Blankenship AG, Feller MB. Mechanisms underlying spontaneous patterned activity in developing neural circuits. Nat Rev Neurosci. 2010;11:18–29. doi: 10.1038/nrn2759. [DOI] [PMC free article] [PubMed] [Google Scholar]
- Bloomfield SA, Dacheux RF. Rod vision: pathways and processing in the mammalian retina. Progress in retinal and eye research. 2001;20:351–384. doi: 10.1016/s1350-9462(00)00031-8. [DOI] [PubMed] [Google Scholar]
- Borghuis BG, Marvin JS, Looger LL, Demb JB. Two-photon imaging of nonlinear glutamate release dynamics at bipolar cell synapses in the mouse retina. J Neurosci. 2013;33:10972–10985. doi: 10.1523/JNEUROSCI.1241-13.2013. [DOI] [PMC free article] [PubMed] [Google Scholar]
- Calkins DJ, Sterling P. Microcircuitry for two types of achromatic ganglion cell in primate fovea. J Neurosci. 2007;27:2646–2653. doi: 10.1523/JNEUROSCI.4739-06.2007. [DOI] [PMC free article] [PubMed] [Google Scholar]
- Davis GW, Muller M. Homeostatic control of presynaptic neurotransmitter release. Annual review of physiology. 2015;77:251–270. doi: 10.1146/annurev-physiol-021014-071740. [DOI] [PubMed] [Google Scholar]
- Demb JB, Singer JH. Functional Circuitry of the Retina. Annual Review of Vision Science. 2015;1:263–289. doi: 10.1146/annurev-vision-082114-035334. [DOI] [PMC free article] [PubMed] [Google Scholar]
- Duan X, Krishnaswamy A, De la Huerta I, Sanes JR. Type II cadherins guide assembly of a direction-selective retinal circuit. Cell. 2014;158:793–807. doi: 10.1016/j.cell.2014.06.047. [DOI] [PubMed] [Google Scholar]
- Dunn FA, Wong RO. Diverse strategies engaged in establishing stereotypic wiring patterns among neurons sharing a common input at the visual system’s first synapse. J Neurosci. 2012;32:10306–10317. doi: 10.1523/JNEUROSCI.1581-12.2012. [DOI] [PMC free article] [PubMed] [Google Scholar]
- Dunn FA, Wong RO. Wiring patterns in the mouse retina: collecting evidence across the connectome, physiology and light microscopy. J Physiol. 2014;592:4809–4823. doi: 10.1113/jphysiol.2014.277228. [DOI] [PMC free article] [PubMed] [Google Scholar]
- Ebert DH, Greenberg ME. Activity-dependent neuronal signalling and autism spectrum disorder. Nature. 2013;493:327–337. doi: 10.1038/nature11860. [DOI] [PMC free article] [PubMed] [Google Scholar]
- Euler T, Haverkamp S, Schubert T, Baden T. Retinal bipolar cells: elementary building blocks of vision. Nat Rev Neurosci. 2014;15:507–519. doi: 10.1038/nrn3783. [DOI] [PubMed] [Google Scholar]
- Fisher LJ. Development of synaptic arrays in the inner plexiform layer of neonatal mouse retina. J Comp Neurol. 1979;187:359–372. doi: 10.1002/cne.901870207. [DOI] [PubMed] [Google Scholar]
- Fox MA, Sanes JR. Synaptotagmin I and II are present in distinct subsets of central synapses. J Comp Neurol. 2007;503:280–296. doi: 10.1002/cne.21381. [DOI] [PubMed] [Google Scholar]
- Franke K, Berens P, Schubert T, Bethge M, Euler T, Baden T. Inhibition decorrelates visual feature representations in the inner retina. Nature. 2017;542:439–444. doi: 10.1038/nature21394. [DOI] [PMC free article] [PubMed] [Google Scholar]
- Grimes WN, Schwartz GW, Rieke F. The synaptic and circuit mechanisms underlying a change in spatial encoding in the retina. Neuron. 2014;82:460–473. doi: 10.1016/j.neuron.2014.02.037. [DOI] [PMC free article] [PubMed] [Google Scholar]
- Grimm D, Kay MA, Kleinschmidt JA. Helper virus-free, optically controllable, and two-plasmid-based production of adeno-associated virus vectors of serotypes 1 to 6. Molecular therapy : the journal of the American Society of Gene Therapy. 2003;7:839–850. doi: 10.1016/s1525-0016(03)00095-9. [DOI] [PubMed] [Google Scholar]
- Helmstaedter M, Briggman KL, Turaga SC, Jain V, Seung HS, Denk W. Connectomic reconstruction of the inner plexiform layer in the mouse retina. Nature. 2013;500:168–174. doi: 10.1038/nature12346. [DOI] [PubMed] [Google Scholar]
- Hengen KB, Lambo ME, Van Hooser SD, Katz DB, Turrigiano GG. Firing rate homeostasis in visual cortex of freely behaving rodents. Neuron. 2013;80:335–342. doi: 10.1016/j.neuron.2013.08.038. [DOI] [PMC free article] [PubMed] [Google Scholar]
- Ichinose T, Fyk-Kolodziej B, Cohn J. Roles of ON cone bipolar cell subtypes in temporal coding in the mouse retina. The Journal of neuroscience : the official journal of the Society for Neuroscience. 2014;34:8761–8771. doi: 10.1523/JNEUROSCI.3965-13.2014. [DOI] [PMC free article] [PubMed] [Google Scholar]
- Kerschensteiner D. Spontaneous Network Activity and Synaptic Development. Neuroscientist. 2014;20:272–290. doi: 10.1177/1073858413510044. [DOI] [PMC free article] [PubMed] [Google Scholar]
- Kerschensteiner D, Morgan JL, Parker ED, Lewis RM, Wong RO. Neurotransmission selectively regulates synapse formation in parallel circuits in vivo. Nature. 2009;460:1016–1020. doi: 10.1038/nature08236. [DOI] [PMC free article] [PubMed] [Google Scholar]
- Kim IJ, Zhang Y, Meister M, Sanes JR. Laminar restriction of retinal ganglion cell dendrites and axons: subtype-specific developmental patterns revealed with transgenic markers. J Neurosci. 2010;30:1452–1462. doi: 10.1523/JNEUROSCI.4779-09.2010. [DOI] [PMC free article] [PubMed] [Google Scholar]
- Klugmann M, Symes CW, Leichtlein CB, Klaussner BK, Dunning J, Fong D, Young D, During MJ. AAV-mediated hippocampal expression of short and long Homer 1 proteins differentially affect cognition and seizure activity in adult rats. Molecular and cellular neurosciences. 2005;28:347–360. doi: 10.1016/j.mcn.2004.10.002. [DOI] [PubMed] [Google Scholar]
- Lagali PS, Balya D, Awatramani GB, Munch TA, Kim DS, Busskamp V, Cepko CL, Roska B. Light-activated channels targeted to ON bipolar cells restore visual function in retinal degeneration. Nat Neurosci. 2008;11:667–675. doi: 10.1038/nn.2117. [DOI] [PubMed] [Google Scholar]
- Madisen L, Mao T, Koch H, Zhuo JM, Berenyi A, Fujisawa S, Hsu YW, Garcia AJ, 3rd, Gu X, Zanella S, et al. A toolbox of Cre-dependent optogenetic transgenic mice for light-induced activation and silencing. Nat Neurosci. 2012;15:793–802. doi: 10.1038/nn.3078. [DOI] [PMC free article] [PubMed] [Google Scholar]
- Madisen L, Zwingman TA, Sunkin SM, Oh SW, Zariwala HA, Gu H, Ng LL, Palmiter RD, Hawrylycz MJ, Jones AR, et al. A robust and high-throughput Cre reporting and characterization system for the whole mouse brain. Nat Neurosci. 2010;13:133–140. doi: 10.1038/nn.2467. [DOI] [PMC free article] [PubMed] [Google Scholar]
- Magnus CJ, Lee PH, Atasoy D, Su HH, Looger LL, Sternson SM. Chemical and genetic engineering of selective ion channel-ligand interactions. Science. 2011;333:1292–1296. doi: 10.1126/science.1206606. [DOI] [PMC free article] [PubMed] [Google Scholar]
- Matsuoka RL, Chivatakarn O, Badea TC, Samuels IS, Cahill H, Katayama K, Kumar SR, Suto F, Chedotal A, Peachey NS, et al. Class 5 transmembrane semaphorins control selective Mammalian retinal lamination and function. Neuron. 2011a;71:460–473. doi: 10.1016/j.neuron.2011.06.009. [DOI] [PMC free article] [PubMed] [Google Scholar]
- Matsuoka RL, Nguyen-Ba-Charvet KT, Parray A, Badea TC, Chedotal A, Kolodkin AL. Transmembrane semaphorin signalling controls laminar stratification in the mammalian retina. Nature. 2011b;470:259–263. doi: 10.1038/nature09675. [DOI] [PMC free article] [PubMed] [Google Scholar]
- Morgan JL, Dhingra A, Vardi N, Wong RO. Axons and dendrites originate from neuroepithelial-like processes of retinal bipolar cells. Nature neuroscience. 2006;9:85–92. doi: 10.1038/nn1615. [DOI] [PubMed] [Google Scholar]
- Morgan JL, Lichtman JW. Why not connectomics? Nature methods. 2013;10:494–500. doi: 10.1038/nmeth.2480. [DOI] [PMC free article] [PubMed] [Google Scholar]
- Morgan JL, Schubert T, Wong RO. Developmental patterning of glutamatergic synapses onto retinal ganglion cells. Neural development. 2008;3:8. doi: 10.1186/1749-8104-3-8. [DOI] [PMC free article] [PubMed] [Google Scholar]
- Morgan JL, Soto F, Wong RO, Kerschensteiner D. Development of cell type-specific connectivity patterns of converging excitatory axons in the retina. Neuron. 2011;71:1014–1021. doi: 10.1016/j.neuron.2011.08.025. [DOI] [PMC free article] [PubMed] [Google Scholar]
- Murphy GJ, Rieke F. Network variability limits stimulus-evoked spike timing precision in retinal ganglion cells. Neuron. 2006;52:511–524. doi: 10.1016/j.neuron.2006.09.014. [DOI] [PMC free article] [PubMed] [Google Scholar]
- Okawa H, Della Santina L, Schwartz GW, Rieke F, Wong RO. Interplay of cell-autonomous and nonautonomous mechanisms tailors synaptic connectivity of converging axons in vivo. Neuron. 2014a;82:125–137. doi: 10.1016/j.neuron.2014.02.016. [DOI] [PMC free article] [PubMed] [Google Scholar]
- Okawa H, Hoon M, Yoshimatsu T, Della Santina L, Wong RO. Illuminating the multifaceted roles of neurotransmission in shaping neuronal circuitry. Neuron. 2014b;83:1303–1318. doi: 10.1016/j.neuron.2014.08.029. [DOI] [PMC free article] [PubMed] [Google Scholar]
- Pozo K, Goda Y. Unraveling mechanisms of homeostatic synaptic plasticity. Neuron. 2010;66:337–351. doi: 10.1016/j.neuron.2010.04.028. [DOI] [PMC free article] [PubMed] [Google Scholar]
- Purves D, Lichtman JW. Elimination of synapses in the developing nervous system. Science (New York, NY) 1980;210:153–157. doi: 10.1126/science.7414326. [DOI] [PubMed] [Google Scholar]
- Ramocki MB, Zoghbi HY. Failure of neuronal homeostasis results in common neuropsychiatric phenotypes. Nature. 2008;455:912–918. doi: 10.1038/nature07457. [DOI] [PMC free article] [PubMed] [Google Scholar]
- Riccomagno MM, Kolodkin AL. Sculpting neural circuits by axon and dendrite pruning. Annu Rev Cell Dev Biol. 2015;31:779–805. doi: 10.1146/annurev-cellbio-100913-013038. [DOI] [PMC free article] [PubMed] [Google Scholar]
- Sanes JR, Yamagata M. Many paths to synaptic specificity. Annu Rev Cell Dev Biol. 2009;25:161–195. doi: 10.1146/annurev.cellbio.24.110707.175402. [DOI] [PubMed] [Google Scholar]
- Schindelin J, Arganda-Carreras I, Frise E, Kaynig V, Longair M, Pietzsch T, Preibisch S, Rueden C, Saalfeld S, Schmid B, et al. Fiji: an open-source platform for biological-image analysis. Nature methods. 2012;9:676–682. doi: 10.1038/nmeth.2019. [DOI] [PMC free article] [PubMed] [Google Scholar]
- Schmitz F, Konigstorfer A, Sudhof TC. RIBEYE, a component of synaptic ribbons: a protein’s journey through evolution provides insight into synaptic ribbon function. Neuron. 2000;28:857–872. doi: 10.1016/s0896-6273(00)00159-8. [DOI] [PubMed] [Google Scholar]
- Schwartz GW, Okawa H, Dunn FA, Morgan JL, Kerschensteiner D, Wong RO, Rieke F. The spatial structure of a nonlinear receptive field. Nature neuroscience. 2012;15:1572–1580. doi: 10.1038/nn.3225. [DOI] [PMC free article] [PubMed] [Google Scholar]
- Shekhar K, Lapan SW, Whitney IE, Tran NM, Macosko EZ, Kowalczyk M, Adiconis X, Levin JZ, Nemesh J, Goldman M, et al. Comprehensive Classification of Retinal Bipolar Neurons by Single-Cell Transcriptomics. Cell. 2016;166:1308–1323. e1330. doi: 10.1016/j.cell.2016.07.054. [DOI] [PMC free article] [PubMed] [Google Scholar]
- Soto F, Ma X, Cecil JL, Vo BQ, Culican SM, Kerschensteiner D. Spontaneous activity promotes synapse formation in a cell-type-dependent manner in the developing retina. J Neurosci. 2012;32:5426–5439. doi: 10.1523/JNEUROSCI.0194-12.2012. [DOI] [PMC free article] [PubMed] [Google Scholar]
- Taniguchi H, He M, Wu P, Kim S, Paik R, Sugino K, Kvitsiani D, Fu Y, Lu J, Lin Y, et al. A resource of Cre driver lines for genetic targeting of GABAergic neurons in cerebral cortex. Neuron. 2011;71:995–1013. doi: 10.1016/j.neuron.2011.07.026. [DOI] [PMC free article] [PubMed] [Google Scholar]
- Tien NW, Kim T, Kerschensteiner D. Target-Specific Glycinergic Transmission from VGluT3-Expressing Amacrine Cells Shapes Suppressive Contrast Responses in the Retina. Cell reports. 2016;15:1369–1375. doi: 10.1016/j.celrep.2016.04.025. [DOI] [PMC free article] [PubMed] [Google Scholar]
- Tien NW, Pearson JT, Heller CR, Demas J, Kerschensteiner D. Genetically Identified Suppressed-by-Contrast Retinal Ganglion Cells Reliably Signal Self-Generated Visual Stimuli. The Journal of neuroscience : the official journal of the Society for Neuroscience. 2015;35:10815–10820. doi: 10.1523/JNEUROSCI.1521-15.2015. [DOI] [PMC free article] [PubMed] [Google Scholar]
- Turrigiano GG. The self-tuning neuron: synaptic scaling of excitatory synapses. Cell. 2008;135:422–435. doi: 10.1016/j.cell.2008.10.008. [DOI] [PMC free article] [PubMed] [Google Scholar]
- Turrigiano GG, Nelson SB. Homeostatic plasticity in the developing nervous system. Nat Rev Neurosci. 2004;5:97–107. doi: 10.1038/nrn1327. [DOI] [PubMed] [Google Scholar]
- Ueda Y, Iwakabe H, Masu M, Suzuki M, Nakanishi S. The mGluR6 5′ upstream transgene sequence directs a cell-specific and developmentally regulated expression in retinal rod and ON-type cone bipolar cells. J Neurosci. 1997;17:3014–3023. doi: 10.1523/JNEUROSCI.17-09-03014.1997. [DOI] [PMC free article] [PubMed] [Google Scholar]
- Wang YV, Weick M, Demb JB. Spectral and temporal sensitivity of cone-mediated responses in mouse retinal ganglion cells. J Neurosci. 2011;31:7670–7681. doi: 10.1523/JNEUROSCI.0629-11.2011. [DOI] [PMC free article] [PubMed] [Google Scholar]
- Wassle H, Puller C, Muller F, Haverkamp S. Cone contacts, mosaics, and territories of bipolar cells in the mouse retina. J Neurosci. 2009;29:106–117. doi: 10.1523/JNEUROSCI.4442-08.2009. [DOI] [PMC free article] [PubMed] [Google Scholar]
- Wefelmeyer W, Puhl CJ, Burrone J. Homeostatic Plasticity of Subcellular Neuronal Structures: From Inputs to Outputs. Trends in neurosciences. 2016;39:656–667. doi: 10.1016/j.tins.2016.08.004. [DOI] [PMC free article] [PubMed] [Google Scholar]
- Williams ME, de Wit J, Ghosh A. Molecular mechanisms of synaptic specificity in developing neural circuits. Neuron. 2010;68:9–18. doi: 10.1016/j.neuron.2010.09.007. [DOI] [PMC free article] [PubMed] [Google Scholar]
- Yamagata M, Sanes JR. Dscam and Sidekick proteins direct lamina-specific synaptic connections in vertebrate retina. Nature. 2008;451:465–469. doi: 10.1038/nature06469. [DOI] [PubMed] [Google Scholar]
- Yamagata M, Sanes JR. Expanding the Ig superfamily code for laminar specificity in retina: expression and role of contactins. J Neurosci. 2012;32:14402–14414. doi: 10.1523/JNEUROSCI.3193-12.2012. [DOI] [PMC free article] [PubMed] [Google Scholar]
- Yogev S, Shen K. Cellular and molecular mechanisms of synaptic specificity. Annu Rev Cell Dev Biol. 2014;30:417–437. doi: 10.1146/annurev-cellbio-100913-012953. [DOI] [PubMed] [Google Scholar]
- Yu CR, Power J, Barnea G, O’Donnell S, Brown HE, Osborne J, Axel R, Gogos JA. Spontaneous neural activity is required for the establishment and maintenance of the olfactory sensory map. Neuron. 2004;42:553–566. doi: 10.1016/s0896-6273(04)00224-7. [DOI] [PubMed] [Google Scholar]
- Zaghloul KA, Boahen K, Demb JB. Different circuits for ON and OFF retinal ganglion cells cause different contrast sensitivities. J Neurosci. 2003;23:2645–2654. doi: 10.1523/JNEUROSCI.23-07-02645.2003. [DOI] [PMC free article] [PubMed] [Google Scholar]
- Zhu Y, Xu J, Hauswirth WW, DeVries SH. Genetically targeted binary labeling of retinal neurons. The Journal of neuroscience : the official journal of the Society for Neuroscience. 2014;34:7845–7861. doi: 10.1523/JNEUROSCI.2960-13.2014. [DOI] [PMC free article] [PubMed] [Google Scholar]
Associated Data
This section collects any data citations, data availability statements, or supplementary materials included in this article.