Abstract
Purpose
Proton magnetic resonance spectroscopy (MRS) of the brain can detect 2-hydroxyglutarate (2HG), the oncometabolite produced in neoplasms harboring a mutation in the gene coding for isocitrate dehydrogenase (IDH). We conducted a prospective longitudinal imaging study to determine whether quantitative assessment of 2HG by MRS could serve as a noninvasive clinical imaging biomarker for IDH-mutated gliomas.
Patients and Methods
2HG MRS was performed in 136 patients using point-resolved spectroscopy at 3 T in parallel with standard clinical magnetic resonance imaging and assessment. Data were analyzed in patient cohorts representing the major phases of the glioma clinical course and were further subgrouped by histology and treatment type to evaluate 2HG. Histologic correlations were performed.
Results
Quantitative 2HG MRS was technically and biologically reproducible. 2HG concentration > 1 mM could be reliably detected with high confidence. During the period of indolent disease, 2HG concentration varied by less than ± 1 mM, and it increased sharply with tumor progression. 2HG concentration was positively correlated with tumor cellularity and significantly differed between high- and lower-grade gliomas. In response to cytotoxic therapy, 2HG concentration decreased rapidly in 1p/19q codeleted oligodendrogliomas and with a slower time course in astrocytomas and mixed gliomas. The magnitude and time course of the decrease in 2HG concentration and magnitude of the decrease in tumor volume did not differ between oligodendrogliomas treated with temozolomide or carmustine. Criteria for 2HG MRS were established to make a presumptive molecular diagnosis of an IDH mutation in gliomas technically unable to undergo a surgical procedure.
Conclusion
2HG concentration as measured by MRS was reproducible and reliably reflected the disease state. These data provide a basis for incorporating 2HG MRS into clinical management of IDH-mutated gliomas.
INTRODUCTION
The breakthrough discovery of mutations in isocitrate dehydrogenases (IDHs) 1 and 21,2 in the earliest grade gliomas and the subsequent identification of the oncometabolite 2-hydroxyglutarate (2HG) as a direct consequence of these mutations3 have provided new insights into gliomagenesis and opened up new opportunities for treatment. Moreover, recent large-scale molecular studies of adult lower-grade gliomas (WHO grade 2 and 3 astrocytomas, oligodendrogliomas, and mixed gliomas) have clearly defined the IDH mutation as centrally important in determining prognosis.4-6 Patients with IDH-mutated oligodendrogliomas that harbor loss of chromosomal arms 1p and 19q (1p/19q codeleted) have significantly prolonged survival when compared with those without the codeletion.4 These findings prompted a recent molecular reclassification of gliomas,6a which is likely to lead to a more accurate classification of individual tumors and is expected to play a role in treatment decision making and the future design of clinical trials in glioma.
Accumulation of high concentrations of 2HG in IDH-mutated cells has opened up an opportunity for development of 2HG as a clinical biomarker. It is now well established that 2HG can be detected by magnetic resonance (MR) spectroscopy (MRS).7-12 However, longitudinal studies that follow the natural history of lower-grade gliomas with 2HG MRS, which are necessary to determine its clinical use as a potential biomarker, are lacking. We therefore undertook a prospective longitudinal observational study of 2HG MRS using our previously published method in patients who were undergoing routine care in an academic medical center. Studying patient cohorts at clinically defined disease time points, we sought to determine whether quantitation of 2HG by MRS could reproducibly and reliably report clinical status.
PATIENTS AND METHODS
Over a 2.5-year period, 136 sequential patients from the neuro-oncology clinical program at University of Texas Southwestern Medical Center who had tissue diagnosis of an IDH mutation or had a brain mass that was radiographically consistent with a grade 2 or 3 glioma were recruited for an institutional review board–approved research imaging study. There was no restriction on the timing of study entry relative to clinical course, which thereby naturally generated cohorts of patients who could be studied at specific time points in the disease course. Data analysis was conducted within each cohort, defined as: cohort 1, time of diagnosis; cohort 2, period of indolent disease; cohort 3, time of tumor progression; cohort 4, during a treatment course; and cohort 5, post-treatment follow-up period. Research scans were performed within 1 week of the clinical scans. Histologic analysis included review of hematoxylin and eosin staining, proliferation index (MIB-1), IDH1 (R132H) immunohistochemistry (IHC), IDH1 and IDH2 gene sequencing in IDH1 IHC–negative tumors, and assessment of tumor cellularity. Assessments of clinical status and treatment response were performed according to Response Assessment in Neuro-Oncology (RANO) criteria for low-grade gliomas.13 Demographic characteristics, clinical details, and 2HG concentration are listed for each cohort in Appendix Tables A1-A5 (online only). All clinical decision making occurred independently of the research imaging study.
MR Data Acquisition
Proton MRS for 2HG was performed on a dedicated research Philips 3T scanner (Best, the Netherlands). T2-weighted fluid-attenuated inversion recovery (T2/FLAIR) images were acquired for tumor identification. For single-voxel localized MRS, water-suppressed proton spectra were obtained from one to two voxels within the tumor, using our previously reported 2HG-optimized point-resolved spectroscopy (PRESS) method, where echo time (TE) equals 97 ms.8,10 The voxel size was 2 to 8 mL (scan time, 4 to 34 minutes, with longer scan time for smaller voxels). A short-TE unsuppressed water signal was acquired from each voxel for use as reference in metabolite quantitation. For multivoxel MRS imaging (MRSI), localization was achieved with phase-encoding gradients implemented within the PRESS sequence. A PRESS-prescribed transverse slice was positioned to cover the region of interest, with spatial resolution of 10 × 10 mm2 (slice thickness, 15 mm). In each MRSI scan, a 20 × 16 data matrix was obtained from a 200 × 160 mm2 field of view.
MR Data Analysis
MRS spectra were analyzed with LCModel software (s-provencher.com/pages/lcmodel.shtml)14 using a basis set of 21 metabolites, including 2HG. The basis spectra were numerically calculated, incorporating the PRESS radiofrequency and gradient pulses, as previously described.8 Metabolite concentrations were estimated with reference to water at 43 M, as previously described.8 For multivoxel imaging data, the k-space data were zero filled before Fourier transformation to obtain in-plane resolution of 5 × 5 mm2. Tumor-volume segmentation was conducted on T2/FLAIR images using a published algorithm.15 A fast bounding box algorithm was used to define a bounding box within the tumor area, and the central region of the box was selected for the one-class super vector machine classifier training. Tumor pixels were extracted by radius basis learning kernel.
Statistical Analysis
A Cramer–Rao lower bound of the 2HG estimate was obtained from the LCModel fitting. Technical reproducibility was assessed by test–retest analysis, in which a series of patients underwent an initial scan, got out of the scanner for 5 minutes, and were then repositioned and rescanned using a voxel placed in the same location. Scatter plot and correlation coefficient between test and retest measurements are presented. Biologic reproducibility was assessed in patients with stable tumor size, where the 2HG single voxel was placed in the same location in serial scans 2 to 4 months apart, coinciding with the clinical scan. A linear mixed model was used to assess whether the slope was significantly different from zero for stable tumors. We compared continuous variables among subgroups using a two-sample t test. The Mann-Whitney U test was used when the normality assumption did not hold. Nonlinear mixed-effect models were constructed for longitudinal 2HG data to evaluate the statistical significance of the difference in the 2HG-concentration change rate among groups. All statistical analyses were conducted using SAS software (SAS Institute, Cary, NC). Statistical significance was declared for P values of .05 or less. Additional details are provided in the Appendix (online only).
RESULTS
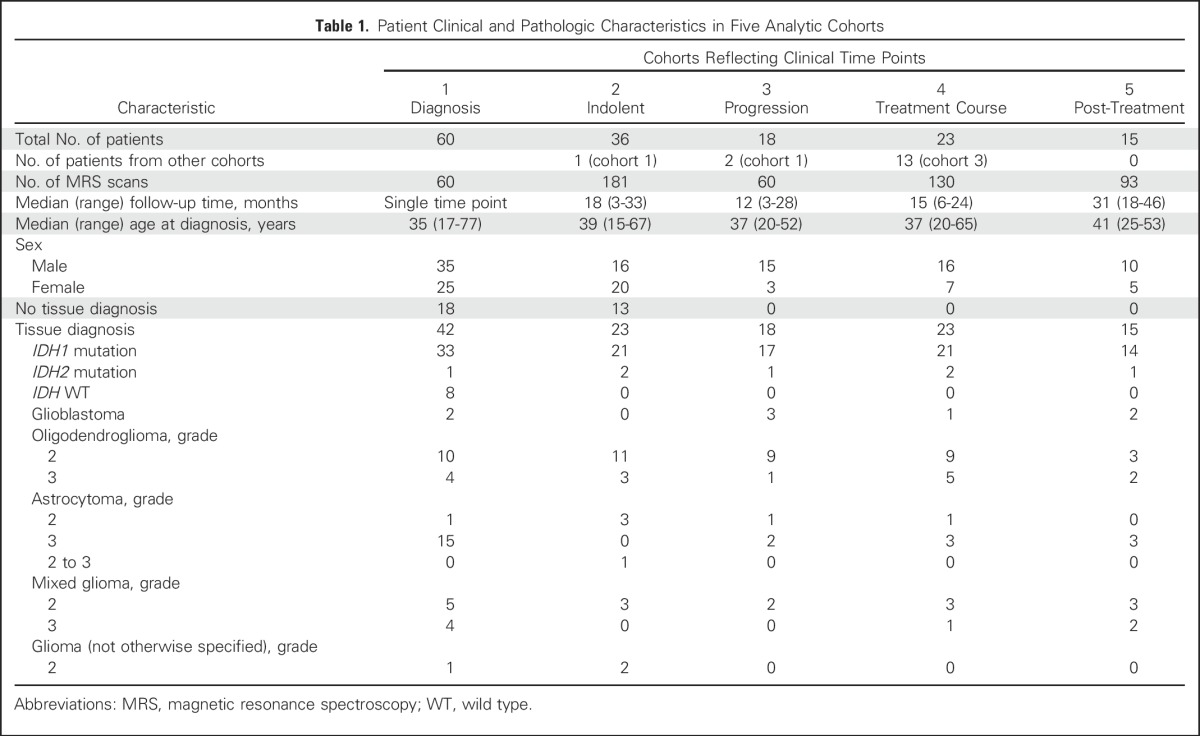
A total of 136 patients (80 male and 56 female patients; median age at diagnosis, 38 years; range, 15 to 77 years) were enrolled and underwent 511 individual research scans. Seventy-six patients underwent serial imaging, with a median of five scans per patient and median follow-up time of 19 months (range, 3 to 46 months) in four analytic cohorts (cohorts 2 to 5; Table 1).
Table 1.
Patient Clinical and Pathologic Characteristics in Five Analytic Cohorts
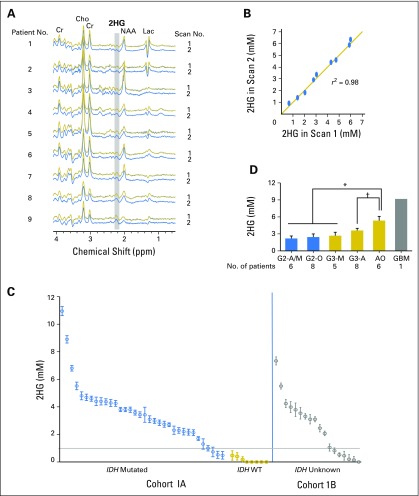
Technical reliability of 2HG quantitation by MRS was assessed by test–retest analysis in nine patients (Fig 1A). The MRS spectra in each tumor showed the stereotypic tumor pattern of elevated choline relative to creatine and low N-acetyl aspartate and a 2HG peak of variable height at 2.25 ppm. The spectral pattern was similar between each pair of scans. The 2HG concentration difference between scans one and two ranged between −0.3 and +0.3 mM, with a test–retest correlation of 0.98 (Fig 1B). These data establish high reliability of 2HG quantitation by MRS over the tested range (1 to 7 mM).
Fig 1.
Baseline characteristics of 2-hydroxyglutarate (2HG) as measured by magnetic resonance spectroscopy in patients with untreated tumors. (A) Test–retest analysis in nine patients, arranged in ascending order of 2HG concentration. In vivo spectra are shown for the first (scan 1) and second scans (scan 2). (B) Linear regression curve of 2HG concentration in scan 1 v 2. (C) 2HG concentration (± standard deviation [SD]) from 60 individual tumors in two patient groups; cohort 1A: those with a tissue diagnosis (n = 42), and cohort 1B: those without a tissue diagnosis (n = 18), shown from high to low 2HG concentration. The SD of each 2HG concentration estimate was obtained from the Cramer–Rao lower bound value in the spectral fitting. (D) Comparison of 2HG concentration among tumors grouped by grade and histologic diagnosis. A, astrocytoma; AO, anaplastic oligodendroglioma (includes patients with progressive grade 2 oligodendroglioma who had new enhancement and increased tumor size on T2/FLAIR sequence); Cho, choline; Cr, creatine; G, grade; GBM, glioblastoma; Lac, lactate; M, mixed glioma; NAA, N-acetyl aspartate; O, oligodendroglioma; T2/FLAIR, T2-weighted fluid-attenuated inversion recovery; WT, wild type. (*) P < .001. (†) P = .02.
Cohort 1 (Table 1) consisted of 60 untreated patients who underwent a single research scan at the time of initial diagnosis (72%) or after having been observed with stable serial imaging after an initial biopsy (28%; Fig 1C). Forty-two patients (cohort 1A) underwent a surgical procedure that established the histologic diagnosis and IDH status. Eighteen patients (cohort 1B) did not undergo a surgical procedure because of the perceived high risk of neurologic injury but had a presumptive radiologic diagnosis of glioma based on standard MR imaging and clinical presentation. The individual 2HG concentrations are shown from high to low for the two groups. For cohort 1A (Fig 1C, left), the 2HG concentration (± standard deviation [SD]) in all (eight of eight) IDH wild-type tumors was less than 1 mM, whereas 12% (four of 34) of the IDH-mutated tumors were in this range (sensitivity, 100%; specificity, 88% by receiver operating characteristic analysis). We therefore set 1 mM as the minimum threshold for clinical confidence in making a molecular diagnosis of an IDH mutation on the basis of 2HG MRS.
We next examined the 2HG concentrations in cohort 1B (Fig 1C, right) with the goal of determining whether a molecular diagnosis of an IDH mutation could be made by 2HG MRS alone. Patient demographics and radiographic features of the tumors in this group were comparable to those in cohort 1A, and each patient had a presumptive clinical diagnosis of glioma. The proportion of 2HG concentration measurements less than 1 mM was 29%, similar to that in cohort 1A (33%). The Mann-Whitney U test was performed to evaluate whether the 2HG concentrations in the two cohorts followed the same distribution. The median 2HG concentration of cohort 1B was 2.8 mM (interquartile range, 0.5 to 3.8 mM), not statistically different from that of cohort 1A (median 2HG concentration, 2.8 mM; interquartile range, 0.7 to 4.3 mM; P = .64). Thus, using a 2HG concentration of greater than 1 mM as the threshold for clinical confidence, a presumptive molecular diagnosis of an IDH mutation could be made in 12 (67%) of the 18 patients who were unable to undergo a surgical procedure to establish IDH status.
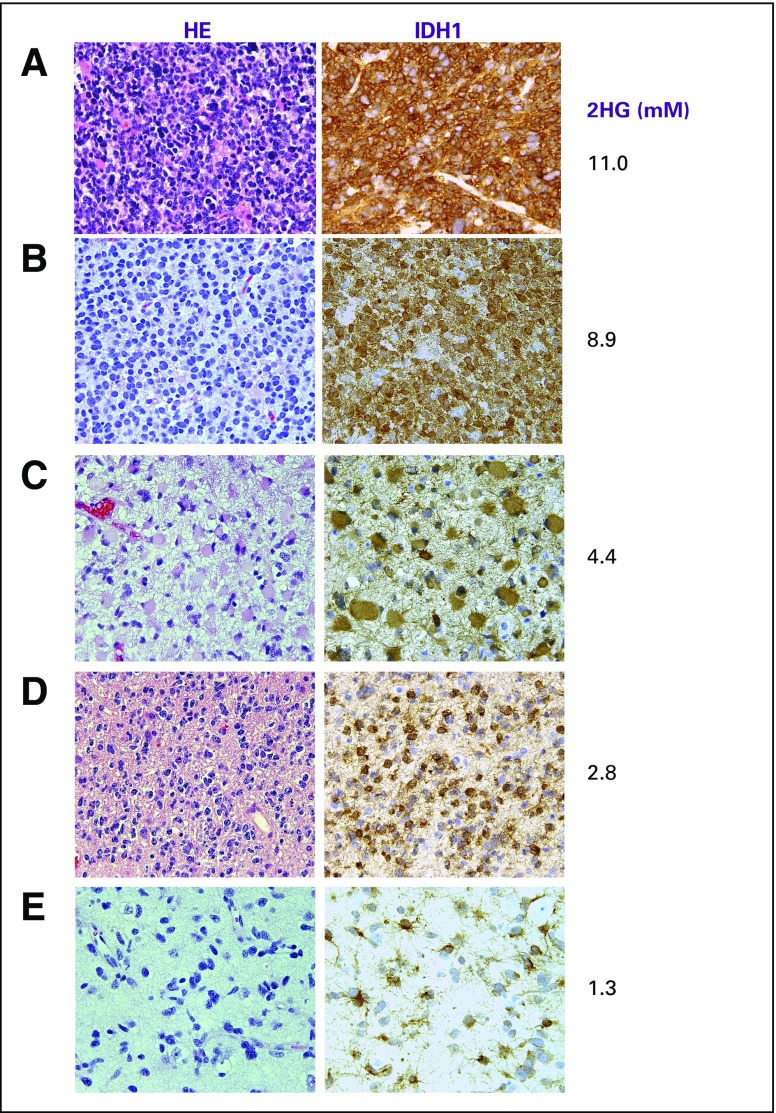
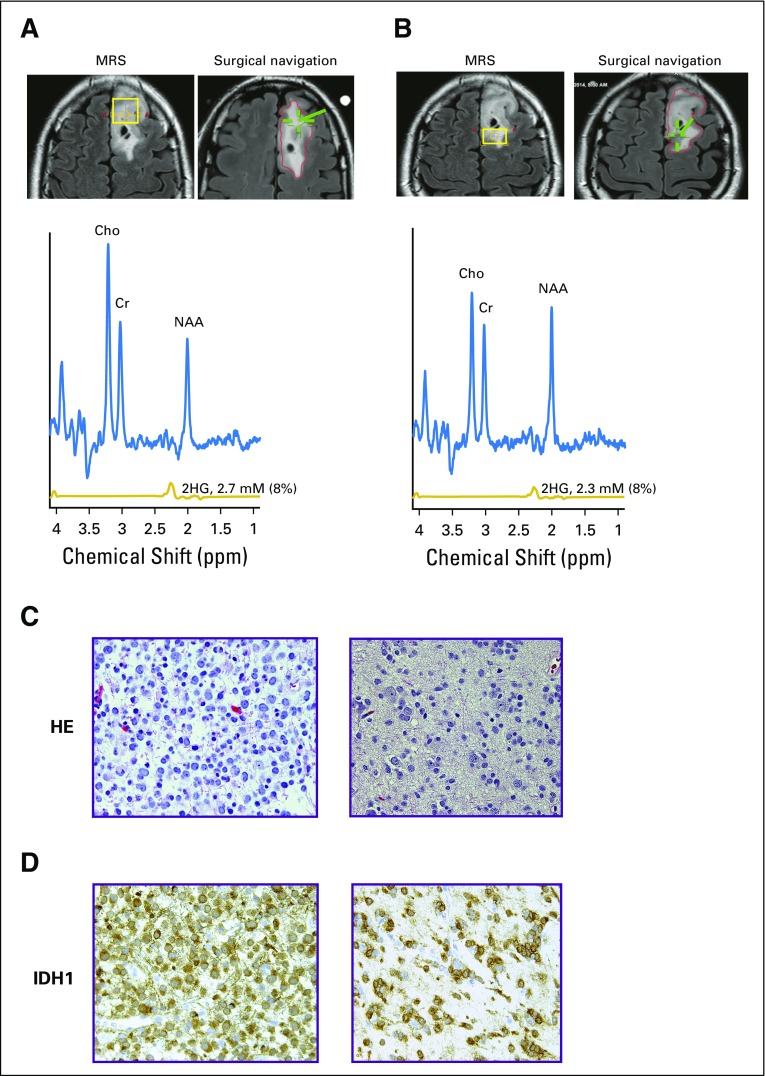
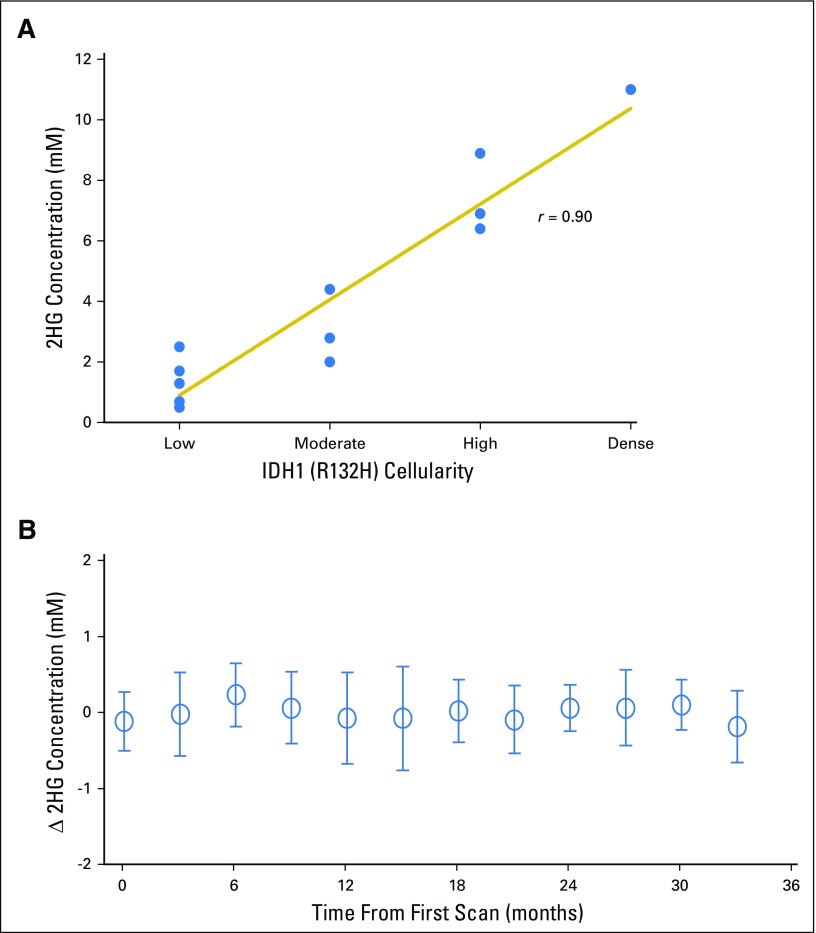
We next examined the relationship between 2HG concentration and histologic subtype and tumor grade in patients with IDH-mutated tumors in cohort 1A. Differences in 2HG concentration were detectable based on tumor grade (Fig 1D) but not histologic subtype (data not shown). The highest 2HG concentrations were found in the highest-grade tumors: grade 3 (anaplastic) oligodendrogliomas (AOs; n = 6) and secondary glioblastoma (n = 1), which are characterized by high to dense tumor cellularity (Appendix Figs A1A and A1B, online only). The lower-grade tumors had significantly lower 2HG concentrations (AOs v grade 3 astrocytomas, P = .02; AOs v the remaining lower-grade gliomas, P < .001), consistent with tumor cellularity that ranges from low to moderate in these tumors (Appendix Figs A1C to A1E). The three IDH-mutated tumors with 2HG concentrations of less than 1 mM from cohort 1A had the lowest cellularity of the lower-grade tumors (data not shown). This correlation was further supported at the cellular level by IHC data from a case in which two geographically distinct regions of the tumor were sampled using intraoperative surgical navigation that enabled matching to two MRS voxels obtained preoperatively (Appendix Fig A2, online only). There was a strong correlation between 2HG concentration and tumor cellularity (Spearman rank correlation r = 0.90; Appendix Fig A3A, online only).
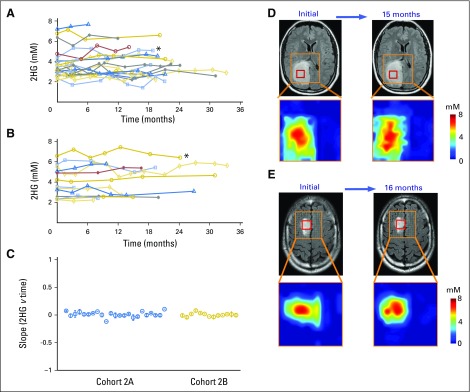
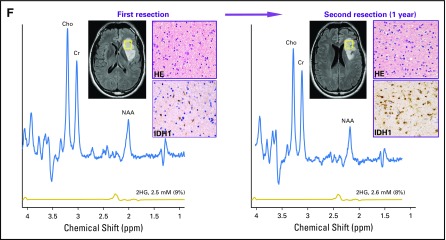
Having established baseline parameters for 2HG MRS, we next analyzed data for the 76 patients who underwent serial imaging in the four remaining patient cohorts. In cohort 2, 36 untreated patients with nonenhancing indolent disease underwent imaging for a median of 18 months (range, 3 to 33 months; Fig 2). Twenty-three patients had tissue diagnosis of an IDH mutation (cohort 2A; Fig 2A), whereas 13 patients were observed without tissue diagnosis but met the criteria for molecular diagnosis of an IDH mutation (cohort 2B; Fig 2B). There was no difference in initial 2HG concentration between the two cohorts (cohort 2A: median, 3.5 mM; interquartile range, 3.0 to 4.1 mM v cohort 2B: median, 3.5 mM; interquartile range, 2.6 to 5.1 mM; Mann-Whitney U test P = .8). The 2HG concentration variation between scans was less than ± 1 mM when assessed at 3-month intervals for the whole cohort (Appendix Fig A3B). The slope of 2HG concentration versus time was not significantly different from zero, when evaluated either for individual patients based on linear regression or for all patients jointly based on a linear mixed-effect model (Fig 2C). Consistent with these data, 2HG concentration color maps from MRSI analysis that show regional variation in two representative cases at two time points demonstrate stable 2HG concentration color pattern and overall stable dimensions of T2/FLAIR signal abnormality (Figs 2D and 2E). Histologic analysis of tumor cellularity and MIB-1 in the setting of stable T2/FLAIR and 2HG concentration for a patient who required repeat surgery for seizure management 1 year after the first surgery showed no change in tumor grade, cellularity, or MIB-1 (Fig 2F). Taken together, these data demonstrate the biologic reproducibility as well as the clinical reliability of 2HG MRS in the setting of indolent disease.
Fig 2.
Stable 2-hydroxyglutarate (2HG) concentration in patients with nonenhancing indolent disease. (A, B) Single voxel MRS scans were analyzed serially in individual patients in the (A) IDH-mutated group (cohort 2A; n = 23) and (B) no tissue diagnosis group (cohort 2B; n = 13). Each curve represents one patient, and each data point was obtained from a separate magnetic resonance (MR) scan with spectroscopy (MRS) and 2HG concentration determination. Month 0 was the first scan at study enrollment. (C) Slope (± standard deviation) of 2HG concentration versus month for each patient curve from (A) and (B). (D, E) Multivoxel imaging spectra were obtained from patients denoted by (*) at two separate time points in (A) and (B). Interval between scans was 15 and 16 months, respectively. T2/FLAIR images are overlaid with the multivoxel grid (5 × 5 mm2, with 15-mm slice thickness). Red square shows the location of the single voxel used to generate the data for the patients in (A) and (B). The 2HG concentration color maps are shown for each grid (range, 0 to 8 mM). (F) Comparison of preoperative MRS (voxel size, 20 × 20 × 20 mm3), 2HG concentration, postoperative hematoxylin and eosin (HE), and isocitrate dehydrogenase 1 (IDH1)/R132H immunoreactivity at two time points for a patient with grade 2 astrocytoma. Numbers in parentheses indicate the Cramer–Rao lower bounds of the 2HG measurement. Changes in any of the parameters were negligible 1 year after initial evaluation. Histologic images are ×200 magnification. Cho, choline; Cr, creatine; NAA, N-acetyl aspartate; T2/FLAIR, T2-weighted fluid-attenuated inversion recovery.
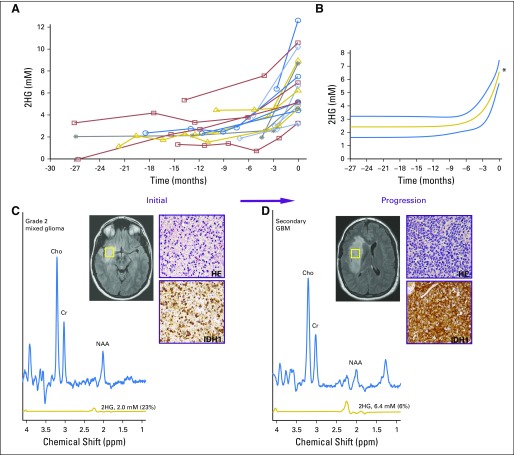
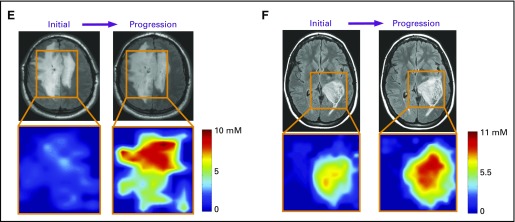
To determine whether 2HG MRS can accurately assess tumor progression, we analyzed 18 patients (cohort 3) who had undergone serial imaging for a median of 12 months (range, 3 to 28 months) before RANO-confirmed clinical and/or radiographic progression (Fig 3A). Curve fitting of the time course of change in 2HG concentration demonstrated a marked increase that occurred over a period of 2 to 6 months, culminating in confirmed progression (Fig 3B). Representative patient cases are shown in Figs 3C to 3F. Transformation to glioblastoma from grade 2 mixed glioma, associated with significantly increased tumor volume and a more than three-fold increase in 2HG concentration, was associated histologically with a marked increase in tumor cellularity and MIB-1 (Figs 3C and 3D). The 2HG concentration color maps from MRSI analysis show the regional changes at the time of progression for two patients; the first patient had had stable disease for 3 years without treatment (Fig 3E), whereas the second patient had tumor progression while receiving treatment with temozolomide (Fig 3F). In both cases, 2HG concentration was increased throughout the tumor, most strikingly in the large bihemispheric mass that had a 20% increase in overall tumor volume (Fig 3E) and developed a small region of gadolinium enhancement in the right frontal lobe (image not shown).
Fig 3.
Tumor progression is associated with an increase in 2-hydroxyglutarate (2HG) concentration. (A) Eighteen patients had at least one baseline scan with 2HG concentration measurement before Response Assessment in Neuro-Oncology–confirmed tumor progression, at the 0-months time point. Data prior to progression (0-months time point) are represented by negative months. Each curve represents one patient, and each data point was obtained from a separate magnetic resonance (MR) scan with spectroscopy (MRS) and 2HG concentration determination. (B) Curve fitting with an exponential function. The fit (2.42 + 4.17e−0.41 month) is shown together with 95% CIs (blue lines). The coefficient of determination (r2) was 0.49. The mean 2HG concentration at progression (6.59 mM) was significantly greater than the mean baseline 2HG concentration (2.42 mM). (C) A representative patient from (A) with grade 2 mixed glioma is shown at the time of initial scanning after biopsy (MRS voxel size, 20 × 20 × 20 mm2). Hematoxylin and eosin (HE) staining shows moderate cellularity, and isocitrate dehydrogenase 1 (IDH1)/R132H shows strong immunoreactivity. (D) Same patient in (C) at time of progression (preoperative MRS voxel size, 20 × 20 × 20 mm3; 2HG concentration, 6.4 mM). Diagnosis at second surgery was glioblastoma. HE staining shows high cellularity, with strong IDH1/R132H immunoreactivity. Numbers in parentheses indicate the 2HG Cramer–Rao lower bounds of the 2HG measurements. (E, F) Multivoxel imaging of two patients from (A) at two time points: initial scan and progression (time 0). Outline of grid overlays T2/FLAIR images, and 2HG concentration color map is shown for each time point. (E) Untreated grade 2 oligodendroglioma (1p/19q codeleted, IDH2 R172K mutated), which progressed during surveillance. Minimal gadolinium enhancement in the right frontal lobe on clinical MR imaging (MRI; not shown). Time between initial and progression scan was 5 months. 2HG concentration color map range is 0 to 10 mM. (F) Recurrent grade 3 astrocytoma (IDH1 R132H mutated), which progressed during temozolomide treatment. Time between initial and progression scans was 4 months. 2HG concentration color map range is 0 to 11 mM. Clinical scan showed a 5-mm focus of gadolinium enhancement on clinical MRI at progression (not shown). Histologic images are ×200 magnification. Cho, choline; Cr, creatine; NAA, N-acetyl aspartate; T2/FLAIR, T2-weighted fluid-attenuated inversion recovery. (*) P < .001. (Continued)
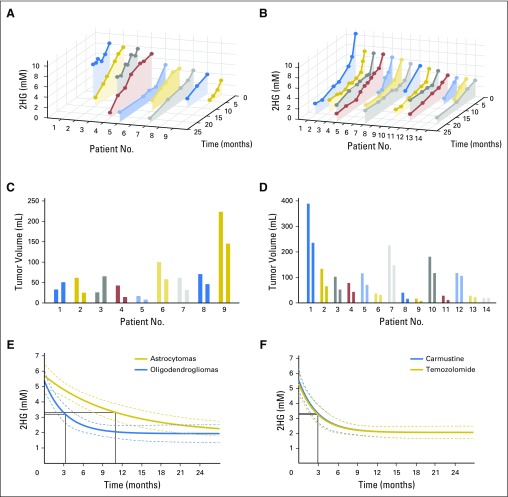
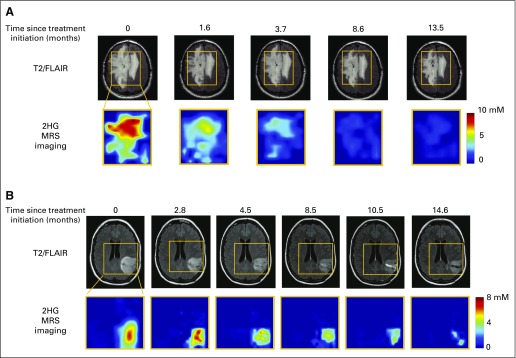
Next, we sought to evaluate the impact of treatment on 2HG concentration in parallel with clinical assessment by RANO. We conducted serial imaging in 23 patients (cohort 4) who were treated at initial presentation (n = 7) or at the time of progression (n = 16, including 13 patients from cohort 3). Because of the inherent differences in sensitivity to chemotherapy and radiotherapy between oligodendrogliomas (1p/19q) and astrocytomas or mixed gliomas,16,17 we divided the cohort into these two histologic subgroups for analysis (14 and nine patients, respectively; Fig 4). Serial data are shown for each patient, starting with a baseline measurement of 2HG concentration within the period of 1 to 2 weeks before starting treatment and continuing for a median of 15 months (range, 6 to 24 months; Figs 4A and 4B). Corresponding tumor volume is shown at two time points: baseline pretreatment and at the time of the last 2HG MRS measurement for each patient (Figs 4C and 4D). In each case, there was a decrease in 2HG concentration during treatment that was accompanied by a measureable decrease in tumor volume (in milliliters) in 13 of 14 oligodendrogliomas and six of eight astrocytomas or mixed gliomas. A nonlinear mixed-effect model based on the two groups identified a marked difference in the time courses of the 2HG concentration decrease, with a significantly more rapid decrease occurring in the oligodendrogliomas compared with the astrocytomas or mixed gliomas (P = .01; Fig 4E). Examination of 2HG concentration color maps generated from MRSI analysis demonstrates the decrease in 2HG concentration throughout the tumors over time, albeit more rapidly in the oligodendrogliomas (Appendix Fig A4, online only).
Fig 4.
Decrease in 2-hydroxyglutarate (2HG) concentration in response to treatment. Twenty-three patients were observed during treatment for a median of 15 months (range, 6 to 24 months), with a median of five scans (range, two to 10 scans) per patient. (A, B) Data are presented for each patient over time in two groups: (A) astrocytomas and mixed gliomas and (B) oligodendrogliomas. The first point of each curve is the immediate pretreatment 2HG concentration. Patients are arranged from highest pretreatment 2HG concentration to lowest. Each point on the curve is the 2HG concentration (mM; y-axis) at a specific time point (months; z-axis). (C, D) Corresponding tumor volume (mL) for each patient in (A) and (B), with corresponding patient Nos. and colors. For each patient, there are two measurements that correspond to the time point of the first and last 2HG measurements on the curves in (A) and (B). (E) The fits from a mixed nonlinear regression analysis of the 2HG concentration data in (A) and (B), which are 1.9 + 3.7e−month/11 and 1.9 + 3.4e−month/3.3, respectively, are shown. The coefficients of determination (r2) are 0.58 and 0.46, respectively. In each case, the month marked by a black solid line indicates the time point (ie, decaying time constant) at which the exponent equals −1. There was a significant difference in the rate of decrease in 2HG concentration (oligodendrogliomas, 3.3 months v astrocytomas and mixed gliomas, 11.0 months; P = .01). (F) A mixed nonlinear regression analysis of the oligodendroglioma data was performed. Patients were subgrouped by chemotherapy regimen: three to six cycles of carmustine (n = 7) or 12 cycles of temozolomide (n = 7). The fits (2.0 + 3.5e−month/3.0 and 2.0 + 3.3e−month/3.0, respectively) are shown together with 95% CIs (dashed lines). For each group, the month marked by a black solid line indicates the time point (ie, decaying time constant) at which the exponent equals −1. There was no significant difference in the rate of decrease in 2HG concentration (P = .99).
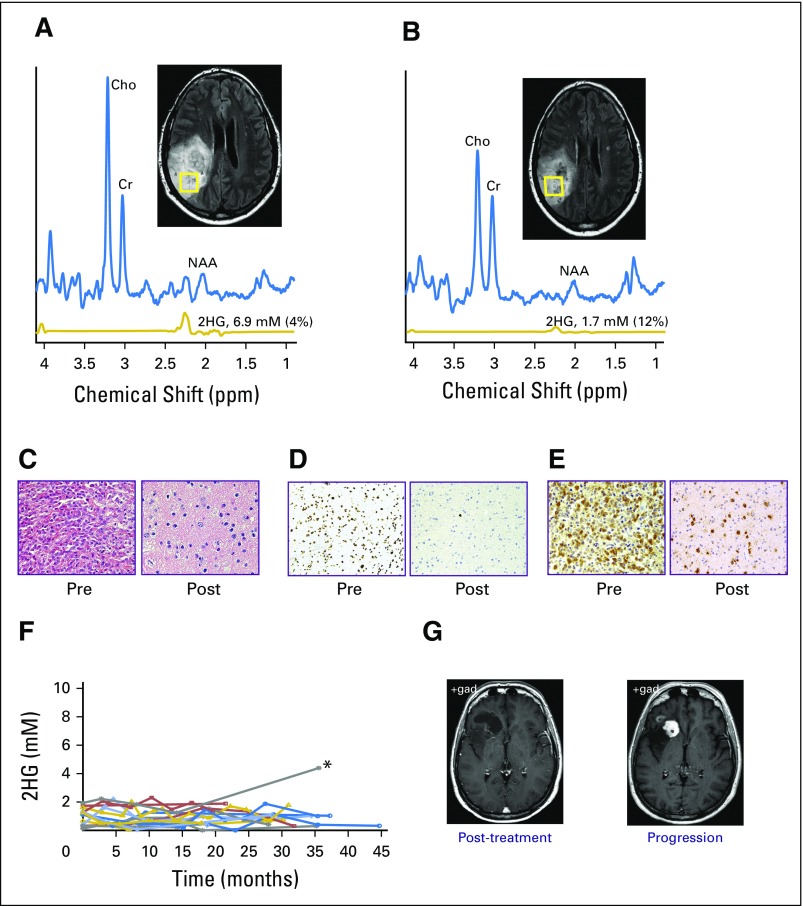
Of the 14 patients with oligodendroglioma, seven were treated with carmustine and seven with temozolomide, providing the opportunity to directly compare changes in 2HG concentration and tumor volume prospectively as a function of treatment. The two treatment groups were well balanced for age and clinical characteristics. The 2HG concentration time course showed a significant decrease in 2HG concentration that was measurable in each patient at the time of the first scan during treatment (6 to 8 weeks), and the nonlinear regression analysis showed near overlap of the two time curves (Fig 4F). Neither the total percent decrease in 2HG concentration (± SEM; 70% ± 3% v 65% ± 3%; P = .3) nor the total percent decrease in tumor volume (± SEM; 34% ± 7% v 37% ± 7%; P = .8) differed significantly between the groups (temozolomide v carmustine, respectively), suggesting an equivalent cytotoxic response to the two alkylating agents. Histologic confirmation of the cytotoxic response was obtained for one patient who underwent a subtotal resection for seizure management 1 year after completing carmustine treatment (Figs 5A and 5B). There was a marked decrease in tumor cellularity (Fig 5C) and near complete shutdown of proliferation post-treatment (Fig 5D). The persistence of IDH-positive cells post-treatment (Fig 5E) was consistent with the finding from the cohort as a whole that there was a low but measureable and persistent level of 2HG post-treatment after maximum 2HG reduction in response to treatment (± SEM; 1.9 ± 0.3 mM).
Fig 5.
(A to E) Pre- and post-treatment comparison of 2-hydroxyglutarate (2HG) concentration and histologic markers in a patient with grade 3 oligodendroglioma (1p/19q codeleted, IDH1 R132H mutated). (A) Single-voxel magnetic resonance spectroscopy (MRS) data (voxel size, 20 × 20 × 20 mm3) with 2HG concentration measurement were obtained before initiation of carmustine (6.9 mM) and (B) 1 year after completing treatment (1.7 mM). Surgery was performed after the scan in (B). Numbers in parentheses indicate the 2HG Cramer–Rao lower bounds. (C) Hematoxylin and eosin staining shows high cellularity in the pretreatment biopsy, with marked decrease in the resected tumor post-treatment, (D) corresponding to a decrease in the MIB-1 proliferation index from 30% (pretreatment) to 1% (post-treatment). (E) All tumor cells were strongly isocitrate dehydrogenase 1 R132H immunoreactive. (F) Individual scans from 15 patients who had completed all treatment before their first 2HG MRS scan at 0 months. 2HG concentration was ≤ 2 mM over the course of follow-up, (*) except in one patient, who experienced progression at 35 months (2HG concentration, 4.4 mM). The prior 2HG MRS scan was performed at month 14 (2HG concentration, 1.2 mM). (G) Representative corresponding clinical postgadolinium axial images are shown for the post-treatment scan performed 1 year before progression and at the time of progression, showing new gadolinium enhancement. Histologic images in (C) and (E) are ×200 magnification, and in (D) are ×100 magnification. Cho, choline; Cr, creatine; NAA, N-acetyl aspartate.
Following from this, we conducted serial imaging in a separate cohort of 15 patients (cohort 5) who entered the imaging study up to 24 months after treatment. With an additional median follow-up time of 31 months (range, 18 to 46 months), there was no change in clinical assessment by RANO, and the mean 2HG concentration (± SEM) was unchanged (first scan, 1.0 ± 0.2 mM v last scan, 0.9 ± 0.2 mM; P = .8) in 14 of 15 patients (Fig 5F). One patient experienced radiographic progression 35 months after completing treatment, with development of increase in gadolinium enhancement (Fig 5G) and an increase in 2HG concentration from 1.2 to 4.4 mM. Taken together, the treatment and post-treatment follow-up 2HG data demonstrate the clinical validity of the 2HG MRS method in these settings.
DISCUSSION
In this study, we established that noninvasive, quantitative evaluation of 2HG in IDH-mutated gliomas by MRS is technically reproducible and reliably reports the disease state across the clinical spectrum, from indolent disease through post-treatment follow-up. 2HG concentration is positively correlated with tumor cellularity, and significant differences in 2HG concentration between high- and lower-grade gliomas reflect differences in cellularity but not histologic subtype. Although additional prospective studies of preoperative 2HG MRS with subsequent tissue analysis of IDH status are needed to establish sensitivity and specificity in general clinical practice, we were able to establish a threshold of clinical confidence using 2HG MRS to make a presumptive molecular diagnosis of an IDH-mutated glioma without tissue analysis.
There are potential applications for using 2HG MRS as a biomarker for clinical trials in glioma. First, in conjunction with IDH inhibitors, 2HG MRS could be used as a surrogate marker of target inhibition where knockdown of 2HG would signal adequate drug penetration into the brain and tumor. Second, for patients without a tissue diagnosis because of neurosurgical risk, the capability of making a presumptive molecular diagnosis of an IDH mutation on the basis of 2HG MRS could make them eligible for a clinical trial. Moreover, subsequent treatment with a selective IDH1 or IDH2 inhibitor in conjunction with 2HG MRS assessment could potentially narrow the molecular diagnosis to the individual gene, because 2HG knockdown would only be expected if the inhibitor were precisely matched to the mutation. Third, as we have shown for the oligodendroglioma subset of treated tumors, 2HG MRS could be used in treatment response assessment, comparing therapies directly in the first-line setting. Finally, retreatment response evaluation could incorporate 2HG MRS, where failure to knockdown 2HG in a previously responsive tumor would be consistent with resistance to the therapy.
ACKNOWLEDGMENT
We thank the patients who participated in this study and highly value the time they spent in every scan. We acknowledge the collaboration, many discussions, and institutional support provided by Dean Sherry, PhD. We also thank Ivan Dimitrov, PhD, for technical assistance and Ingo Mellinghoff, MD, for productive discussions regarding the comparison of data obtained at University of Texas Southwestern with this method implemented at Memorial Sloan Kettering Cancer Center. We thank Jeannie Baxter, RN, for assistance with all phases of the research imaging study and Rani Varghese, Salvador Pena, and Lily Yang for expert care of the patients during research scans. We thank Michael Levy, APN, Calli Fanous, APN, Josie Sewell, APN, and Myriam Zoghbi, RN, for their expert assistance in identifying patients for the study and coordinating their clinical and research scans. We also thank Niccole Williams and Agatha Villegas for their expert assistance related to pathologic analysis, including sample identification and database management.
Appendix
Surgical Navigation and Tumor Sampling
In a subset of patients who underwent research imaging before surgery, a surgical navigation device (BrainLAB AG, Feldkirchen, Germany) was used to match the location of the specimen submitted for histologic analysis as closely as possible with the voxel from which 2-hydroxyglutarate (2HG) magnetic resonance (MR) spectroscopy (MRS) data were obtained preoperatively.
Assessment of IDH Mutational Status
IDH mutations were identified through standard assessment of tumor tissue by immunohistochemistry for the IDH1 R132H mutation or IDH1 and IDH2 sequencing.8
Assessment of Tumor Cellularity
All histopathologic assessment was performed by a neuropathologist (J.M.R.) who was blinded to the 2HG concentration results from MRS. To assess whether there was a correlation between 2HG concentration and cellular density, we performed detailed histologic analysis of tumors from patients who had undergone a surgical procedure within 1 month of MRS and whose tumors had an IDH1 R132H mutation. Assessment of IDH1/R132H immunoreactivity enabled direct visualization of the neoplastic cells, which is especially advantageous when examining areas of diffuse infiltration. Tumor cellularity was classified into four categories based on clinical convention: dense cellularity (neoplastic cells are back to back and overlapping), high cellularity (adjacent neoplastic cells are back to back), moderate cellularity (neoplastic cells are not back to back and have intervening neuropil), and low cellularity (neoplastic cells are widely spaced with relatively abundant intervening neuropil).
MR Data Acquisition
T2-weighted fluid-attenuated inversion recovery scan parameters were: repetition time (TR), 11,000 ms; echo time (TE), 125 ms; and inversion time, 2,800 ms; field of view, 230 × 230 mm2; slice thickness, 5 mm; and 28 slices along each of transverse and sagittal directions.
MR experiments were carried out on a whole-body 3T scanner (Philips Medical Systems, Best, the Netherlands), equipped with a whole-body coil for radiofrequency (RF) transmission and an eight-channel phased array head coil for reception. The point-resolved spectroscopy (PRESS) sequence used in our study included a 9.8-ms 90° pulse (bandwidth, 4.2 kHz) and two 13.2-ms 180° RF pulses (bandwidth, 1.3 kHz) at an RF field intensity (B1) of 13.5 µT, which were all vendor-supplied RF pulses (selected with an RF pulse option of sharp). The subecho times of PRESS were set at TE1 of 32 ms and TE2 of 65 ms (total TE, 97 ms). Data were acquired with a TR of 2.0 s, 128 to 1,024 signal averages (scan time, 4 to 34 minutes), spectral width of 2,500 Hz, and 2,048 sampling points. The PRESS RF carrier frequencies were set to 2.6 ppm. First- and second-order shimming was carried out, using FASTMAP (fast automatic shimming technique by mapping along projections; Gruetter R: Magn Reson Med 29:804-811, 1993). A vendor-supplied four-pulse variable-flip angle subsequence was used for water suppression. In each water-suppressed PRESS scan, unsuppressed PRESS water signal was acquired with the same gradient scheme for eddy current compensation. The multichannel data were combined, with the scanner built-in routine, by summing the multichannel data after correcting the zero order phase difference between channels using water reference data. To minimize motion artifacts, foam pads were placed to restrict head motions inside the reception coil.
For proton MR spectroscopic imaging (MRSI), a vendor-supplied two-dimensional elliptical k-space sampling scheme (Maudsley AA, et al: Magn Reson Med 31:645-651, 1994) was used, which reduced the scan time by approximately 30%. Each k-space point with 2,048 complex points was acquired with two signal averages and a TR of 1.2 s. The MRSI data were reconstructed with two-dimensional Fourier transformation of the k-space data, after zero padding the data matrix to two-fold along each phase-encoding direction (ie, 40 × 32 mm2) to obtain spatial resolution of 5 × 5 mm2. Four outer-volume suppression bands were placed in the periphery of the volume of interest to minimize potential contamination from extracranial lipids and water outside the volume of interest. The scan time of a single MRSI acquisition was approximately 10 minutes.
MRS Data Analysis
MRS data were apodized with a 1-Hz exponential function before LCModel (s-provencher.com/pages/lcmodel.shtml) fitting. The basis set included model spectra of 21 metabolites, which included 2HG, glutamate, glutamine, glutathione, GABA, citrate, aspartate, myo-inositol, scyllo-inositol, glycine, lactate, alanine, acetate, taurine, glucose, ethanolamine, phosphorylethanolamine, N-acetyl aspartate, N-acetyl-aspartate-glutamate, creatine plus phosphocreatine, and glycerophosphorylcholine plus phosphorylcholine. The LCModel built-in functions were used for fitting of macromolecule and lipid signals. The spectral fitting was conducted between 0.5 and 4.1 ppm. Spectra with LCModel-returned linewidths of less than 8 Hz were included in subsequent data analysis. The 2HG T2 relaxation effect was corrected using a published glutamate T2 of 180 ms (Ganji SK, et al: NMR Biomed 25:523-529, 2012). For the multiple nonlinear regression analysis of the treatment 2HG data, the regression model used was
where y and t denote the estimated 2HG levels and months, respectively. Here, t = c + c′η represents the characteristic decaying constant at which the exponent equals −1.
For the fitting of the data from patients with oligodendroglioma and astrocytoma, the analysis was conducted to obtain the coefficients a, b, b′, c, and c′ while setting η at 0 or 1 for oligodendroglioma or astrocytoma, respectively. The analysis for the data from the patients with oligodendroglioma treated with carmustine or temozolomide was carried out similarly, in which η was set at 0 or 1 for carmustine or temozolomide, respectively. The P values of the five coefficients were obtained, of which those of b′ and c′ indicated the statistical significance of the differences between oligodendrogliomas and astrocytomas and between carmustine and temozolomide.
Table A1.
Demographic Characteristics, IDH Mutational Status, and 2HG Concentration for Patients in Cohort 1
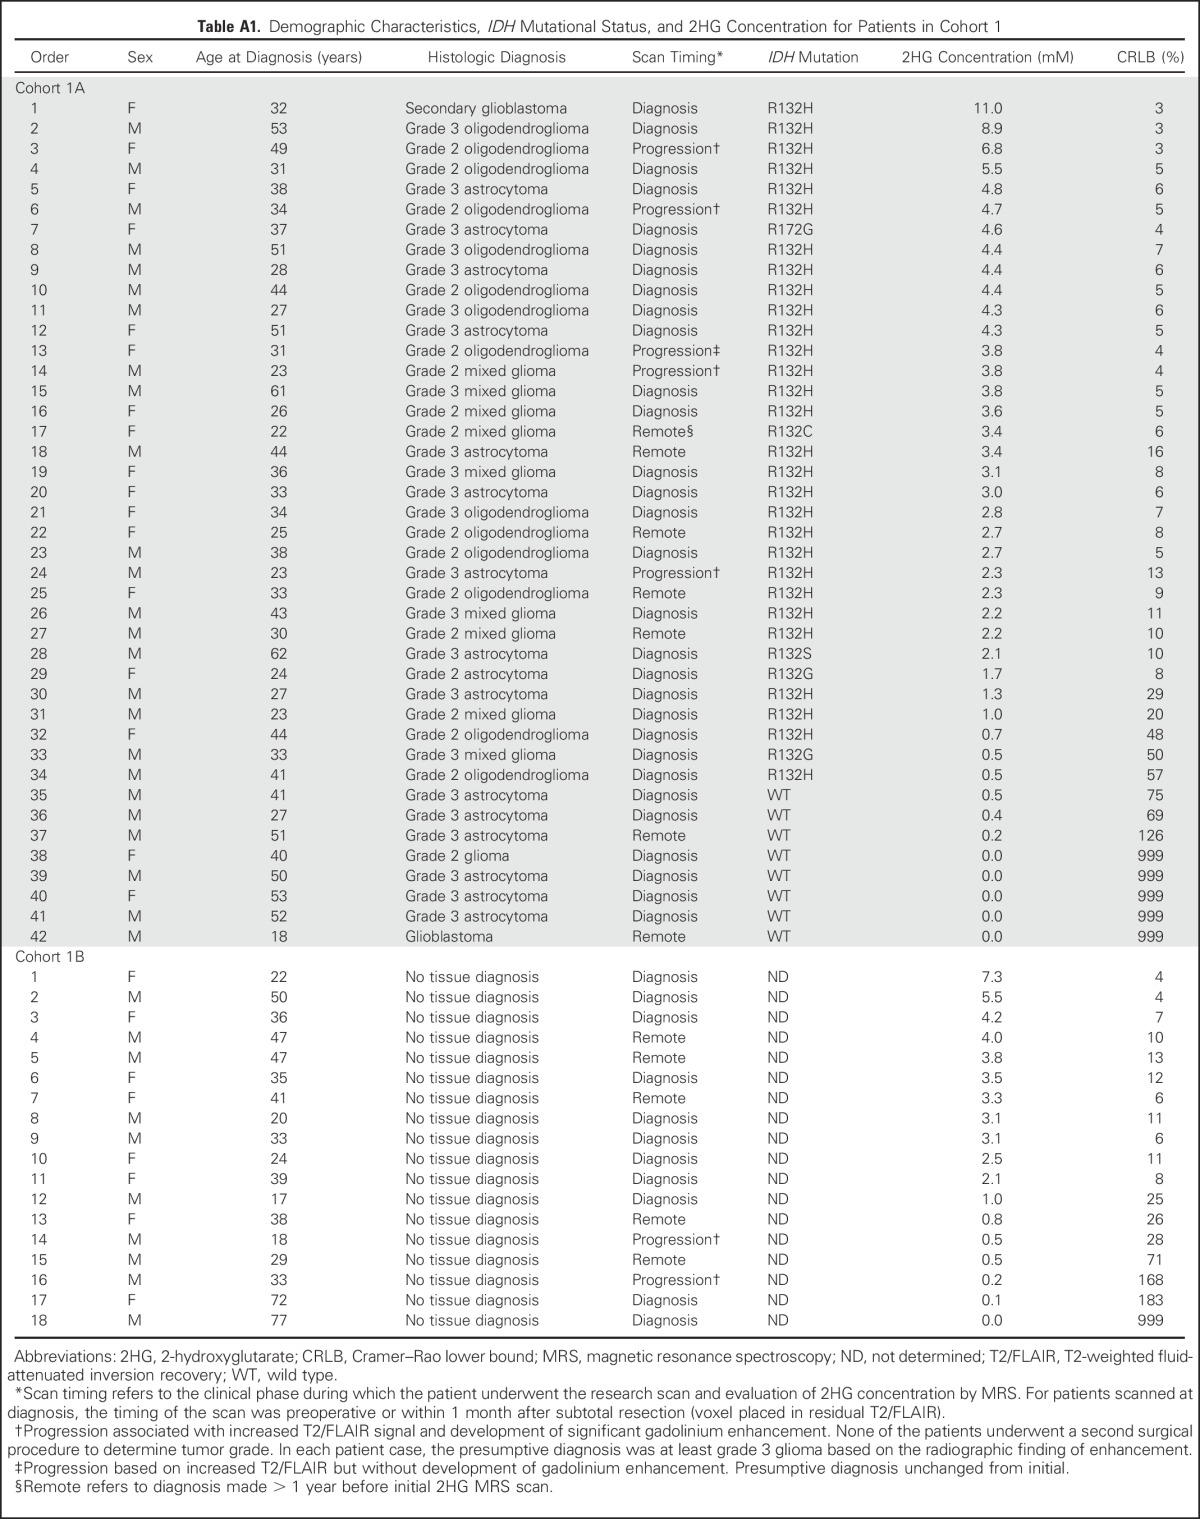
Table A2.
Patient Demographic and Clinical Characteristics in Cohort 2
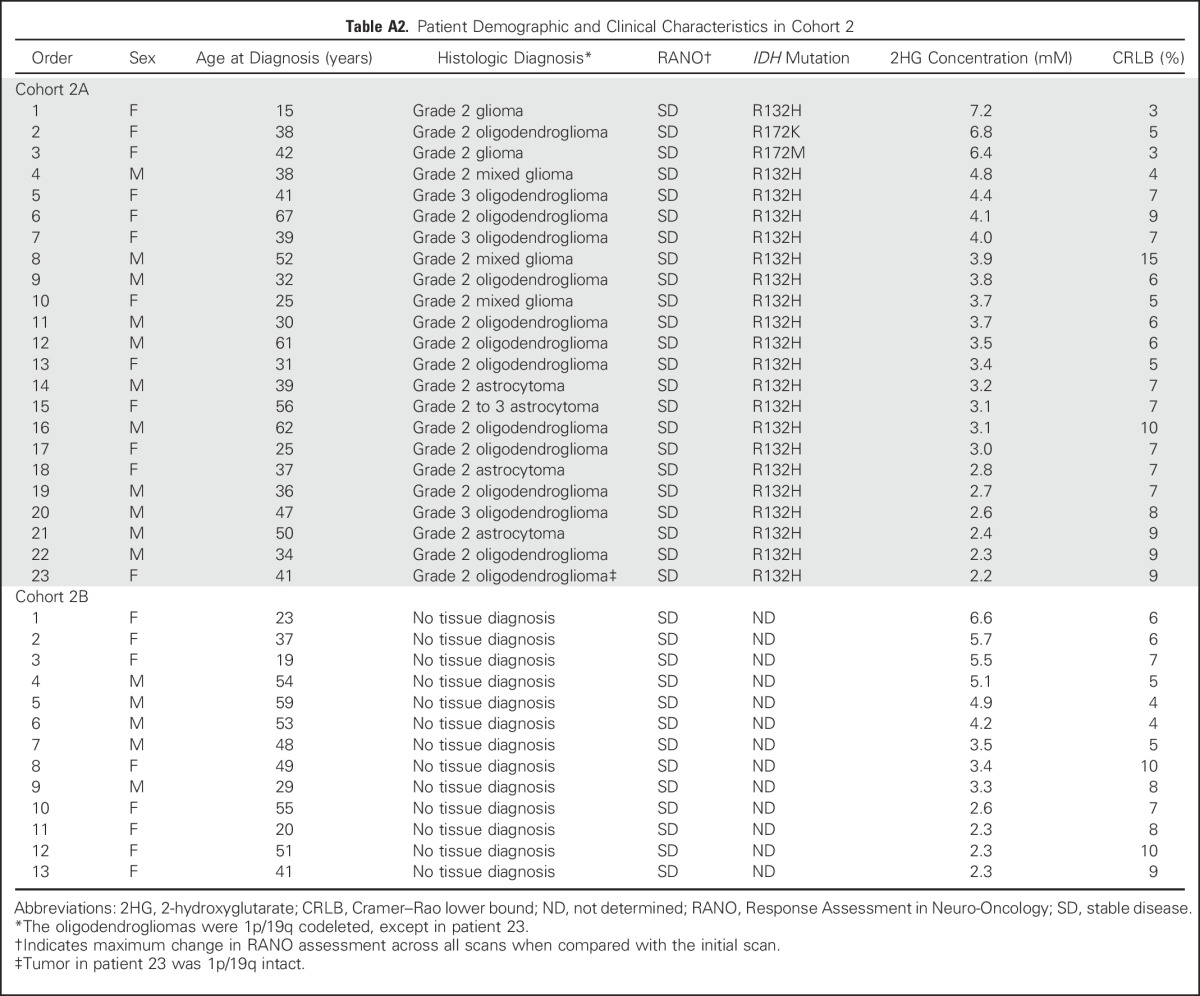
Table A3.
Patient Demographic and Clinical Characteristics in Cohort 3
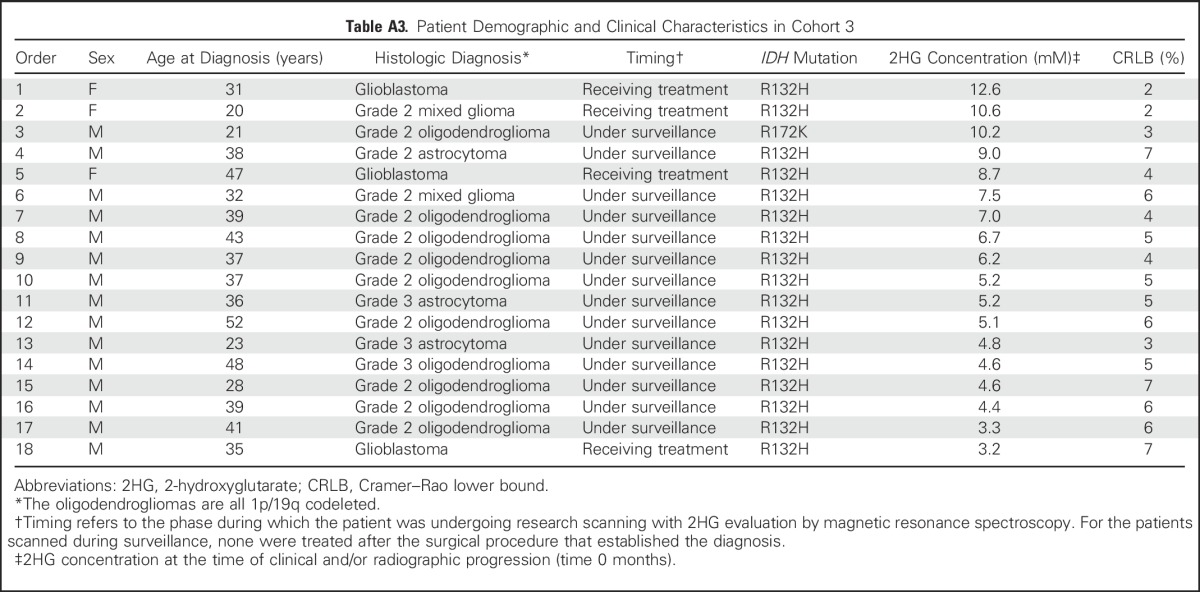
Table A4.
Patient Demographic and Clinical Characteristics in Cohort 4
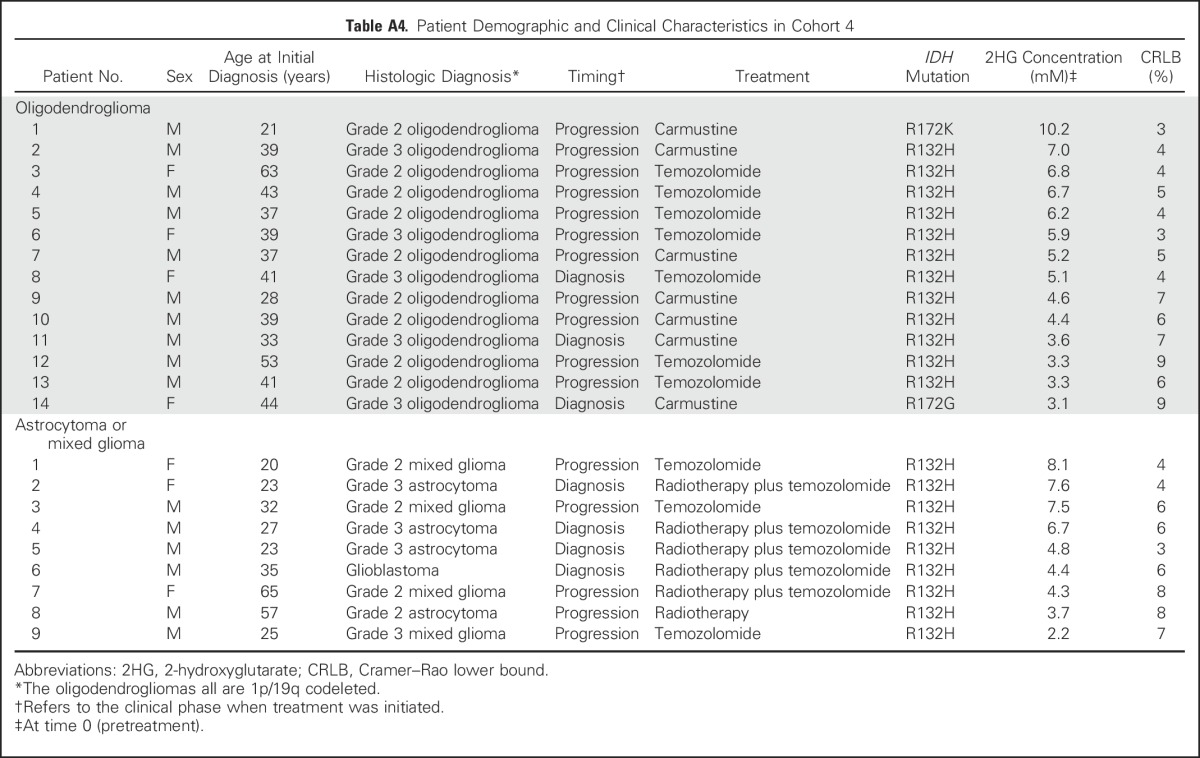
Table A5.
Patient Demographic and Clinical Characteristics in Cohort 5
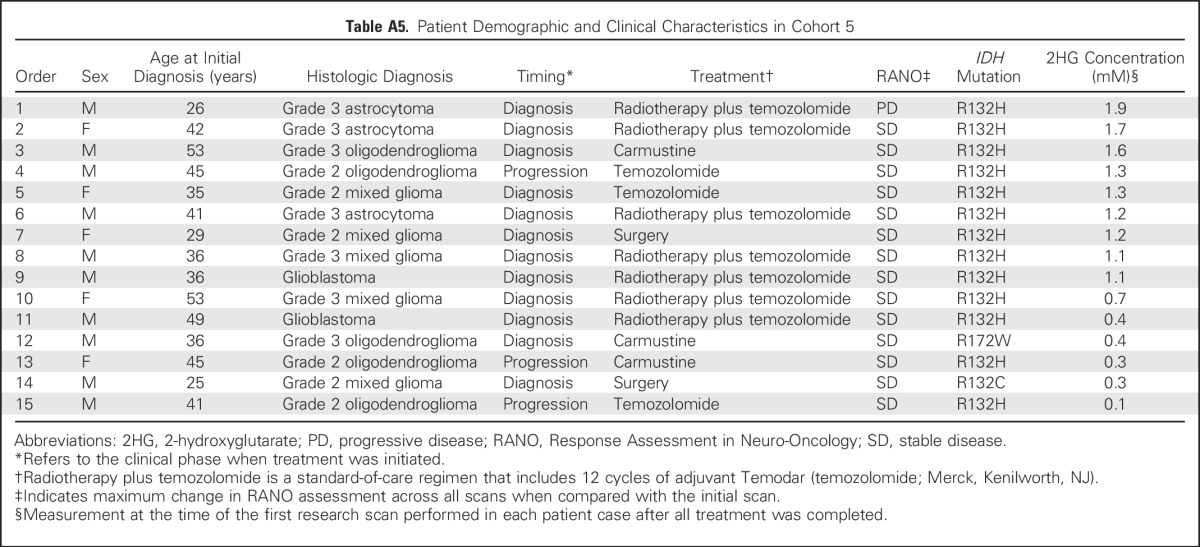
Fig A1.
Comparison of cellularity, isocitrate dehydrogenase 1 (IDH1; R132H) immunoreactivity, and 2-hydroxyglutarate (2HG) concentration (mM) among various grades of glioma. Cellularity was assessed from hematoxylin and eosin (HE) staining. All images are ×200 magnification. (A) Glioblastoma (secondary) shows multiple mitoses with dense cellularity and strong IDH1/R132H immunoreactivity. (B) Grade 3 oligodendroglioma (1p/19q codeleted) shows high cellularity and strong IDH1/R132H immunoreactivity. (C) Grade 3 astrocytoma and (D) grade 2 oligodendroglioma have moderate cellularity, whereas IDH1/R132H staining intensity was unchanged. (E) Grade 2 astrocytoma demonstrated low cellularity with equivalent IDH1/R132H staining intensity. 2HG concentration is correlated with cellularity.
Fig A2.
Tumor heterogeneity and histologic variations contribute to 2-hydroxyglutarate (2HG) level. Representative case of grade 2 oligodendroglioma (isocitrate dehydrogenase 1 [IDH1], R132H). Coronal T2/FLAIR images show locations of (A) anterior voxel (18 × 20 × 15 mm3) and (B) posterior voxel (13 × 18 × 15 mm3). For each location, the voxel placement for magnetic resonance (MR) spectroscopy (MRS; yellow box) is shown on the left image, and the location of surgical sampling (green hatch) is on the right image. MR spectra and 2HG concentration from the two voxels were similar. Numbers in parentheses indicate the 2HG Cramer–Rao lower bounds. (C) Hematoxylin and eosin (HE) staining shows nodule of high cellularity on the left, contrasted with HE showing a region of low cellularity on the right. (D) IDH1/R132H immunohistochemistry corresponding to the sections in (C). Regions of both histologic findings were found in the anterior and posterior voxels. 2HG concentration in each voxel represents the composite contribution of the cellularity within the region of tumor. Cho, choline; Cr, creatine; NAA, N-acetyl aspartate; T2/FLAIR, T2-weighted fluid-attenuated inversion recovery.
Fig A3.
(A) Correlation of 2-hydroxyglutarate (2HG) concentration with tumor cellularity. Using the isocitrate dehydrogenase 1 (IDH1)/R132H–specific antibody, tumor cellularity was determined for each patient who had this specific mutation and underwent a surgical procedure within 1 month of the 2HG magnetic resonance spectroscopy (MRS) evaluation (Spearman rank correlation r = 0.90). (B) Stable 2HG concentration during period of tumor stability. Single-voxel MRS scans were analyzed serially in individual patients (shown in Figs 2A and 2B), and 2HG concentration was plotted over time. Month 0 was the first scan at enrollment in the study. Here we show the change in 2HG concentration between scans for the 36 patients. Means (± standard deviations) were calculated for consecutive 3-month periods. There were no statistical differences at any time point.
Fig A4.
Mapping of the decrease in 2-hydroxyglutarate (2HG) concentration after treatment. A representative series of multivoxel images is shown for two patients after treatment. (A) Same patient shown in Fig 3E, who was treated with six cycles of carmustine at the time of progression (multivoxel grid dimension, 100 × 80 mm2). Grid removed to enable visualization of T2-weighted fluid-attenuated inversion recovery (T2/FLAIR) changes over time. (B) Patient with grade 3 astrocytoma treated with concurrent temozolomide and radiotherapy followed by 12 cycles of temozolomide at the time of progression (multivoxel grid dimension, 90 × 100 mm2). MRS, magnetic resonance spectroscopy.
Footnotes
Supported by National Institutes of Health (NIH) Grants No. R21 CA159128 and R01 CA184584 (C.C.) and No. RC NS070675 and R01 CA154843 (E.A.M.), by NIH Resource Grant No. EB015908, by Simmons Cancer Center NIH Support Grant No. 5P30 CA142543, by Cancer Prevention Research Institute of Texas Grants No. RP130427 (C.C.) and No. RP130629 (E.A.M.), by Young Texans Against Cancer (R.M.B., E.A.M.), and by philanthropic funds from the Advanced Imaging Research Center, Annette G. Strauss Center for Neuro-Oncology, Miller Family Fund in Neuro-Oncology, and Gladie Jo Salvino Fund for Glioblastoma Research at the University of Texas Southwestern Medical Center.
Presented in part at the American Association for Cancer Research Annual Meeting, San Diego, CA, April 5-9, 2014; Society for Neuro-Oncology Annual Meeting, Miami, FL, November 13-16, 2014; and International Society for Magnetic Resonance in Medicine Annual Meeting, Salt Lake City, UT, April 20-26, 2013.
Authors’ disclosures of potential conflicts of interest are found in the article online at www.jco.org. Author contributions are found at the end of this article.
AUTHOR CONTRIBUTIONS
Conception and design: Changho Choi, Craig R. Malloy, Robert M. Bachoo, Elizabeth A. Maher
Provision of study materials or patients: James Battiste, Samuel Barnett, Christopher J. Madden, Toral R. Patel, Edward Pan, Bruce E. Mickey, Elizabeth A. Maher
Collection and assembly of data: Changho Choi, Sandeep K. Ganji, Sarah S. McNeil, Zhongxu An, Akshay Madan, Kimmo J. Hatanpaa, Vamsidhara Vemireddy, Christie A. Sheppard, Dwight Oliver, Keith M. Hulsey, Vivek Tiwari, Tomoyuki Mashimo, James Battiste, Samuel Barnett, Christopher J. Madden, Toral R. Patel, Bruce E. Mickey, Robert M. Bachoo, Elizabeth A. Maher
Data analysis and interpretation: Changho Choi, Jack M. Raisanen, Sandeep K. Ganji, Song Zhang, Zhongxu An, Kimmo J. Hatanpaa, Dwight Oliver, Edward Pan, Craig R. Malloy, Bruce E. Mickey, Robert M. Bachoo, Elizabeth A. Maher
Manuscript writing: All authors
Final approval of manuscript: All authors
AUTHORS' DISCLOSURES OF POTENTIAL CONFLICTS OF INTEREST
Prospective Longitudinal Analysis of 2-Hydroxyglutarate Magnetic Resonance Spectroscopy Identifies Broad Clinical Utility for the Management of Patients With IDH-Mutant Glioma
The following represents disclosure information provided by authors of this manuscript. All relationships are considered compensated. Relationships are self-held unless noted. I = Immediate Family Member, Inst = My Institution. Relationships may not relate to the subject matter of this manuscript. For more information about ASCO’s conflict of interest policy, please refer to www.asco.org/rwc or jco.ascopubs.org/site/ifc.
Changho Choi
Consulting or Advisory Role: Agios Pharmaceuticals
Travel, Accommodations, Expenses: Agios Pharmaceuticals
Jack M. Raisanen
No relationship to disclose
Sandeep K. Ganji
No relationship to disclose
Song Zhang
No relationship to disclose
Sarah S. McNeil
No relationship to disclose
Zhongxu An
Stock or Other Ownership: Juno Therapeutics, Kite Pharma, Johnson & Johnson, Medtronic, UnitedHealthcare
Akshay Madan
Consulting or Advisory Role: Medtronic
Kimmo J. Hatanpaa
No relationship to disclose
Vamsidhara Vemireddy
No relationship to disclose
Christie A. Sheppard
No relationship to disclose
Dwight Oliver
No relationship to disclose
Keith M. Hulsey
No relationship to disclose
Vivek Tiwari
No relationship to disclose
Tomoyuki Mashimo
No relationship to disclose
James Battiste
Honoraria: Novocure
Speakers’ Bureau: Novocure
Samuel Barnett
No relationship to disclose
Christopher J. Madden
No relationship to disclose
Toral R. Patel
Stock or Other Ownership: Abbott Laboratories/AbbVie, Exact Sciences, ZIOPHARM Oncology, Intrexon, Gilead Sciences, Juno Therapeutics, Stryker, Agios, Edwards Lifesciences
Edward Pan
Stock or Other Ownership: Johnson & Johnson
Honoraria: Sigma-Tau
Consulting or Advisory Role: Novocure, Genentech
Speakers’ Bureau: Sigma-Tau
Craig R. Malloy
No relationship to disclose
Bruce E. Mickey
No relationship to disclose
Robert M. Bachoo
Honoraria: Agios Pharmaceuticals (I)
Consulting or Advisory Role: Agios Pharmaceuticals (I)
Travel, Accommodations, Expenses: Agios Pharmaceuticals (I)
Elizabeth A. Maher
Honoraria: Agios Pharmaceuticals
Consulting or Advisory Role: Agios Pharmaceuticals
Travel, Accommodations, Expenses: Agios Pharmaceuticals
REFERENCES
- 1.Parsons DW, Jones S, Zhang X, et al. An integrated genomic analysis of human glioblastoma multiforme. Science. 2008;321:1807–1812. doi: 10.1126/science.1164382. [DOI] [PMC free article] [PubMed] [Google Scholar]
- 2.Yan H, Parsons DW, Jin G, et al. IDH1 and IDH2 mutations in gliomas. N Engl J Med. 2009;360:765–773. doi: 10.1056/NEJMoa0808710. [DOI] [PMC free article] [PubMed] [Google Scholar]
- 3.Dang L, White DW, Gross S, et al. Cancer-associated IDH1 mutations produce 2-hydroxyglutarate. Nature. 2009;462:739–744. doi: 10.1038/nature08617. [DOI] [PMC free article] [PubMed] [Google Scholar]
- 4.Brat DJ, Verhaak RG, Aldape KD, et al. Comprehensive, integrative genomic analysis of diffuse lower-grade gliomas. N Engl J Med. 2015;372:2481–2498. doi: 10.1056/NEJMoa1402121. [DOI] [PMC free article] [PubMed] [Google Scholar]
- 5.Eckel-Passow JE, Lachance DH, Molinaro AM, et al. Glioma groups based on 1p/19q, IDH, and TERT promoter mutations in tumors. N Engl J Med. 2015;372:2499–2508. doi: 10.1056/NEJMoa1407279. [DOI] [PMC free article] [PubMed] [Google Scholar]
- 6.Suzuki H, Aoki K, Chiba K, et al. Mutational landscape and clonal architecture in grade II and III gliomas. Nat Genet. 2015;47:458–468. doi: 10.1038/ng.3273. [DOI] [PubMed] [Google Scholar]
- 6a.Louis DN, Perry A, Reifenberger G, et al. The 2016 World Health Organization classification of tumors of the central nervous system: A summary. Acta Neuropathol. 2016;131:803–820. doi: 10.1007/s00401-016-1545-1. [DOI] [PubMed] [Google Scholar]
- 7.Pope WB, Prins RM, Albert Thomas M, et al. Non-invasive detection of 2-hydroxyglutarate and other metabolites in IDH1 mutant glioma patients using magnetic resonance spectroscopy. J Neurooncol. 2012;107:197–205. doi: 10.1007/s11060-011-0737-8. [DOI] [PMC free article] [PubMed] [Google Scholar]
- 8.Choi C, Ganji SK, DeBerardinis RJ, et al. 2-hydroxyglutarate detection by magnetic resonance spectroscopy in IDH-mutated patients with gliomas. Nat Med. 2012;18:624–629. doi: 10.1038/nm.2682. [DOI] [PMC free article] [PubMed] [Google Scholar]
- 9.Andronesi OC, Kim GS, Gerstner E, et al. Detection of 2-hydroxyglutarate in IDH-mutated glioma patients by in vivo spectral-editing and 2D correlation magnetic resonance spectroscopy. Sci Transl Med. 2012;4:116ra4. doi: 10.1126/scitranslmed.3002693. [DOI] [PMC free article] [PubMed] [Google Scholar]
- 10.Choi C, Ganji S, Hulsey K, et al. A comparative study of short- and long-TE ¹H MRS at 3 T for in vivo detection of 2-hydroxyglutarate in brain tumors. NMR Biomed. 2013;26:1242–1250. doi: 10.1002/nbm.2943. [DOI] [PMC free article] [PubMed] [Google Scholar]
- 11.de la Fuente MI, Young RJ, Rubel J, et al. Integration of 2-hydroxyglutarate-proton magnetic resonance spectroscopy into clinical practice for disease monitoring in isocitrate dehydrogenase-mutant glioma. Neuro-oncol. 2016;18:283–290. doi: 10.1093/neuonc/nov307. [DOI] [PMC free article] [PubMed] [Google Scholar]
- 12.Andronesi OC, Loebel F, Bogner W, et al. Treatment response assessment in IDH-mutant glioma patients by noninvasive 3D functional spectroscopic mapping of 2-hydroxyglutarate. Clin Cancer Res. 2016;22:1632–1641. doi: 10.1158/1078-0432.CCR-15-0656. [DOI] [PMC free article] [PubMed] [Google Scholar]
- 13.van den Bent MJ, Wefel JS, Schiff D, et al. Response assessment in neuro-oncology (a report of the RANO group): Assessment of outcome in trials of diffuse low-grade gliomas. Lancet Oncol. 2011;12:583–593. doi: 10.1016/S1470-2045(11)70057-2. [DOI] [PubMed] [Google Scholar]
- 14.Provencher SW. Estimation of metabolite concentrations from localized in vivo proton NMR spectra. Magn Reson Med. 1993;30:672–679. doi: 10.1002/mrm.1910300604. [DOI] [PubMed] [Google Scholar]
- 15.Fazli S, Nadirkhanlou P. A novel method for automatic segmentation of brain tumors in MRI images. IJASCSE. 2013;2:1–6. [Google Scholar]
- 16.Nutt CL, Noble M, Chambers AF, et al. Differential expression of drug resistance genes and chemosensitivity in glial cell lineages correlate with differential response of oligodendrogliomas and astrocytomas to chemotherapy. Cancer Res. 2000;60:4812–4818. [PubMed] [Google Scholar]
- 17.van den Bent MJ, Brandes AA, Taphoorn MJ, et al. Adjuvant procarbazine, lomustine, and vincristine chemotherapy in newly diagnosed anaplastic oligodendroglioma: Long-term follow-up of EORTC Brain Tumor Group study 26951. J Clin Oncol. 2013;31:344–350. doi: 10.1200/JCO.2012.43.2229. [DOI] [PubMed] [Google Scholar]


