

Summary
Functional circuits in the visual cortex require the coordinated activity of excitatory and inhibitory neurons. Molecular genetic approaches in the mouse have led to the ‘local nonspecific pooling principle’ of inhibitory connectivity, in which inhibitory neurons are untuned for stimulus features due to the random pooling of local inputs. However, it remains unclear whether this principle generalizes to species with a columnar organization of feature selectivity such as carnivores, primates, and humans. Here we use virally-mediated GABAergic-specific GCaMP6f expression to demonstrate that inhibitory neurons in ferret visual cortex respond robustly and selectively to oriented stimuli. We find that the tuning of inhibitory neurons is inconsistent with the local non-specific pooling of excitatory inputs, and that inhibitory neurons exhibit orientation-specific noise correlations with local and distant excitatory neurons. These findings challenge the generality of the non-specific pooling principle for inhibitory neurons, suggesting different rules for functional excitatory-inhibitory interactions in non-murine species.
Introduction
New techniques for imaging and manipulating the activity of distinct classes of neurons are greatly enriching our understanding of the fundamental principles of neural circuit organization that underlie cortical function (Adesnik et al., 2012; Atallah et al., 2012; Lee et al., 2012; Olsen et al., 2012; Pi et al., 2013; Taniguchi et al., 2011; Wilson et al., 2012). One such principle that has emerged from studies of mouse neocortex is that GABAergic neurons derive their excitatory inputs by sampling nonspecifically from nearby pyramidal cells (Bock et al., 2011; Hofer et al., 2011; Packer and Yuste, 2011). This non-specific pooling of local excitatory inputs is consistent with the fact that excitatory neurons in mouse visual cortex, while well-tuned for a range of stimulus features including orientation, spatial frequency, ocular dominance, and binocular phase disparity, are arranged in a ‘salt-and-pepper’ organization, while GABAergic neurons exhibit non-selective or poorly tuned responses (but see Runyan et al., 2010) that are well-predicted by the tuning of the local excitatory population (Kameyama et al., 2010; Kerlin et al., 2010; Runyan and Sur, 2013; Scholl et al., 2015).
While this local non-specific pooling principle appears to explain the functional properties of GABAergic neurons in the mouse, it is still unclear whether this principle applies to the organization of cortical circuits in other species. GABAergic neurons in the visual cortex of carnivores exhibit selective responses for stimulus features such as orientation and direction of motion (Azouz et al., 1997; Cardin et al., 2007; Hirsch et al., 2003; Keller and Martin, 2015; Martin et al., 1983), suggesting a potentially different organizing principle for interneuron wiring. However, this interpretation is complicated by the spatial clustering of neurons with similar functional properties into columnar maps in the carnivore and primate (Blasdel and Salama, 1986; Grinvald et al., 1986; Kara and Boyd, 2009; Nauhaus et al., 2012; Ohki et al., 2006; Smith et al., 2015b), which is not present in the rodent (Ohki et al., 2005; but see Ringach et al., 2016). As a result, the selective responses of GABAergic neurons in species with columnar maps could arise from the same non-specific local pooling principle applied to an environment in which nearby pyramidal neurons have similar functional properties.
Addressing this question requires measuring the tuning of large numbers of GABAergic neurons at known locations in the columnar map and relating their tuning to that of the nearby excitatory population. However, probing the principles of cortical GABAergic neuron connectivity in non-murine species has been challenging due to the lack of appropriate molecular reagents that would make it possible to sample the functional properties of large numbers of GABAergic neurons. By using a newly developed viral construct that restricts expression of the calcium indicator GCaMP6f specifically to GABAergic neurons in ferret visual cortex, we have been able to compare the functional properties of GABAergic neurons and pyramidal neurons in two distinct regions of the columnar map: low rate of change areas where adjacent pyramidal neurons exhibit similar preferences, and high rate of change areas (pinwheels and fractures), where adjacent pyramidal neurons exhibit dissimilar feature preferences. We find that GABAergic neurons in ferret visual cortex are well-tuned for orientation and participate in orientation-specific networks with excitatory neurons irrespective of the orientation tuning of their neighbors, a result that challenges the generality of the nonspecific pooling principle that has been described in the mouse.
Results
Viral labeling of GABAergic neurons in ferret visual cortex
For our initial attempts to investigate the tuning properties of GABAergic neurons in the ferret visual cortex, we employed a viral labeling strategy using AAV-expressed GCaMP6f (Chen et al., 2013) under the pan-neuronal promoter synapsin (Syn) packaged in AAV serotype 2/1 (AAV2/1.Syn.GCaMP6f). Although this produced robust expression of GCaMP in neurons (Figure 1A), only a small number (2.7%, 14/511 cells from 2 animals) of these neurons were immunoreactive for the pan-interneuron marker GAD67 (Figure 1A–B). To overcome this limitation, we employed a recently developed enhancer (mDlx) that has been shown to restrict expression to GABAergic neurons of multiple subtypes across a wide range of species, including ferrets (Dimidschstein et al., 2016). AAV encoding GCaMP6f under control of the mDlx enhancer (Figure 1C) robustly and specifically labeled GABAergic neurons of multiple subtypes in ferret visual cortex (Figure 1C–D, Supplementary Figure 1, 58% of cells positive only for GAD67, 36% of cells positive for SOM, 4% of cells positive for PV, 2% lacked inhibitory markers, n = 1601 cells from two animals). The low fraction of parvalbumin-positive (PV+) neurons is consistent with the laminar distribution of PV+ cells in the neocortex, with low density in superficial layer 2/3, where we performed our imaging experiments. In order to characterize the functional properties of identified GABAergic neurons, we developed a procedure to reliably perform in vivo two photon calcium imaging followed by immunostaining and reconstruction. Following in vivo imaging, we sectioned fixed tissue at 50 microns, performed post hoc immunostaining for GAD67 (Meyer et al., 2013), somatostatin, and parvalbumin, and aligned confocal images of each section with the fields of view (FOVs) imaged in vivo (Fig 1E). With this approach, we are able to reliably align in vivo and histological images and readily identify the immunohistochemical subtype of the GABAergic neurons that had been imaged in vivo.
Figure 1. Viral expression of GCaMP6 via mDlx enhancer yields specific labeling of GABAergic neurons in ferret visual cortex.

A) AAV2/1.Syn.GCaMP6f expression in ferret visual cortex fails to label GABAergic neurons; (left to right) Confocal images of GCaMP expression (green), immunostaining for somatostatin (SOM, red), parvalbumin (PV, cyan), and glutamate decarboxylase 67 (GAD67, grayscale); arrows point to individual cell bodies; scale bar 10 μm; B) Fraction of GCaMP6f positive neurons that were also positive for inhibitory markers using synapsin promoter (gray); C) Labeling of GABAergic neurons in ferret visual cortex with AAV2/1.mDlx.GCaMP6f expression (same conventions as in A); D) Fraction of GCaMP6f positive neurons that were also positive for inhibitory markers using mDlx enhancer; E) Identification of corresponding neuronal cell bodies in 2-photon in vivo images and confocal images of tissue slices. Left image shows 2-photon in vivo field of view (scale bar 200 μm), middle image shows corresponding confocal field of view, and the right four images show insets, illustrating high percentage of corresponding cell bodies (scale bar 50 μm). See also Figure S1.
Functional properties of GABAergic neurons
In vivo calcium responses were recorded in 928 neurons positive for GAD67 and negative for somatostatin and parvalbumin (GAD+), 572 somatostatin-positive neurons (SOM+), and 69 PV+ neurons (14 planes, 3 volumes, 2 animals). Inhibitory neurons of all identified subtypes responded robustly to drifting gratings and were selective for stimulus orientation (examples, Figure 2A–B; percentage responsive: 95.6±7.8%, 90.2±7.9%, and 95.0±7.1%; Figure 2C: percentage responsive cells selective for orientation (1-CV > 0.1): 94.8±4.0%, 91.7±7.6%, and 89.3±13.6%, for GAD+, SOM+, and PV+, at n=14, 14, and 8 planes, respectively).
Figure 2. GABAergic neurons in ferret visual cortex exhibit orientation- and direction- selective responses and an orderly columnar architecture.
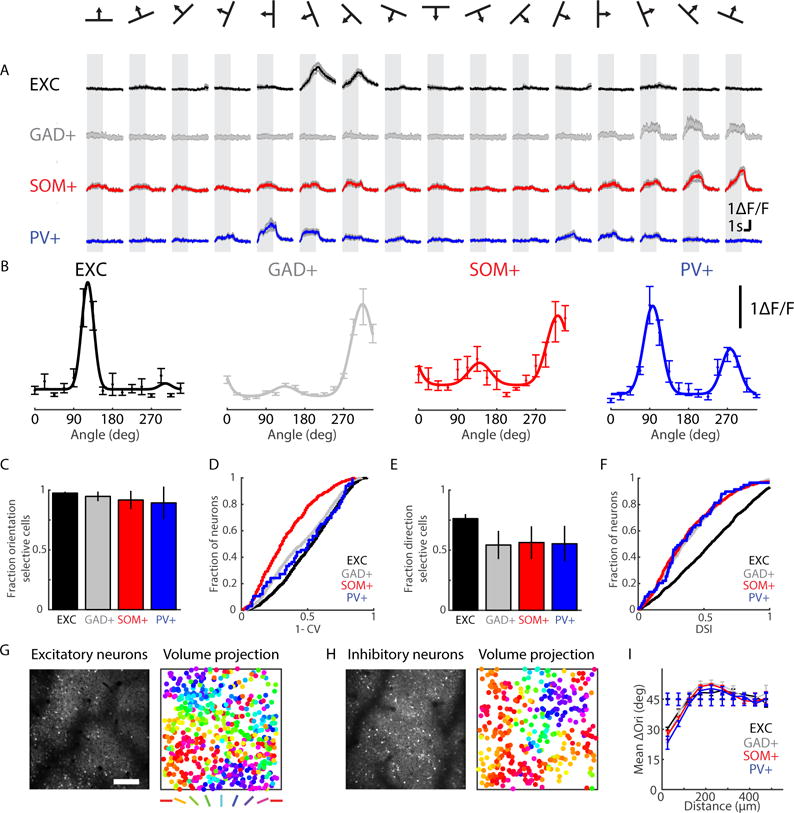
A) Example trial-averaged response time courses of single neurons in response to gratings of different orientations and directions; shaded error bars are mean ± SEM; B) Tuning curves of the neurons in (A), error bars are mean ± SEM and solid line is fit; C) Fraction of orientation-selective neurons in each field of view, error bars are mean ± SEM; D) Distributions of orientation selectivity sorted by subtype; E) Fraction of direction-selective neurons in each field of view, error bars are mean ± SEM; F) Distributions of direction selectivity sorted by subtype; G) Example excitatory field of view (left, scale bar 200 μm), volume projection of all neurons imaged, with neurons pseudocolored by orientation preference; H) same as in G, but for inhibitory neurons; I) Pairwise difference in orientation preference increases with distance for each subtype, solid lines are data and dashed lines are shuffle; error bars are mean ± SEM. See also Figure S2.
In order to relate the properties of GABAergic neurons to non-GABAergic excitatory neurons, we also measured the visually evoked responses of 2008 neurons expressing the AAV2/1.Syn.GCaMP6f construct (7 planes, 3 volumes, 2 animals). As this construct labels low numbers of inhibitory neurons (Figure 1B), all labeled cells were treated as putative excitatory neurons. We found that similar fractions of excitatory neurons (EXC, 86.6±6.5%, n = 7 planes), SOM+ and PV+ neurons were visually responsive (Wilcoxon rank-sum (WRS) of excitatory vs PV+, P = .108, n = 7 excitatory planes and 8 PV+ planes, excitatory vs. SOM+, P = .391, n = 7 excitatory planes and 14 SOM+ planes), though significantly more GAD+ neurons were responsive when compared to excitatory neurons (WRS, P = .00736, n = 7 excitatory planes and 14 GAD+ planes). Similarly, the fraction of orientation-selective cells was similar across cell types (fraction of selective excitatory neurons: 97.4±1.1%; WRS, P = .108 between excitatory and GAD+, P = .217 between excitatory and SOM+, P = 1 between excitatory and PV+). In addition, we found that GAD+ and SOM+ neurons were less orientation selective than excitatory neurons while PV+ neurons were not significantly different from excitatory neurons (WRS, P <.001, n =1763 EXC and n = 896 GAD+ for excitatory vs. GAD+ neurons, P <.001 for EXC vs. SOM+ neurons; n =1763 EXC and n = 517 SOM+; P = .253, n =1763 EXC and n = 66 for EXC vs. PV+ neurons; 1-CV values for GAD+, SOM+, PV+, and EXC, respectively: .46±.23, .34±.20, .48±.25, .52±.22; Figure 2D).
In addition to orientation selectivity, neurons in ferret primary visual cortex are selective for the direction of stimulus motion. We found robust direction selectivity in both excitatory and inhibitory neurons, with a majority of orientation selective cells in all groups also showing strong direction selectivity (Figure 2E, 54.3±11.7%, n = 14 planes; 56.3±13.6%, n = 14 planes; 55.4±14.8%, n = 8 planes; and 76.2±3.7%, n = 7 planes for GAD+, SOM+, PV+, and EXC, respectively). The fraction exhibiting direction-selective responses was greater in excitatory than inhibitory neurons (WRS, P <.001 for excitatory vs GAD+, SOM+, and PV+) and direction selectivity was greater in excitatory vs. inhibitory neurons (Figure 2F, P<.001 for excitatory vs. GAD+, P<.001 for excitatory vs. SOM+, P<.001 for excitatory vs. PV+; DSI values for GAD+, SOM+, PV+ and EXC, respectively: .39±.25, n = 853; .38±.27, n = 459; .38±.26, n = 59; .56±.31, n = 1715).
Inhibitory neurons, like excitatory neurons, were found to be spatially arrayed in an orderly fashion across the surface of ferret visual cortex, forming smoothly varying maps of orientation and direction preference (Figures 2G–H, Supplementary Figure 2A–D). Across all measured neuronal subtypes, we found that similarity in orientation preference between nearby cells was significantly greater than predicted by a random shuffle (Figure 2I, p<.001 by bootstrap test for GAD+ (n = 3 volumes), SOM+ (n = 3 volumes), PV+ (n = 3 volumes), and EXC (n = 3 volumes), n = 1000 shuffles), and that this spatial clustering of cells by orientation preference decayed over distances consistent with the wavelength of the orientation preference map in the ferret (Muller et al., 2000; Smith et al., 2015b). Likewise, the spatial organization of direction preference among GABAergic neurons (Supplementary Figure 2E), was significantly greater than predicted by a shuffle (p < .001 by bootstrap test for shuffle vs. GAD+ (n = 3 volumes), SOM+ (n = 3 volumes), PV+ (n = 3 volumes), and EXC (n = 3 volumes), n = 1000 shuffles). Thus, inhibitory neurons in ferret visual cortex, like excitatory neurons, exhibit robust selectivity and an orderly spatial mapping of preferred stimulus orientation and direction.
Inhibitory orientation selectivity cannot be explained by local excitatory neurons
Although these results demonstrate that inhibitory neurons are mapped with a spatial structure similar to excitatory neurons, testing whether the properties of inhibitory neurons are consistent with surrounding excitatory neurons requires visualizing the activity of both populations in the same region of cortex. To achieve this, we injected a mixture of AAV2/1.Syn.GCaMP6f and AAV2/1.mDlx.GCaMP6f to label both excitatory and inhibitory populations. Then, we performed two photon calcium imaging, immunostaining, and reconstruction to define the GABAergic subtype of inhibitory neurons within a mixed population of excitatory and inhibitory neurons (Figure 3A).
Figure 3. Inhibitory neurons participate in orientation-specific networks.

A) Example of colabeled excitatory and inhibitory neurons labeled with GCaMP6f; arrows indicate GAD+ neurons; scale bar 20 μm; B) example of a seed neuron (grey) surrounded by a functionally homogeneous (top) or heterogeneous (bottom) local excitatory population (triangles pseudocolored by orientation preference); C) Orientation preference prediction error is significantly greater for both excitatory and inhibitory neurons in low homogeneity index (HI) regions than in high HI regions; D) Orientation selectivity does not vary as a function of HI; E) Noise correlations are distance dependent for all subtypes; F and G) Noise correlations are orientation-dependent for both local (<500 μm) (F) and long (>500 μm) (G) distances; H) Noise correlations are orientation-dependent in regions with low functional homogeneity. Error bars are mean ± SEM.
The local non-specific pooling principle that has been articulated for mouse cortex states that the orientation preference of inhibitory neurons reflects the biases that are present in the local excitatory population. To test this, we quantified the functional homogeneity of the excitatory neurons within a local population, by computing a homogeneity index (HI) based on the responses of tuned excitatory neurons within 100 microns (similar to (Nauhaus et al., 2008) see Methods), which ranges from zero to one, where a value of zero represents uniform sampling in orientation space, and a value of one represents perfect co-tuning of the local cells. As such, lower HI values correspond to areas of the cortex where orientation preference is changing rapidly in space (pinwheel centers and fractures) and higher HI values correspond to areas of cortex where orientation preference is changing slowly (iso-orientation domains).
If inhibitory neurons act as local integrators, then their orientation preference should be predictable from the tuning of the local excitatory population (Kerlin et al., 2010; Scholl et al., 2015). However, we find that the prediction error (see Methods) in both homogeneous and heterogeneous regions of the cortex did not differ between excitatory and inhibitory cells (high HI: WRS, p = .49, prediction error: inhibitory: 25.9±5.0°, n = 32; excitatory: 27.0 ± 1.5°, n = 283; low HI: WRS, p = .89, prediction error: inhibitory: 37.5±5.7°, n = 32; excitatory: 37.2±2.0°, n = 204, Figure 3C), suggesting that inhibitory neurons use similar integrative strategies as excitatory neurons to derive their orientation preference, regardless of the functional homogeneity in their local environment.
In animals that exhibit columnar maps, the local non-specific pooling principle makes an additional strong prediction: the orientation selectivity of inhibitory neurons should systematically decrease in regions of the orientation preference map with functionally heterogeneous populations of excitatory neurons: i.e. pinwheel centers and orientation fractures. In our sample, we found that in both excitatory and inhibitory cell types, the homogeneity of the local excitatory population accounted for only a small fraction of the variance in the orientation selectivity of single neurons (Spearman’s r = .038, p = .83, n = 35 for GAD+; r = .032 p = .86, n = 30 for SOM+; r = .17, p = .56, n = 14 for PV+; r = .15, p <.001, n = 607 for EXC, Figure 3D). Similar results were found when we analyzed tuning width as a function of HI (Spearman’s r = −.26, p = .14, n = 35 for GAD; r = −.24, p = .20, n = 30 for SOM; r = .22, p=.45, n = 14 for PV; r = .10, p = .01, n = 607 for EXC). For excitatory neurons, this finding is consistent with previous results (Maldonado et al., 1997; Ohki et al., 2006; Wilson et al., 2016). The absence of a strong relationship between the functional homogeneity of the local excitatory population and the orientation selectivity of single neurons is inconsistent with the local nonspecific pooling principle for inhibitory neurons.
The evidence presented thus far might be viewed as ‘negative evidence’—a failure to find indications that inhibitory neurons sample non-specifically from neighboring neurons. Another approach to understanding the rules of connectivity governing inhibitory neurons is to ask whether inhibitory neurons engage in functionally-specific networks with co-tuned excitatory cells. To address this, we examined pairwise noise correlations with excitatory neurons, which report shared variability in neuronal activity (Abbott and Dayan, 1999; Bair et al., 2001; Ecker et al., 2010) and are thought to reflect shared patterns of network connectivity (Ko et al., 2011). We find that noise correlations of inhibitory – excitatory neuron pairs decay in a distance-dependent manner, regardless of the subtype tested, consistent with previous results for excitatory neurons alone(Smith et al., 2015a) (Figure 3E, p<.001 for all subtypes, Table 1).
Table 1.
Statistical values for comparisons in Figure 3E–H
| Distance dependence | Local (<500 μm) orientation dependence | Long range (>500 μm) orientation dependence | Low HI Regions | |
|---|---|---|---|---|
| GAD-EXC | KW, P<.001, n = 3727 | KW, P<.001, n =2146 | KW, P<.001, n = 1581 | KW, P<.001, n = 2114 |
| SOM-EXC | KW, P<.001, n = 2771 | KW, P<.001, n = 1634 | KW, P<.001, n = 1137 | KW, P<.001, n = 1571 |
| PV-EXC | KW, P<.001, n = 2232 | KW, P<.001, n = 1099 | KW, P<.001, n = 1133 | KW, P=.0021, n = 1224 |
| EXC-EXC | KW, P<.001, n = 88728 | KW, P < .001, n = 54309 | KW, P < .001, n = 34419 | KW, P < .001, n = 40479 |
In addition, for both local (<500μm) and long-range (>500μm) pairs of neurons, inhibitory neurons (like excitatory neurons) exhibited elevated noise correlations with co-tuned excitatory neurons (Figure 3F–G, Kruskal Wallis, p<.001, Table 1). Notably, significantly tuned noise correlations were found for excitatory – inhibitory cell pairs even in regions of the cortex with heterogeneous orientation preferences (Figure 3H, p < .001 for GAD+ and EXC, SOM+ and EXC, EXC and EXC; p = .0021 for PV+ and EXC, Table 1), providing evidence that inhibitory cells participate in orientation-specific local and long-range networks, regardless of their local neighborhood.
Discussion
Our results demonstrate robust orientation and direction selectivity in the responses of inhibitory interneurons to drifting gratings. Instead of pooling activity from local excitatory neurons, we find that inhibitory neurons participate in functionally specific networks with co-tuned excitatory neurons at both local and long-range interaction distances. These results stand in contrast to findings from similar experiments in the mouse visual cortex, where multiple lines of evidence suggest that inhibitory neurons non-specifically pool activity from local excitatory neurons (Hofer et al., 2011; Kerlin et al., 2010; Scholl et al., 2015). It is clear that some features of cortical circuitry, such as the tendency for excitatory neurons to preferentially connect with co-tuned excitatory neurons, are conserved across a broad range of species, including ferrets (Wilson et al., 2016), mice (Chen et al., 2013; Ko et al., 2011; Lee et al., 2016), tree shrews (Bosking et al., 1997), cats (Gilbert and Wiesel, 1989), and primates (Malach et al., 1993). However, our findings emphasize the potential for fundamental differences in cortical circuit architecture across species and challenge the assumption that principles of cortical circuit organization deduced in one species will generalize to other mammalian lineages.
In addition, our results suggest that there are differences in selectivity across interneuron subtypes, with SOM+ interneurons exhibiting significantly less orientation-selectivity than excitatory neurons or other subtypes of inhibitory neurons. Inhibitory neurons also tended to be less direction-selective than excitatory neurons, perhaps owing to differences in the transduction of membrane potential to spikes in excitatory versus inhibitory neurons (Cardin et al., 2007). However, these differences should be interpreted with care, given the possibility that there could be cell type-specific differences in the relation of spike counts to relative changes in fluorescence.
It is also important to acknowledge that our observations are limited to a sample of neurons immunoreactive for GABAergic markers in the superficial layers of the cortex. It is possible that subtypes of GABAergic neurons in deeper layers may exhibit local nonspecific patterns of connectivity like that which has been described in the mouse. Indeed, previous studies have demonstrated smooth dendritic neurons in layer 4 of the cat that are poorly tuned for orientation (Hirsch et al., 2003), but the synaptic architecture that is responsible for the untuned responses of these neurons remains unclear. It is also possible that there are other subtypes of GABAergic neurons within our layer 2/3 sample that are not well labeled by immunocytochemical markers and have different response properties and connectivity rules.
Indeed, the results presented here should not be taken to imply a single rule of functional connectivity that applies to all classes of GABAergic neurons in ferret visual cortex. Rather, these results emphasize a functionally specific network organization for GABAergic neurons that has not been observed in the mouse cortex. Given the known diversity of GABAergic cortical neurons, it would not be surprising to find that different classes of GABAergic neurons are defined not only by their synaptic specializations (soma, dendrite, axon initial segment), and peptide expression, but also by the functional specificity of their network affiliations. The increasing availability of genetic tools for non-murine mammals is opening the door to a new era in circuit analysis that will make it possible to probe the rules of functional connectivity for different classes of GABAergic neurons in different species, building a data set that will make it possible to define common principles of cortical organization and the modifications that have emerged through the course of evolution.
STAR Methods
CONTACT FOR REAGENT AND RESOURCE SHARING
Further information and requests for resources and reagents should be directed to and will be fulfilled by the Lead Contact David Fitzpatrick (david.fitzpatrick@mpfi.org).
EXPERIMENTAL MODEL AND SUBJECT DETAILS
Ferrets
All procedures were approved by the Max Planck Florida Institute for Neuroscience Institutional Animal Care and Use Committee and adhered to the standards of the National Institutes of Health. Female ferrets (Mustela putorius furo, Marshall Farms) with normal immune status were used in these experiments and animals were housed in a 16h light/8h dark cycle. No a priori sample size estimation was performed but sample sizes are similar to other studies which performed in vivo physiology followed by immunohistochemistry ex vivo. Ferrets were not involved in previous studies and were drug- and test- naïve.
METHOD DETAILS
Virus Injection
Viral injection procedures have been previously described in detail (Smith and Fitzpatrick, 2016).
Briefly, 7 female ferrets aged P27 to P29 were anesthetized with ketamine (50 mg/kg) and isoflurane (1–3%, delivered in O2), then intubated and artificially respirated. Atropine was administered to reduce secretions and a 1:1 mixture of lidocaine and bupivacaine administered subcutaneously in the scalp. Animals were placed on a feedback-controlled heating pad to maintain internal temperature at 37°C. Under sterile surgical conditions, a small craniotomy (0.8 mm diameter) was made over the visual cortex 7–8mm lateral and 2mm anterior to lambda. AAV (either AAV1.Syn.GCaMP6f, 2.54*1013 GC ml−1 Penn Vector Core or AAV1.mDlx.GCaMP6f, ~1*1013 GC ml−1, Fishell lab) was injected to express GCaMP6f in populations of neurons. Beveled glass micropipettes (15–20 μm outer diameter, Drummond Scientific Company) were lowered into the brain and ~500 nl of virus was injected over 5 minutes at 400 and 200 μm below the pia. To prevent dural regrowth and adhesion, the craniotomy was filled with 1% w/v agarose (Type IIIa, Sigma-Aldrich).
Cranial Window
After ~3 weeks of expression, ferrets were anesthetized with 50mg/kg ketamine and 1–3% isoflurane. Atropine and bupivacaine were administered as in virus injection procedure. Animals were placed on a feedback-controlled heating pad to maintain an internal temperature of 37 to 38 °C. A tracheotomy was performed and an endotracheal tube installed to artificially respirate the animal. Isoflurane was delivered between 1 and 2% throughout the surgical procedure to maintain a surgical plane of anesthesia. An intravenous cannula was placed to deliver fluids. ECG, end tidal CO2, external temperature, and internal temperature were continuously monitored during the procedure and subsequent imaging session.
The scalp was retracted and a custom titanium headplate adhered to the skull using C&B Metabond (Parkell). A 6 to 7 mm craniotomy was performed at the viral injection site and the dura retracted to reveal the cortex. One 5mm cover glass (round, #1.5 thickness, Electron Microscopy Sciences) was adhered to the bottom of a custom titanium insert and placed onto the brain to gently compress the underlying cortex and dampen biological motion during imaging. The cranial window was hermetically sealed using a stainless steel retaining ring (5/16-inch internal retaining ring, McMaster-Carr), Kwik-Cast (World Precision Instruments), and Vetbond (3M). A 1:1 mixture of 1% tropicamide ophthalmic solution (Akorn) and 10% phenylephrine hydrochloride ophthalmic solution (Akorn) was applied to both eyes to dilate the pupils and retract the nictating membranes. Eyes were lubricated hourly with silicon oil AP 150 Wacker (Sigma-Aldrich). Upon completion of the surgical procedure, isoflurane was gradually reduced (0.6 to 1.0%) and then vecuronium (2 mg kg−1 hr−1) or pancuronium (2 mg kg−1 hr−1) was delivered IV to immobilize the animal.
Two photon imaging
The animal was placed under the microscope 25 cm from the stimulus monitor. Imaging was performed using a Thorlabs B-Scope2 running Scanimage (Pologruto et al., 2003) 4.2 or 2015 (Vidrio Technologies) with dispersion-compensated 940-nm excitation provided by a Mai Tai DeepSee HP (Spectraphysics). Average excitation power after the objective (16×, CFI75, Nikon Instruments) ranged from 40 to 100 mW. Imaging fields of view were selected based on the lack of large blood vessels and GCaMP expression. We measured orientation and direction selectivity by presenting 10 trials of 16 unidirectional drifting gratings (100% contrast, .1 cpd, 4 cycles/second, 3 second stimulus period plus 3 second ISI, plus a blank). Stimuli were generated using Psychopy (Peirce, 2007). Imaging fields of view spanned ~1100 microns on a side with 512×512 pixel resolution. Coarse field of view positions were marked on a blood vessel map using the surface vasculature. Imaging volumes ranged from 2 to 6 planes acquired serially at 30 μm spacing.
Fixation and immunostaining
Upon completion of imaging, isoflurane was raised to 5% and 0.5 ml Euthasol given IV. The animal was transcardially perfused with 100 ml of 0.9% NaCl (w/v) and then 500 ml of 4% paraformaldehyde in 0.1 M phosphate buffer (PB). The brain was removed and placed in 4% PFA overnight, after which it was cryoprotected in 30% sucrose in .1M PB until sinking. A freezing sliding microtome was used to cut tangential or parasagittal sections (50 μm thick) after embedding the injected hemisphere using OCT compound (Tissue Tek). Tangential sections were cut parallel to the in vivo cranial window surface to aid in post hoc identification of neurons previously imaged in vivo. Slices were rinsed once in PB and incubated in blocking buffer (0.5% donkey albumin serum (Jackson ImmunoResearch, Cat # 017-000-121, 0.3% triton X-100 in 0.1M PB). After washing three times in PB, slices were incubated for 24h in blocking buffer containing primary antibodies (Goat anti-parvalbumin at 1:2500, Swant PVG-214; Rat anti- somatostatin at 1:250, Millipore MAB 354; Mouse anti- GAD67 at 1:1000, Millipore MAB5406). Slices were washed three times using PBS, then mounted to a slide using SlowFade Gold (Thermofisher Scientific). After washing three times in PBS, slices were incubated for 24h in blocking buffer containing 1:500 secondary antibodies (Alexa 647 donkey anti-mouse, Molecular Probes, A31571; Alexa 568 donkey anti-rat, Abcam AB175475; Alexa 405 donkey anti-goat, Abcam AB175665). Slices were washed three times using PBS, then mounted to a slide using SlowFade Gold (Thermofisher Scientific). A coverslip was semipermanently placed on the slice for imaging.
Confocal imaging
Confocal images were acquired on a Leica SP2 resonant scanning microscope. Images were acquired using a Leica HC PL APO 20×/0.75 NA objective lens using 405, 488, 561, and 633 nm laser lines with emission channels optimized for each fluorophore (Alexa 405, GCaMP6f, Alexa 568, and Alexa 647) while minimizing cross-talk between channels. Images were acquired at 256×256 or 512×512 with spatial resolution ranging from .35 to .5 μm per pixel. Z-stacks were acquired using 2μm steps and the confocal pinhole was set to 1.6 AU. Tile scans were stitched using custom software (StackStitcher, see Software). These imaging conditions allowed for fast imaging of large areas with subcellular resolution while minimizing photobleaching. Confocal z-stacks were aligned to in vivo FOV’s using an affine transform applied in ImageJ. Colocalization was performed manually and blind to a cell’s functional properties.
Analysis
All experiments were performed in at least two ferrets. No randomization or stratification strategy was used. Analysis of neuronal response properties was performed without knowledge of GABAergic subtype (for AAV.mDlx.GCaMP6f alone experiments) or without knowledge of GABAergic subtype and excitatory/inhibitory classification (for experiments with both AAV.mDlx.GCaMP6f and AAV.Syn.GCaMP6f). Identification of neurons imaged in vivo in confocal sections and classification of immunostaining was performed blind to in vivo response properties. No sample size estimation was performed prior to the study. Data was included in the study based on the combined quality of in vivo imaging, immunostaining, and ability to identify post hoc neurons that were imaged in vivo. Analysis was performed using standard MATLAB functions.
2p images were corrected for in plane motion via a 2D cross correlation-based approach in Matlab. ROIs were drawn using custom software (Cell Magic Wand, see Software) in ImageJ. Mean pixel values across the time series were computed and imported into Matlab via MIJ (Sage, 2012). ΔF/F0 values were computed using a 60s median filter to define F0. Single neurons were defined as responsive if the mean ΔF/F0 value at the preferred direction exceeded 8%, were defined as orientation selective if 1) they were visually responsive and 2) 1-CV exceeded 0.1, and were defined as direction selective if 1) they were visually responsive, 2) 1-CV exceeded 0.1, and 3) DSI exceeded 0.3. 1 - Circular variance was computed as
where θk is the orientation of a visual stimulus and R(θk) is the response to that stimulus. DSI was computed as
Where μpref is the mean response to the preferred direction and μnull is the mean response to the null direction. Orientation and direction preference were computed as the peak location for a circular Gaussian fit or the sum of two circular Gaussian fits whose peaks were constrained to be 180° apart. When comparing fractions of selective or responsive neurons across imaging planes, we only included planes with more than five cells of each type.
To examine the degree of to which orientation and direction preference were functionally mapped, we first computed the orientation and direction preference of single neurons by performing a Gaussian fit, then only included orientation-tuned, visually responsive cells (1-CV>.1) whose responses were well-defined by a Gaussian fit (R>.7). We then compared the mean difference in orientation preference between a neuron and cells that fell within annuli spaced at 50 μm increments. For this analysis, we collapsed across multiple planes in z (as shown in the “Volume projection” panels in Figures 2G,H and Supplementary Figure 2). To correct for global biases in the orientation or direction preference of individual volumes, we normalized each curve with an offset so that each within-volume shuffle had a mean of 45 degrees (or 90 degrees for direction). For comparison with shuffle, we computed a linear fit of the absolute value of mean difference in orientation (or direction) preference as a function of distance from a seed neuron. We generated confidence intervals for the slope of the shuffle by sampling with replacement from the shuffle distributions (bootstrapping), the defined a cell type as being significantly mapped by comparing the slope of the distance-Δ Orientation preference or distance-Δ Direction preference fit to the distribution of slopes generated by the shuffles.
For analysis comparing local excitatory population responses with responses of single inhibitory neurons, we summed the trial-averaged stimulus responses of all excitatory neurons within 100 μm of the seed neuron, then computed the local population orientation preference using a Gaussian fit and the orientation selectivity using 1-CV. Prediction error was defined as the difference in orientation preference between the founder cell and the preference of the local excitatory population. We excluded population responses from the predicted preference analysis when the 1-CV of their sum was below 0.1 or if there were fewer than three cells in the local neighborhood.
Homogeneity index (HI, similar to (Nauhaus et al., 2008)) was computed as:
Where n is the number of responsive excitatory neurons within 100 μm of the seed neuron and θ is the preference of the kth neuron in the sample. We classified homogeneous regions of the map as having an HI greater than the population median for all excitatory neurons in our sample (.436) and heterogeneous regions of the map as having an HI less than the median. We computed noise correlations by z-scoring time-averaged single trial responses within each condition, then computing pairwise correlation coefficients between each seed neuron and excitatory neurons. Analyses using homogeneity index and noise correlations were performed on visually responsive, orientation-tuned neurons whose tuning curves were well described by a Gaussian fit (R>.7). When analyzing noise correlations, we only considered pairs of neurons separated by more than 30 μm.
QUANTIFICATION AND STATISTICAL ANALYSIS
Two sided nonparametric tests or bootstrapping are used for statistical testing throughout the paper, and no testing was performed to check for normality or homogeneity of variance. Exact n and statistical tests are reported in the Results section, or in Table 1. Center and spread values are reported as mean ± SEM unless otherwise noted. Statistical analyses were performed in MATLAB and significance was defined as p<.05.
DATA AND SOFTWARE AVAILABILITY
Data are available from the lead author upon reasonable request.
Software
Cell Magic Wand: https://github.com/fitzlab/CellMagicWand
StackStitcher: https://github.com/fitzlab/StackStitcher
Supplementary Material
Acknowledgments
The authors wish to thank the GENIE project for GCaMP6f, Dominique Ouimet for surgical assistance, David Whitney, Ben Scholl, and other members of the Fitzpatrick lab for helpful discussions. This work was supported by grants from the National Institutes of Health: EY011488 (DF), EY024408 (DF), MH071679 (GF), NS08297 (GF), NS074972 (GF) as well as support from the Simons Foundation 270 (SFARI) (GF) and the Max Planck Florida Institute for Neuroscience (DF).
Footnotes
Publisher's Disclaimer: This is a PDF file of an unedited manuscript that has been accepted for publication. As a service to our customers we are providing this early version of the manuscript. The manuscript will undergo copyediting, typesetting, and review of the resulting proof before it is published in its final citable form. Please note that during the production process errors may be discovered which could affect the content, and all legal disclaimers that apply to the journal pertain.
Author Contributions:
D.E.W. and G.B.S. contributed equally to this study. D.E.W., G.B.S., and D.F. conceived the study. D.E.W. and G.B.S. performed experiments and analysis. A.L.J. performed sectioning and immunostaining. D.E.W., G.B.S., and A.L.J. performed reconstruction and colocalization. T.W. developed software for segmentation and reconstruction. J.D. and G.F. developed mDlx enhancer and made virus. D.E.W., G.B.S., and D.F. wrote the paper.
References
- Abbott LF, Dayan P. The effect of correlated variability on the accuracy of a population code. Neural computation. 1999;11:91–101. doi: 10.1162/089976699300016827. [DOI] [PubMed] [Google Scholar]
- Adesnik H, Bruns W, Taniguchi H, Huang ZJ, Scanziani M. A neural circuit for spatial summation in visual cortex. Nature. 2012;490:226–231. doi: 10.1038/nature11526. [DOI] [PMC free article] [PubMed] [Google Scholar]
- Atallah BV, Bruns W, Carandini M, Scanziani M. Parvalbumin-expressing interneurons linearly transform cortical responses to visual stimuli. Neuron. 2012;73:159–170. doi: 10.1016/j.neuron.2011.12.013. [DOI] [PMC free article] [PubMed] [Google Scholar]
- Azouz R, Gray CM, Nowak LG, McCormick DA. Physiological properties of inhibitory interneurons in cat striate cortex. Cereb Cortex. 1997;7:534–545. doi: 10.1093/cercor/7.6.534. [DOI] [PubMed] [Google Scholar]
- Bair W, Zohary E, Newsome WT. Correlated firing in macaque visual area MT: time scales and relationship to behavior. The Journal of neuroscience: the official journal of the Society for Neuroscience. 2001;21:1676–1697. doi: 10.1523/JNEUROSCI.21-05-01676.2001. [DOI] [PMC free article] [PubMed] [Google Scholar]
- Blasdel GG, Salama G. Voltage-sensitive dyes reveal a modular organization in monkey striate cortex. Nature. 1986;321:579–585. doi: 10.1038/321579a0. [DOI] [PubMed] [Google Scholar]
- Bock DD, Lee WC, Kerlin AM, Andermann ML, Hood G, Wetzel AW, Yurgenson S, Soucy ER, Kim HS, Reid RC. Network anatomy and in vivo physiology of visual cortical neurons. Nature. 2011;471:177–182. doi: 10.1038/nature09802. [DOI] [PMC free article] [PubMed] [Google Scholar]
- Bosking WH, Zhang Y, Schofield B, Fitzpatrick D. Orientation selectivity and the arrangement of horizontal connections in tree shrew striate cortex. The Journal of neuroscience: the official journal of the Society for Neuroscience. 1997;17:2112–2127. doi: 10.1523/JNEUROSCI.17-06-02112.1997. [DOI] [PMC free article] [PubMed] [Google Scholar]
- Cardin JA, Palmer LA, Contreras D. Stimulus feature selectivity in excitatory and inhibitory neurons in primary visual cortex. The Journal of neuroscience: the official journal of the Society for Neuroscience. 2007;27:10333–10344. doi: 10.1523/JNEUROSCI.1692-07.2007. [DOI] [PMC free article] [PubMed] [Google Scholar]
- Chen TW, Wardill TJ, Sun Y, Pulver SR, Renninger SL, Baohan A, Schreiter ER, Kerr RA, Orger MB, Jayaraman V, et al. Ultrasensitive fluorescent proteins for imaging neuronal activity. Nature. 2013;499:295–300. doi: 10.1038/nature12354. [DOI] [PMC free article] [PubMed] [Google Scholar]
- Dimidschstein J, Chen Q, Tremblay R, Rogers SL, Saldi GA, Guo L, Xu Q, Liu R, Lu C, Chu J, et al. A viral strategy for targeting and manipulating interneurons across vertebrate species. Nature neuroscience. 2016 doi: 10.1038/nn.4430. [DOI] [PMC free article] [PubMed] [Google Scholar]
- Ecker AS, Berens P, Keliris GA, Bethge M, Logothetis NK, Tolias AS. Decorrelated neuronal firing in cortical microcircuits. Science. 2010;327:584–587. doi: 10.1126/science.1179867. [DOI] [PubMed] [Google Scholar]
- Gilbert CD, Wiesel TN. Columnar specificity of intrinsic horizontal and corticocortical connections in cat visual cortex. The Journal of neuroscience: the official journal of the Society for Neuroscience. 1989;9:2432–2442. doi: 10.1523/JNEUROSCI.09-07-02432.1989. [DOI] [PMC free article] [PubMed] [Google Scholar]
- Grinvald A, Lieke E, Frostig RD, Gilbert CD, Wiesel TN. Functional architecture of cortex revealed by optical imaging of intrinsic signals. Nature. 1986;324:361–364. doi: 10.1038/324361a0. [DOI] [PubMed] [Google Scholar]
- Hirsch JA, Martinez LM, Pillai C, Alonso JM, Wang Q, Sommer FT. Functionally distinct inhibitory neurons at the first stage of visual cortical processing. Nature neuroscience. 2003;6:1300–1308. doi: 10.1038/nn1152. [DOI] [PubMed] [Google Scholar]
- Hofer SB, Ko H, Pichler B, Vogelstein J, Ros H, Zeng H, Lein E, Lesica NA, Mrsic-Flogel TD. Differential connectivity and response dynamics of excitatory and inhibitory neurons in visual cortex. Nature neuroscience. 2011;14:1045–1052. doi: 10.1038/nn.2876. [DOI] [PMC free article] [PubMed] [Google Scholar]
- Kameyama K, Sohya K, Ebina T, Fukuda A, Yanagawa Y, Tsumoto T. Difference in binocularity and ocular dominance plasticity between GABAergic and excitatory cortical neurons. The Journal of neuroscience: the official journal of the Society for Neuroscience. 2010;30:1551–1559. doi: 10.1523/JNEUROSCI.5025-09.2010. [DOI] [PMC free article] [PubMed] [Google Scholar]
- Kara P, Boyd JD. A micro-architecture for binocular disparity and ocular dominance in visual cortex. Nature. 2009;458:627–631. doi: 10.1038/nature07721. [DOI] [PMC free article] [PubMed] [Google Scholar]
- Keller AJ, Martin KA. Local Circuits for Contrast Normalization and Adaptation Investigated with Two-Photon Imaging in Cat Primary Visual Cortex. The Journal of neuroscience: the official journal of the Society for Neuroscience. 2015;35:10078–10087. doi: 10.1523/JNEUROSCI.0906-15.2015. [DOI] [PMC free article] [PubMed] [Google Scholar]
- Kerlin AM, Andermann ML, Berezovskii VK, Reid RC. Broadly tuned response properties of diverse inhibitory neuron subtypes in mouse visual cortex. Neuron. 2010;67:858–871. doi: 10.1016/j.neuron.2010.08.002. [DOI] [PMC free article] [PubMed] [Google Scholar]
- Ko H, Hofer SB, Pichler B, Buchanan KA, Sjostrom PJ, Mrsic-Flogel TD. Functional specificity of local synaptic connections in neocortical networks. Nature. 2011;473:87–91. doi: 10.1038/nature09880. [DOI] [PMC free article] [PubMed] [Google Scholar]
- Lee SH, Kwan AC, Zhang S, Phoumthipphavong V, Flannery JG, Masmanidis SC, Taniguchi H, Huang ZJ, Zhang F, Boyden ES, et al. Activation of specific interneurons improves V1 feature selectivity and visual perception. Nature. 2012;488:379–383. doi: 10.1038/nature11312. [DOI] [PMC free article] [PubMed] [Google Scholar]
- Lee WC, Bonin V, Reed M, Graham BJ, Hood G, Glattfelder K, Reid RC. Anatomy and function of an excitatory network in the visual cortex. Nature. 2016;532:370–374. doi: 10.1038/nature17192. [DOI] [PMC free article] [PubMed] [Google Scholar]
- Malach R, Amir Y, Harel M, Grinvald A. Relationship between intrinsic connections and functional architecture revealed by optical imaging and in vivo targeted biocytin injections in primate striate cortex. Proceedings of the National Academy of Sciences of the United States of America. 1993;90:10469–10473. doi: 10.1073/pnas.90.22.10469. [DOI] [PMC free article] [PubMed] [Google Scholar]
- Maldonado PE, Godecke I, Gray CM, Bonhoeffer T. Orientation selectivity in pinwheel centers in cat striate cortex. Science. 1997;276:1551–1555. doi: 10.1126/science.276.5318.1551. [DOI] [PubMed] [Google Scholar]
- Martin KA, Somogyi P, Whitteridge D. Physiological and morphological properties of identified basket cells in the cat’s visual cortex. Experimental brain research. 1983;50:193–200. doi: 10.1007/BF00239183. [DOI] [PubMed] [Google Scholar]
- Meyer HS, Egger R, Guest JM, Foerster R, Reissl S, Oberlaender M. Cellular organization of cortical barrel columns is whisker-specific. Proceedings of the National Academy of Sciences of the United States of America. 2013;110:19113–19118. doi: 10.1073/pnas.1312691110. [DOI] [PMC free article] [PubMed] [Google Scholar]
- Muller T, Stetter M, Hubener M, Sengpiel F, Bonhoeffer T, Godecke I, Chapman B, Lowel S, Obermayer K. An analysis of orientation and ocular dominance patterns in the visual cortex of cats and ferrets. Neural computation. 2000;12:2573–2595. doi: 10.1162/089976600300014854. [DOI] [PubMed] [Google Scholar]
- Nauhaus I, Benucci A, Carandini M, Ringach DL. Neuronal selectivity and local map structure in visual cortex. Neuron. 2008;57:673–679. doi: 10.1016/j.neuron.2008.01.020. [DOI] [PMC free article] [PubMed] [Google Scholar]
- Nauhaus I, Nielsen KJ, Disney AA, Callaway EM. Orthogonal micro-organization of orientation and spatial frequency in primate primary visual cortex. Nature neuroscience. 2012;15:1683–1690. doi: 10.1038/nn.3255. [DOI] [PMC free article] [PubMed] [Google Scholar]
- Ohki K, Chung S, Ch’ng YH, Kara P, Reid RC. Functional imaging with cellular resolution reveals precise micro-architecture in visual cortex. Nature. 2005;433:597–603. doi: 10.1038/nature03274. [DOI] [PubMed] [Google Scholar]
- Ohki K, Chung S, Kara P, Hubener M, Bonhoeffer T, Reid RC. Highly ordered arrangement of single neurons in orientation pinwheels. Nature. 2006;442:925–928. doi: 10.1038/nature05019. [DOI] [PubMed] [Google Scholar]
- Olsen SR, Bortone DS, Adesnik H, Scanziani M. Gain control by layer six in cortical circuits of vision. Nature. 2012;483:47–52. doi: 10.1038/nature10835. [DOI] [PMC free article] [PubMed] [Google Scholar]
- Packer AM, Yuste R. Dense, unspecific connectivity of neocortical parvalbumin-positive interneurons: a canonical microcircuit for inhibition? The Journal of neuroscience: the official journal of the Society for Neuroscience. 2011;31:13260–13271. doi: 10.1523/JNEUROSCI.3131-11.2011. [DOI] [PMC free article] [PubMed] [Google Scholar]
- Peirce JW. PsychoPy–Psychophysics software in Python. Journal of neuroscience methods. 2007;162:8–13. doi: 10.1016/j.jneumeth.2006.11.017. [DOI] [PMC free article] [PubMed] [Google Scholar]
- Pi HJ, Hangya B, Kvitsiani D, Sanders JI, Huang ZJ, Kepecs A. Cortical interneurons that specialize in disinhibitory control. Nature. 2013;503:521–524. doi: 10.1038/nature12676. [DOI] [PMC free article] [PubMed] [Google Scholar]
- Pologruto TA, Sabatini BL, Svoboda K. ScanImage: flexible software for operating laser scanning microscopes. Biomedical engineering online. 2003;2:13. doi: 10.1186/1475-925X-2-13. [DOI] [PMC free article] [PubMed] [Google Scholar]
- Ringach DL, Mineault PJ, Tring E, Olivas ND, Garcia-Junco-Clemente P, Trachtenberg JT. Spatial clustering of tuning in mouse primary visual cortex. Nature communications. 2016;7:12270. doi: 10.1038/ncomms12270. [DOI] [PMC free article] [PubMed] [Google Scholar]
- Runyan CA, Schummers J, Van Wart A, Kuhlman SJ, Wilson NR, Huang ZJ, Sur M. Response features of parvalbumin-expressing interneurons suggest precise roles for subtypes of inhibition in visual cortex. Neuron. 2010;67:847–857. doi: 10.1016/j.neuron.2010.08.006. [DOI] [PMC free article] [PubMed] [Google Scholar]
- Runyan CA, Sur M. Response selectivity is correlated to dendritic structure in parvalbumin-expressing inhibitory neurons in visual cortex. The Journal of neuroscience: the official journal of the Society for Neuroscience. 2013;33:11724–11733. doi: 10.1523/JNEUROSCI.2196-12.2013. [DOI] [PMC free article] [PubMed] [Google Scholar]
- Sage D, Prodanov D, Tinevez JY, Schindelin J. MIJ: Making Interoperability Between ImageJ and Matlab Possible. ImageJ User & Developer Conference (Luxembourg) 2012 [Google Scholar]
- Scholl B, Pattadkal JJ, Dilly GA, Priebe NJ, Zemelman BV. Local Integration Accounts for Weak Selectivity of Mouse Neocortical Parvalbumin Interneurons. Neuron. 2015;87:424–436. doi: 10.1016/j.neuron.2015.06.030. [DOI] [PMC free article] [PubMed] [Google Scholar]
- Smith GB, Fitzpatrick D. Viral Injection and Cranial Window Implantation for In Vivo Two-Photon Imaging. Methods Mol Biol. 2016;1474:171–185. doi: 10.1007/978-1-4939-6352-2_10. [DOI] [PubMed] [Google Scholar]
- Smith GB, Sederberg A, Elyada YM, Van Hooser SD, Kaschube M, Fitzpatrick D. The development of cortical circuits for motion discrimination. Nature neuroscience. 2015a;18:252–261. doi: 10.1038/nn.3921. [DOI] [PMC free article] [PubMed] [Google Scholar]
- Smith GB, Whitney DE, Fitzpatrick D. Modular Representation of Luminance Polarity in the Superficial Layers of Primary Visual Cortex. Neuron. 2015b;88:805–818. doi: 10.1016/j.neuron.2015.10.019. [DOI] [PMC free article] [PubMed] [Google Scholar]
- Taniguchi H, He M, Wu P, Kim S, Paik R, Sugino K, Kvitsiani D, Fu Y, Lu J, Lin Y, et al. A resource of Cre driver lines for genetic targeting of GABAergic neurons in cerebral cortex. Neuron. 2011;71:995–1013. doi: 10.1016/j.neuron.2011.07.026. [DOI] [PMC free article] [PubMed] [Google Scholar]
- Wilson DE, Whitney DE, Scholl B, Fitzpatrick D. Orientation selectivity and the functional clustering of synaptic inputs in primary visual cortex. Nature neuroscience. 2016;19:1003–1009. doi: 10.1038/nn.4323. [DOI] [PMC free article] [PubMed] [Google Scholar]
- Wilson NR, Runyan CA, Wang FL, Sur M. Division and subtraction by distinct cortical inhibitory networks in vivo. Nature. 2012;488:343–348. doi: 10.1038/nature11347. [DOI] [PMC free article] [PubMed] [Google Scholar]
Associated Data
This section collects any data citations, data availability statements, or supplementary materials included in this article.