

Abstract
We studied the relative impact of donor source on outcomes following myeloablative hematopoietic stem cell transplantation (HSCT) for adult patients with acute lymphocytic leukemia (ALL). In this single center study, 138 patients aged 18–61 (median 31) years underwent myeloablative conditioning followed by allogeneic HSCT. Stem cell source was an HLA matched related donor (MRD) in 90, HLA matched unrelated donor (URD:M) in 15, HLA mismatched unrelated donor (URD:MM) in 14, and HLA 0–2 (A, B, DRB1) mismatched umbilical cord blood (UCB) in 19 patients. At the time of HSCT, 70 patients were in first clinical remission (CR1), 57 in CR2, and 11 in ≥CR3. Twenty-one patients had T-lineage disease; 43 patients (31%) had high-risk cytogenetics of either t(9;22) (n 5 33), t(4;11) or t(1,19) abnormalities, with the remainder (69%) having normal cytogenetics. White blood cell count (WBC) ≥30×109/L at diagnosis was documented in 33%. Demographics and disease characteristics were similar in all 4 groups except all UCB recipients were treated since 1996 and received growth factors. Overall survival (OS) at 3 years for the UCB group was 66% (95% confidence interval [CI] 44%–89%) compared to 27% (95% CI 17%–36%) in the MRD group, and only 13% (95% CI 0%–31%) and 14% (95% CI 0%–33%)in URD:Mand URD:MM groups, respectively. Similarly leukemia freesurvival (LFS) at 3 years was better in the UCB group at 61% (95% CI 38%–84%) than 27% (95% CI 18%–36%) in the MRD and only 13% (95% CI 0%–31%) in the URD:M group and 14% (95%CI 0%–33%) in URD:MM group. Relapse rates at 3 years were 5% (95% CI 0%–15%) in the UCB group compared to 26% (95% CI 16%–35%) in the MRD, 20% (95% CI 1%–39%) in the URD:M groups, and 0% in the URD:MM groups. Transplant-related mortality (TRM) at 3 years was the lowest in the UCB group at 34% and higher in the other donor groups: MRD 47%, URD:M 67%, and URD:MM 86%. In multiple regression analysis, 5 independent risk factors were significantly associated with poorer OS and LFS: use of URD:MM (relative risk [RR] 2.5, 95% CI, 1.2–5.1, P = .01), ≥CR3 at HSCT (RR 3.5, 95% CI, 1.2–9.6, P =.02), WBC ≥30 109/l (RR 1.9, 95% CI, 1.2–3.0, P =.01) at diagnosis, recipient and donor (R/D) cytomegalovirus (CMV) seropositive (RR 3.8, 95% CI, 2.0–7.4, P<.01), and ≥2 induction regimens to achieve initial CR (RR 3.5, 95% CI, 1.2–9.6, P =.02). Graft-versus-host disease (GVHD) was associated with improved LFS (RR 0.4, 95% CI, 0.2–0.6, P<.01). When compared with URD:M, OS with UCB was better (RR 0.3, 95% CI, 0.1–0.7, P =.01), supporting the use of UCB as an alternative stem cell source for adults with ALL.
Keywords: Acute lymphocytic leukemia, Allogeneic transportation, cord blood
INTRODUCTION
Overall survival (OS) at 5 years in adult acute lymphocytic leukemia (ALL) with various standard treatments has been recently demonstrated to be 39% [1]. The same study showed the superiority of hematopoietic stem cell transplantation (HSCT) in standard risk ALL, and that high-risk patients seemed to benefit less from this approach because of a higher nonrelapse mortality rate. High risk features included age older than 35 years, white blood cell (WBC) count ≥30×109/L (T lineage) and ≥100×109/L (B line-age), and presence of the Philadelphia chromosome [1].
An HLA matched related donor (MRD) is available to only 30% of patients. Umbilical cord blood (UCB) has emerged as an attractive alternative when an MRD is not available because of the rapidity of procurement and the ability to use HLA mismatched units with a low incidence and severity of graft-versus-host disease (GVHD) [2–6]. At our institute, the median time to obtain an UCB graft is 13.5 days compared to 50 days for an unrelated donor (URD) graft [7]. UCB has been used successfully in children, but in adults the main hurdles have been graft failure and delayed engraftment. As techniques to optimally select cord blood units to overcome these problems emerge, the use of UCB transplants in adults has been increasing [8–12]. Here we report our experience in adult ALL patients undergoing myeloablative HSCT and assess the relative impact of donor source on outcomes.
PATIENTS AND METHODS
Patient Characteristics
One hundred thirty-eight consecutive adult patients with ALL underwent myeloablative allogeneic HSCT at the University of Minnesota between July 1979 and May 2005. Baseline demographic data, disease characteristics, transplant variables, and outcomes data were obtained from the University of Minnesota Blood and Marrow Transplant database that contains prospectively collected data on all patients transplanted at our institution. This was supplemented by individual chart reviews. Treatment protocols were approved by the local institutional review board, and all patients gave written informed consent prior to transplant. The 4 donor groups examined were MRD, matched unrelated donor (URD:M), mismatched unrelated donor (URD:MM) and UCB. HLA compatibility was determined by either serotyping or high-resolution molecular typing for HLA-A, -B, -C, and -DRB1, depending upon available methods at the time of transplantation. All patients receiving adult donor grafts before 2003 were HLA matched at -A, -B, and -DRB1 using serologic techniques. Starting in 2003, all patients were typed using molecular techniques. Recipients of MRD and URD grafts were matched at HLA-A and -B at the antigen level and -DRB1 at the allele level between 2003 and 2004. After 2004, recipients of URD grafts were matched at HLA-A, -B, -C, and -DRB1 at the allele level. URD grafts were HLA matched at 5-6/6 loci until 2004 and 7-8/8 thereafter. UCB grafts were matched at least 4 of 6 HLA-A, -B (antigen level), and -DRB1 (allele level) to the recipient and in patients receiving 2 UCB units to each other. Among the 19 UCB recipients, 11 had a 4/6 match and the rest were 5/6 match. In the URD:MM group all 14 were a 5/6 match.
Disease status was assessed immediately prior to transplantation and then at day 28 and 100. Patients were subsequently evaluated at least every 3 months in the first year, every 6 months in the second year and yearly thereafter.
Eligibility Criteria
Patients were eligible for transplant if they had high-risk features in first complete remission (CR1) or were in ≥CR2. High-risk features were defined as: a non-T cell phenotype, abnormal cytogenetics of t(9,22), t(4,11), or t(1,19), WBC at diagnosis ≥30×109/L, extramedullary leukemia, or age ≥35 years.
To be eligible for a myeloablative MRD transplant, patients had to be ≤55 years of age and for an URD transplant ≤45 years of age. All patients had to have an Eastern Cooperative Oncology Group (ECOG) performance status of 0–2 and no major organ dysfunction. Exclusion criteria included hepatic or renal insufficiency, active ischemic heart disease, or left ventricular ejection function <45%, significant obstructive airway disease or diffusion capacity <50% of predicted, and active infections including human immunodeficiency virus.
Selection criteria for our UCB grafts have been previously published [13–15]. UCB recipients received either single unit or double UCB grafts (2 units administered sequentially) to optimize cell dose. Cord blood is considered negative for cytomegalovirus (CMV).
Treatment Plan
The pretransplant conditioning regimen consisted of cyclophosphamide (60 mg/kg intravenously, days −7 and −6), followed by total body irradiation (TBI) (165 cGy twice daily on days −4, −3, −2, −1) in the majority of patients in the MRD group. For the UCB group the conditioning regimen consisted of Cy/Flu/TBI (cyclophosphamide—60 mg/kg intravenously on days −7, −6_; fludarabine (25 mg/m2 intravenously on days −8, −7, −6); TBI (165 cGy twice daily days −4, −3, −2, −1) in 16 patients (84%) and Cy/TBI in 3 (16%). All URD:M and URD:MM recipients received TBI plus chemotherapy based conditioning. After 1992 all patients (n = 79, 57%) received granulocyte-colony stimulating factor (G-CSF) support from day 0 until the absolute neutrophil count (ANC) was ≥2.5×10⁹/L for 2 consecutive days. Transfusion support was provided with irradiated blood products. All patients received prophylactic antimicrobials directed towards bacterial, viral, and fungal pathogens. Systemic antifungals were given empirically for persistent unexplained fevers. GVHD prophylaxis is as shown in Table 1. Cyclosporine (CSA) and mycophenolate mofetil (MMF) ± antithymocyte globulin (ATG) was used as GVHD prophylaxis for all UCB recipients. The dose of ATG was 15 mg/kg intravenously every 12 hours for 6 doses from days −3 to −1.
Table 1.
Patient, Disease, and Transplantation Characteristics
| Characteristic | MRDn = 90 (%) | UCBn =19 (%) | URD:Mn = 15 (%) | URD:MMn = 14 (%) | P |
|---|---|---|---|---|---|
| Age (years) | 1.0 | ||||
| <35 | 56 (62) | 12 (63) | 9 (60) | 9 (64) | |
| ≥35 | 34 (38) | 7 (37) | 6 (40) | 5 (36) | |
| Median (range) | 30 (18–60) | 30 (18–45) | 32 (20–48) | 31 (18–48) | |
| Gender | .35 | ||||
| Male | 42 (47) | 12 (63) | 10 (67) | 7 (50) | |
| ALL | .28 | ||||
| T cell | 17 (19) | 2 (10) | 2 (13) | 0 | |
| Non-T cell | 73 (81) | 17 (90) | 13 (87) | 14 (100) | |
| WBC at diagnosis | .11 | ||||
| Unknown | 12 (13) | 5 (26) | 1 (7) | 1 (7) | |
| < 30×109/L | 52 (58) | 9 (47) | 8 (53) | 4 (29) | |
| ≥ 30×109/L | 26 (29) | 5 (26) | 6 (40) | 9 (64) | |
| High-risk cytogenetics* | 23 (26) | 6 (32) | 7 (47) | 7 (50) | .15 |
| CNS involvement | 13 (14) | 1 (5) | 2 (13) | 2 (14) | .76 |
| No. of induction regimens to achieve CR1 | .60 | ||||
| 1 | 82 (91) | 17 (89) | 15 (100) | 12 (86) | |
| 2+ | 8 (9) | 2 (10) | 0 | 2 (14) | |
| Disease at HSCT | .27 | ||||
| CR1 | 48 (53) | 6 (32) | 7 (47) | 9 (64) | |
| CR2 | 37 (41) | 11 (58) | 5 (33) | 4 (29) | |
| ≥CR3 | 5 (6) | 2 (10) | 3 (20) | 1 (7) | |
| Length of CR1 for patients in CR2 at HSCT (months) | .03 | ||||
| median | 22 | 42 | 15 | 33 | |
| Time from diagnosis to HSCT (months) | .07 | ||||
| Median (range) | 7.4 (2–184) | 36 (3–123) | 10 (3–236) | 8.4 (5–58) | |
| Year of HSCT | <.01 | ||||
| ≥1996 | 31 (34) | 19 (100) | 7 (47) | 7 (50) | |
| Conditioning regimen | <.01 | ||||
| Cy/TBI | 76 (84) | 3 (16) | 0 | 0 | |
| Cy/Flu/TBI | 0 | 16 (84) | 0 | 0 | |
| Cy/Bu | 2 (2) | 0 | 0 | 0 | |
| TBI + cytarabine | 6 (7) | 0 | 0 | 0 | |
| TBI + multiple chemo | 6 (7) | 0 | 15 (100) | 14 (100) | |
| GVHD prophylaxis | <.01 | ||||
| MTX/CSA | 40 (45) | 0 | 10 (67) | 10 (71) | |
| CSA/MMF ± ATG | 0 | 19 (100) | 0 | 0 | |
| T cell depletion | 22 (24) | 0 | 4 (27) | 3 (21) | |
| MTX/ATG | 28 (31) | 0 | 0 | 0 | |
| Unknown | 0 | 0 | 1 (6) | 1 (7) | |
| R/D CMV | <.01 | ||||
| Positive/positive | 30 (33) | 0 | 1 (7) | 3 (21) | |
| Positive/negative | 27 (30) | 9 (47) | 4 (26) | 3 (21) | |
| Negative/positive | 14 (16) | 0 | 1 (7) | 4 (29) | |
| Negative/negative | 18 (21) | 10 (53) | 9 (60) | 4 (29) |
ALL indicates acute lymphocytic leukemia; ATG, antithymocyte globulin; chemo, chemotherapies; CMV, cytomegalovirus; CNS, central nervous system; CR, complete remission; Cy, cyclophosphamide; CSA, cyclosporine; GVHD, graft-versus-host disease; HSCT, hematopoietic stem cell transplant; MMF, mycophenolate mofetil; MTX, methotrexate; MRD, matched related donor; TBI, total-body irradiation; R/D, recipient/donor; UCB, umbilical cord blood; URD:M, unrelated matched donor; URD:MM, unrelated mismatched donor; WBC, white blood cell count.
High-risk cytogenetics 5 t(9;22), t(4;11), or t (1;19).
Statistical Analysis
The primary endpoints for this analysis were OS and leukemia free survival (LFS). The secondary end-points were relapse and 3 year transplant-related mortality (TRM). LFS was calculated from the beginning of transplant until relapse or death. Patients were censored at the date of last follow-up when calculating OS and LFS. The statistical endpoints of OS and LFS were estimated by the Kaplan-Meier [16] method with 95% confidence intervals (CI) derived from standard errors. Comparison of event curves across various factors was completed by use of the log-rank test [16]. Cox regression analysis was used to examine the independent effect of prognostic factors on OS and LFS [17]. The cumulative incidences of relapse, TRM, and acute GVHD (aGVHD) were estimated by treating deaths as competing risks [18]. Patient and transplant characteristics were compared across donor type subgroups. Statistical comparison of continuous factors was performed by the Kruskal-Wallis test [19]. Differences in categoric factors were tested across subgroups by the use of the chi-square test or Fisher’s exact test [20].
Patient and disease-related variables considered were donor type, GVHD prophylaxis, remission status at transplant, age at transplant, gender mismatch, CMV serology, leukemia phenotype, cytogenetics, WBC at diagnosis, central nervous system (CNS) involvement at diagnosis, time from diagnosis to transplant, number of induction regimens prior to achieving CR, length of CR1 (for CR2 patients), year of transplant, and use of growth factor posttransplant.
RESULTS
Patient Characteristics
Patient, disease, and transplant characteristics across the 4 donor groups are shown in Table 1. The median follow-up time in years was MRD-9.3 (range: 1.2–25.1), URD:M-5.0 (range: 4.9–5.0), URD:MM-4.4 (range: 0.9–25.1). and UCB-2.0 (range: 0.9–5.7).
The source of all URD stem cells was bone marrow (BM); 80% of MRD grafts were BM and 20% peripheral blood stem cells (PBSC) (P = .10). There were no significant differences in recipient and donor gender mismatch in the 4 groups. The variables that were different across the groups were year of transplant after 1996, use of growth factor, T cell depletion, length of CR1, conditioning regimens, and recipient/donor (R/D) CMV seropositive status. For patients transplanted in ≥CR2 the median length of CR1 was the longest in the UCB group at 42 months. Posttransplant growth factor was received by 100% of the UCB group, 40 (44%) of the MRD, 12 (80%) of the URD:M, and 8 (57%) of the URD:MM groups (P < .01). None of the UCB recipients had a T cell-depleted graft. R/D CMV seropositivity was present in a third of the MRD groups and was less common in the URD:M and URD:MM groups.
Overall Survival
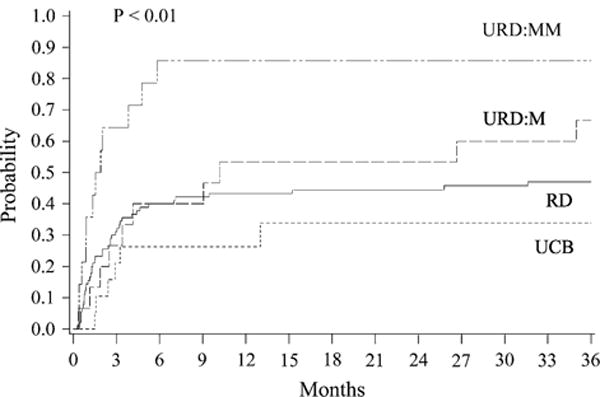
The OS at 3 years for all patients was 28% (95% CI, 20%–36%) and by donor groups was: MRD, 27% (95% CI, 17%–36%); URD:M, 13% (95% CI, 0%–31%); URD:MM, 14% (95% CI, 0%–33%); and UCB, 66% (95% CI, 44%–89%) (P < .01) (Figure 1). In multiple regression analysis, 5 risk factors were independently significantly associated with poorer OS (Table 2), including URD:MM, ≥CR3 at HSCT, WBC ≥30×109/L at diagnosis, R/D CMV seropositivity, and ≥ 2 induction regimens to achieve initial CR. There was no impact on OS by year of transplant, use of growth factor or grade II–IV aGVHD. For patients in CR1, the 3-year OS by donor group was: MRD, 26% (95% CI, 14%–39%); URD:M, 29% (95% CI, 0%–63%); URD:MM, 11% (95% CI, 0%–39%); and UCB, 63% (95% CI, 14%–89%) (P = .02). In a pairwise comparison of OS between UCB and URD:M, the outcome was better for UCB (RR 0.3, 95% CI, 0.1–0.7, P = .01). In a pairwise comparison of OS between UCB and MRD, there was a trend to better outcome with UCB, although it did not reach statistical significance (RR 0.4, 95% CI 0.1–1.2, P = .10).
Figure 1.

OS (A) and LFS (B) by donor source.
Table 2.
Cox Regression Analysis for OS and LFS
| Cox regression analysis for OS | ||
|---|---|---|
|
| ||
| Factor | Relative Risk (95% CI) | P |
| Group | ||
| MRD* | 1.0 | |
| UCB | 0.5 (0.2–1.3) | .14 |
| URD:M | 1.6 (0.7–3.3) | .23 |
| URD:MM | 2.5 (1.2–5.1) | .01 |
| Disease Status at HSCT | ||
| CR1 and CR2* | 1.0 | .02 |
| CR3+ | 3.5 (1.2–9.6) | |
| WBC at diagnosis | ||
| <30×109/L* | 1.0 | .01 |
| ≥30×109/L | 1.9 (1.2–3.0) | |
| R/D CMV serostatus | ||
| Negative/negative* | 1.0 | |
| Positive/negative | 1.0 (0.5–1.8) | .95 |
| Negative/positive | 1.2 (0.6–2.7) | .50 |
| Positive/positive | 3.8 (2.0–7.4) | <.01 |
| No. of induction regimens prior to CR | ||
| 1* | 1.0 | |
| ≥2 | 3.5 (1.2–9.6) | .02 |
| Grade II–IV GVHD | ||
| No* | 1.0 | |
| Yes (time dependent) | 0.7 (0.4–1.2) | .17 |
| Cox Regression Analysis—Relapse | ||
|---|---|---|
|
| ||
| Factor | Relative Risk (95% C.I.) | P |
| Group | ||
| RD* | 1.0 | |
| UCB | 0.3 (0.0–2.4) | .28 |
| Unrelated (HLA mm) | 0.0 (0.0–.) | NE |
| Unrelated (HLA match) | 2.3 (0.6–9.5) | .25 |
| R/D CMV serostatus | ||
| Negative/negative* | 1.0 | |
| Positive/negative | 0.7 (0.2–2.6) | .62 |
| Negative/positive | 2.7 (0.8–9.9) | .13 |
| Positive/positive | 8.4 (2.4–28.8) | <.01 |
| Number of induction regimens prior to CR | ||
| 1* | 1.0 | |
| 2+ | 6.6 (1.9–23.1) | <.01 |
| Grade II–IV acute GVHD | ||
| no* | 1.0 | |
| yes (time-dependent) | 0.6 (0.3–1.4) | .24 |
CMV indicates cytomegalovirus; CR, complete remission; OS, overall survival; LFS, leukemia-free survival; GVHD, graft-versus-host disease; MRD, matched related donor; R/D, recipient/donor; UCB, umbilical cord blood; URD:M, unrelated matched donor; URD:MM, unrelated mismatched donor; WBC, white blood cell count.
Reference group.
LFS
The overall 3-year LFS was 28% (95% CI, 21%–36%) and by donor groups was: MRD, 27% (95% CI, 18%–36%); URD:M, 13% (95% CI, 0%–31%); URD:MM, 14% (95% CI, 0%–33%); and UCB, 61% (95% CI, 38%–84%) (P < .01) (Figure 1). As with OS, URD:MM, ≥CR3, at HSCT, WBC ≥30×109/L, R/D CMV seropositivity, and ≥2 induction regimens to achieve CR were factors independently associated with poor LFS (Table 2). In addition, patients who developed grade II–IV aGVHD had an improved LFS. For patients in CR1 the LFS by donor group was: MRD, 26% (95% CI, 14%–38%); URD:M, 29% (95% CI, 4%–61%); URD:MM, 11% (95% CI, 0%–39%); and UCB, 44% (95% CI, 0%–88%) (P = .02). Pairwise comparison of LFS between UCB and URD:MM revealed that the UCB group had significantly better LFS (RR 0.2, 95% CI, 0.1–0.9, P = .03).
Relapse and TRM
The cumulative incidence of relapse at 3 years in the donor groups were: MRD, 26% (95% CI, 16%–35%); URD:M, 20% (95% CI, 1%–39%); URD:MM, 0%; and UCB, 5% (95% CI, 0%–15%) (P = .08) (Figure 2). Factors associated independently with higher risk of relapse were: R/D CMV seropositivity and ≥2 induction regimens to achieve CR (Table 3). The 3-year TRM in the donor groups were: MRD, 44% (95% CI, 34%–55%); URD:M, 53% (95% CI, 27%–80%); URD:MM, 86% (95% CI, 57%–100%); and UCB, 34% (95% CI, 12%–56%) (P < .01) (Figure 3). For patients in CR1 the 3-year relapse rate by donor group was: MRD, 27% (95% CI, 14%–40%); URD:M and URD:MM, 0 %; and UCB, 17% (95% CI, 0%–44%) (P = .27). The 1-year TRM among CR1 patients was: MRD, 40% (95% CI, 26%–56%); URD:M, 57% (95% CI, 20%–94%); URD:MM, 89% (95% CI, 56%–100%) (P < .01).
Figure 2.

Relapse by donor source.
Table 3.
Cox Regression Analysis—Relapse
| Factor | Relative Risk (95% C.I.) | P |
|---|---|---|
| Group | ||
| RD* | 1.0 | |
| UCB | 0.3 (0.0–2.4) | .28 |
| Unrelated (HLA mm) | 0.0 (0.0–.) | NE |
| Unrelated (HLA match) | 2.3 (0.6–9.5) | .25 |
| R/D CMV serostatus | ||
| Negative/negative* | 1.0 | |
| Positive/negative | 0.7 (0.2–2.6) | .62 |
| Negative/positive | 2.7 (0.8–9.9) | .13 |
| Positive/positive | 8.4 (2.4–28.8) | <.01 |
| Number of induction regimens prior to CR | ||
| 1* | 1.0 | |
| 2+ | 6.6 (1.9–23.1) | <.01 |
| Grade II–IV acute GVHD | ||
| no* | 1.0 | |
| yes (time-dependent) | 0.6 (0.3–1.4) | .24 |
CMV indicates cytomegalovirus; CR, complete remission; GVHD, graft-versus-host disease; R/D, matched related donor; UCB, umbilical cord blood.
Reference group.
Figure 3.
TRM by donor source.
The incidence of grade III–IV aGVHD in the 4 groups (95% CI) were: MRD, 20% (12%–28%); URD:M, 10% (0%–40%); URD:MM, 7% (0%–20%); and UCB-32% (11%–52%) (P = .64). Chronic GVHD (cGVHD) incidence at 1 year by donor groups (95% CI) were: MRD, 22% (13%–31%); URD:M, 47% (20%–74%); URD:MM, 21% (2%–40%); and UCB, 16% (0%–32%) (P = .01). The main causes of death by donor source were relapsed leukemia (MRD = 35%, URD:M = 23%, URD:MM and UCB = 0%), GVHD (MRD = 23%, URD:M = 46%, URD:MM = 50%, UCB = 75%), and infection (MRD = 30%, URD:M = 15%, URD:MM = 17%, UCB = 25%). The remainder of the patients in each group died of other causes.
DISCUSSION
It has been shown that MRD HSCT is the treatment of choice in standard risk ALL in CR1 [1]. It has also been demonstrated that outcomes after relapse are extremely poor, and therefore the emphasis should be on the most effective treatment being delivered upfront [21]. Because only about 30% of adults have an available MRD, we evaluated the safety and outcomes for unrelated donor sources. Our results demonstrated favorable outcomes with UCB compared with URD transplantation.
Our 3-year LFS for MRD transplants performed in CR1 was 26%, which is somewhat lower than reported by other groups. In the LALA-94 trial of 175 patients transplanted between 1994 and 2002 in CR1, the 3-year LFS in the MRD group ranged from 34% to 44% in the various high risk categories [22]. Kiehl et al. [23] reported a 42% 5-year LFS for 62 patients in CR1 transplanted between 1990 and 2002. In contrast, in the GOELAMS trial of 39 patients in CR1 transplanted between 1994 and 2002, the 6-year LFS was 75% [24]. Likewise, the Attal et al group reported that 43 patients in CR1 following the Berlin-Frankfurt-Muster (BFM) induction regimen had a 3-year LFS of 68% [25]. The differences in outcomes may be at least partially explained by variable patient and disease characteristics, induction regimens, and number of inductions to achieve CR1.
For the URD:M and MM groups our 3-year OS and LFS were lower than seen for a high-risk population in the UK ALL XII/ECOG 2993 study [26]. This was a small series of 33 high-risk adults transplanted with URD in CR1. The LFS was 56% with a TRM of 30%, and no deaths were seen after 15 months. A retrospective study by Weisdorf and colleagues [27] demonstrated a 5-year LFS of 44% in CR1 and 36% in CR2 with a TRM of 42% and 40%, respectively. In Philadelphia chromosome-positive ALL the 2-year LFS with URD reported in 18 patients was 49% [28]. Recently reported outcomes of URD HSCT in Philadelphia-negative patients in CR1 showed a 5-year TRM and OS of 42% and 39%, respectively [29]. In our series the TRM in the URD:M group was high at 53%, which could partially explain our lower LFS rates.
Our analysis included patients transplanted from 1979 to 2005. This prolonged period is a limitation of this study along with the low numbers of patients in the URD:M, URD:MM, and UCB groups. Seventy-four (53%) patients were transplanted prior to 1996, with most being high-risk patients and with all the UCB transplants occurring after that time. Overall, half of our patients were transplanted in ≥CR2. These factors may have contributed to the higher TRM seen in the non-UCB groups. The improvement in induction regimens, supportive care, management of CMV infections, use of growth factor, and better HLA match are factors that could account for the better results seen in the more recent studies. Some changes could be subtle and difficult to measure.
Our results demonstrated superior OS and LFS for UCB compared with URD:M transplants. In the study by Rocha et al. [30], the 2-year LFS was similar in the 2 groups: 34% for the UCB group and 33% for URD:M (P = .21), suggesting that UCB transplants had similar outcomes to matched unrelated transplants [30].
We also noticed an improved LFS with the development of grade II–IV aGVHD suggesting a possible graft-versus-leukemia effect across all donor sources. Chim et al. [31] analyzed the outcome of 108 patients with ALL undergoing transplantation and showed that among other factors, limited aGVHD resulted in a better LFS. In a 121 high-risk patient population the occurrence of aGVHD was 1 of 2 prognostic factors identified for relapse [32].
Our analysis suggests comparable results of UCB with other donor sources, and supports the continued exploration of UCB as an alternative stem cell source for adults with ALL undergoing transplantation. The observed and potent graft-versus-leukemia effect of UCB transplants and comparable outcomes need confirmation in large prospective trials, yet offer promise for adults with ALL.
Acknowledgments
Financial disclosure: The authors have nothing to disclose.
References
- 1.Goldstone AH, Richards SM, Lazarus HM, et al. In adults with standard-risk acute lymphoblastic leukemia, the greatest benefit is achieved from a matched sibling allogeneic transplantation in first complete remission, and an autologous transplantation is less effective than conventional consolidation/maintenance chemotherapy in all patients: final results of the International ALL Trial (MRC UKALL XII/ECOG E2993) Blood. 2008;111:1827–18331. doi: 10.1182/blood-2007-10-116582. [DOI] [PubMed] [Google Scholar]
- 2.Grewal SS, Barker JN, Davies SM, et al. Unrelated donor hematopoietic cell transplantation: marrow or umbilical cord blood? Blood. 2003;101:4233–4244. doi: 10.1182/blood-2002-08-2510. [DOI] [PubMed] [Google Scholar]
- 3.Rocha V, Wagner JE, Jr, Sobocinski KA, et al. Graft-versus-host disease in children who have received a cord-blood or bone marrow transplant from an HLA-identical sibling. Eurocord and International Bone Marrow Transplant Registry Working Committee on Alternative Donor and Stem Cell Sources. N Engl J Med. 2000;342:1846–1854. doi: 10.1056/NEJM200006223422501. [DOI] [PubMed] [Google Scholar]
- 4.Rocha V, Cornish J, Sievers EL, et al. Comparison of outcomes of unrelated bone marrow and umbilical cord blood transplants in children with acute leukemia. Blood. 2001;97:2962–2971. doi: 10.1182/blood.v97.10.2962. [DOI] [PubMed] [Google Scholar]
- 5.Barker JN, Davies SM, DeFor T, et al. Survival after transplantation of unrelated donor umbilical cord blood is comparable to that of human leukocyte antigen-matched unrelated donor bone marrow: results of a matched-pair analysis. Blood. 2001;97:2957–2961. doi: 10.1182/blood.v97.10.2957. [DOI] [PubMed] [Google Scholar]
- 6.Hamza NS, Lisgaris M, Yadavalli G, et al. Kinetics of myeloid and lymphocyte recovery and infectious complications after unrelated umbilical cord blood versus HLA-matched unrelated donor allogeneic transplantation in adults. Br J Haematol. 2004;124:488–498. doi: 10.1046/j.1365-2141.2003.04792.x. [DOI] [PubMed] [Google Scholar]
- 7.Barker J, Wagner JE. Umbilical cord blood versus marrow: The search process. Biol Blood Marrow Transplant. 2004;10:735. [Google Scholar]
- 8.Laughlin MJ, Barker J, Bambach B, et al. Hematopoietic engraftment and survival in adult recipients of umbilical-cord blood from unrelated donors. N Engl J Med. 2001;344:1815–1822. doi: 10.1056/NEJM200106143442402. [DOI] [PubMed] [Google Scholar]
- 9.Sanz GF, Saavedra S, Planelles D, et al. Standardized, unrelated donor cord blood transplantation in adults with hematologic malignancies. Blood. 2001;98:2332–2338. doi: 10.1182/blood.v98.8.2332. [DOI] [PubMed] [Google Scholar]
- 10.Ooi J, Iseki T, Takahashi S, et al. Unrelated cord blood transplantation for adult patients with advanced myelodysplastic syndrome. Blood. 2003;101:4711–4713. doi: 10.1182/blood-2002-12-3917. [DOI] [PubMed] [Google Scholar]
- 11.Gluckman E, Rocha V, Boyer-Chammard A, et al. Outcome of cord-blood transplantation from related and unrelated donors. Eurocord Transplant Group and the European Blood and Marrow Transplantation Group. N Engl J Med. 1997;337:373–381. doi: 10.1056/NEJM199708073370602. [DOI] [PubMed] [Google Scholar]
- 12.Rubinstein P, Carrier C, Scaradavou A, et al. Outcomes among 562 recipients of placental-blood transplants from unrelated donors. N Engl J Med. 1998;339:1565–1577. doi: 10.1056/NEJM199811263392201. [DOI] [PubMed] [Google Scholar]
- 13.Barker JN, Weisdorf DJ, DeFor TE, et al. Rapid and complete donor chimerism in adult recipients of unrelated donor umbilical cord blood transplantation after reduced-intensity conditioning. Blood. 2003;102:1915–1919. doi: 10.1182/blood-2002-11-3337. [DOI] [PubMed] [Google Scholar]
- 14.Brunstein CG, Barker JN, Weisdorf DJ, et al. Umbilical cord blood transplantation after nonmyeloablative conditioning: Impact on transplant outcomes in 110 adults with hematological disease. Blood. 2007;110:3064–3070. doi: 10.1182/blood-2007-04-067215. [DOI] [PMC free article] [PubMed] [Google Scholar]
- 15.Majhail NS, Brunstein CG, Wagner JE. Double umbilical cord blood transplantation. Curr Opin Immunol. 2006;18:571–575. doi: 10.1016/j.coi.2006.07.015. [DOI] [PubMed] [Google Scholar]
- 16.Kaplan EL, Meier P. Nonparametric estimation from incomplete observations. J Am Stat Assoc. 1958;53:457–481. [Google Scholar]
- 17.Cox DR. Regression models and life tables. J R Soc B. 1972;34:187–220. [Google Scholar]
- 18.Lin DY. Non-parametric inference for cumulative incidence functions in competing risks studies. Stat Med. 1997;16:901–910. doi: 10.1002/(sici)1097-0258(19970430)16:8<901::aid-sim543>3.0.co;2-m. [DOI] [PubMed] [Google Scholar]
- 19.Sheskin DJ. Handbook of Parametric and Nonparametric Statistical Procedures. London: Chapman & Hall; p. 2000. CRC. [Google Scholar]
- 20.Snedecor G, Cochran W. Statistical Methods. 8th. Ames, IA: Iowa State University Press; 1989. [Google Scholar]
- 21.Fielding AK, Richards SM, Chopra R, et al. Outcome of 609 adults after relapse of acute lymphoblastic leukemia (ALL); an MRC UKALL12/ECOG 2993 study. Blood. 2007;109:944–950. doi: 10.1182/blood-2006-05-018192. [DOI] [PubMed] [Google Scholar]
- 22.Thomas X, Boiron JM, Huguet F, et al. Outcome of treatment in adults with acute lymphoblastic leukemia: analysis of the LALA-94 trial. J Clin Oncol. 2004;22:4075–4086. doi: 10.1200/JCO.2004.10.050. [DOI] [PubMed] [Google Scholar]
- 23.Kiehl MG, Kraut L, Schwerdtfeger R, et al. Outcome of allogeneic hematopoietic stem-cell transplantation in adults patients with acute lymphoblastic leukemia: no difference in related compared with unrelated transplant in first complete remission. J Clin Oncol. 2004;22:2816–2825. doi: 10.1200/JCO.2004.07.130. [DOI] [PubMed] [Google Scholar]
- 24.Hunault M, Harousseau JL, Delain M, et al. Better outcome of adult acute lymphoblastic leukemia after early genoidentical allogeneic bone marrow transplantation (BMT) than after late high-dose therapy and autologous BMT: a GOELAMS trial. Blood. 2004;104:3028–3037. doi: 10.1182/blood-2003-10-3560. [DOI] [PubMed] [Google Scholar]
- 25.Attal M, Blaise D, Marit G, et al. Consolidation treatment of adult acute lymphoblastic leukemia: a prospective, randomized trial comparing allogeneic versus autologous bone marrow transplantation and testing the impact of recombinant interleukin-2 after autologous bone marrow transplantation. BGMT Group. Blood. 1995;86:1619–1628. [PubMed] [Google Scholar]
- 26.Goldstone AH, Lazarus HM, Richards SM, et al. The outcome of 551 1st CR transplants in adult ALL from the MRC UKALL XII/ECOG E2933 study. ASH Annual Meeting Abstracts. Blood. 2004;104:615. [Google Scholar]
- 27.Weisdorf D, Bishop M, Dharan B, et al. Autologous versus allogeneic unrelated donor transplantation for acute lymphoblastic leukemia: comparative toxicity and outcomes. Biol Blood Marrow Transplant. 2002;8:213–220. doi: 10.1053/bbmt.2002.v8.pm12014810. [DOI] [PubMed] [Google Scholar]
- 28.Sierra J, Radich J, Hansen JA, et al. Marrow transplants from unrelated donors for treatment of Philadelphia chromosome-positive acute lymphoblastic leukemia. Blood. 1997;90:1410–1414. [PubMed] [Google Scholar]
- 29.Marks DI, Perez WS, He W, et al. Unrelated donor transplants in adults with Philadelphia-negative acute lymphoblastic leukemia in first complete remission. Blood. 2008;112:426–434. doi: 10.1182/blood-2007-12-128918. [DOI] [PMC free article] [PubMed] [Google Scholar]
- 30.Rocha V, Labopin M, Sanz G, et al. Transplants of umbilicalcord blood or bone marrow from unrelated donors in adults with acute leukemia. N Engl J Med. 2004;351:2276–2285. doi: 10.1056/NEJMoa041469. [DOI] [PubMed] [Google Scholar]
- 31.Chim CS, Lie AKW, Au WY, et al. Long-term results of allogeneic bone marrow transplantation for 108 adult patients with acute lymphoblastic leukemia: favorable outcome with BMT at first remission and HLA-matched unrelated donor. Bone Marrow Transplantation. 2007;40:339–347. doi: 10.1038/sj.bmt.1705734. [DOI] [PubMed] [Google Scholar]
- 32.Esperou H, Boiron JM, Cayuela JM, et al. A potential graft-versus-leukemia effect after allogeneic hematopoietic stem cell transplantation for patients with Philadelphia chromosome-positive acute lymphoblastic leukemia: results from the French Bone Marrow Transplantation Society. Bone Marrow Transplant. 2003;31:909–918. doi: 10.1038/sj.bmt.1703951. [DOI] [PubMed] [Google Scholar]