

STX3 regulates the secretion of IL1α, IL1β, IL12b, and CCL4 during gelatinase degranulation in differentiated HL-60 cells.
Keywords: SNARE proteins, neutrophils, gelatinase granules, cytokines, extracellular release
Abstract
Besides their roles in the killing of pathogens, neutrophils have the capacity to package a variety of cytokines into cytoplasmic granules for subsequent release upon inflammatory conditions. Because the rapid secretion of cytokines orchestrates the action of other immune cells at the infection site and thus, can contribute to the development and chronicity of inflammatory diseases, we aimed to determine the intracellular SNARE machinery responsible for the regulation of cytokine secretion and degranulation. From a constructed gene-expression network, we first selected relevant cytokines for functional validation by the CBA approach. We established a cytokine-secretion profile for human neutrophils and dHL-60 cells, underlining their similar ability to secrete a broad variety of cytokines within proinflammatory conditions mimicked by LPS stimulation. Secondly, after screening of SNARE genes by microarray experiments, we selected STX3 for further functional studies. With the use of a siRNA strategy, we show that STX3 is clearly required for the maximal release of IL-1α, IL-1β, IL-12b, and CCL4 without alteration of other cytokine secretion in dHL-60 cells. In addition, we demonstrate that STX3 is involved in MMP-9 exocytosis from gelatinase granules, where STX3 is partly localized. Our results suggest that the secretion of IL-1α, IL-1β, IL-12b, and CCL4 occurs during gelatinase degranulation, a process controlled by STX3. In summary, these findings provide first evidence that STX3 has an essential role in trafficking pathways of cytokines in neutrophil granulocytes.
Introduction
Neutrophil granulocytes are involved in the early recognition of microbial pathogens and subsequent triggering of an extensive proinflammatory response. To protect hosts from invading pathogens and ensure an efficient killing of infecting microorganisms, neutrophils possess, among other properties, the ability to liberate a plethora of potent cytotoxic molecules during the degranulation process [1].
During neutrophil maturation, >300 antimicrobial and proteolytic proteins are distributed in a hierarchical order within 4 different types of granules: azurophil (primary), specific (secondary), gelatinase (tertiary) granules, as well as secretory vesicles [1]. These distinct intracellular granules are readily mobilized under proinflammatory conditions, and their contents are released in a reverse chronological order compared with their synthesis [2–4].
Neutrophils are also a source of cytokines that have a pivotal position in innate and adaptive immune regulatory networks. Initially, it was assumed that cytokines were stored by the neutrophil as preformed mediators within granules and released upon appropriate stimulation. Despite their terminal differentiation, it is now obvious that neutrophils display the capacity to de novo synthesize cytokines rapidly in response to a variety of inflammatory stimuli [5]. Although subcellular fractionation of human neutrophils demonstrates that vascular endothelial growth factor is stored within specific granules [6], the precise intracellular localization of other neutrophil-derived cytokines has not yet been clearly characterized.
Proinflammatory mediators orchestrate the action of other immune cells at the site of inflammation and also many functions of neutrophils themselves [7], but they may also contribute to the persistence of inflammatory processes and hence, the development of chronic inflammatory diseases, such as sepsis, rheumatoid arthritis, atherosclerosis, or inflammation-related cancer [8]. On this basis, therefore, it is evident that cytokine secretion needs to be controlled tightly to prevent deregulated or inappropriate release and subsequent pathologic conditions.
The signaling event required for rapid delivery of cytokines to the cell surface for extracellular secretion is still poorly characterized. In the past years, evidence has accumulated that shows that SNARE proteins [9] are required for the regulation of granule fusion in neutrophils and release of their contents [10–12]. Although it is now unequivocal that many SNARE proteins are expressed and involved in intracellular vesicular trafficking pathways in neutrophils, specific mechanisms underlying the release of cytokines in neutrophils have not yet been clearly reported, and data about involvement of SNAREs in this process appear poor in these cells.
The aim of our work was to determine the role of the SNARE STX3 in cytokine secretion and degranulation following activation by bacterial LPS through cell surface receptors. As neutrophils are short lived and terminally differentiated, these cells are not amenable to genetic manipulation, such as transfection. For this reason, we used dHL-60 cells that exhibit neutrophil-like phenotypes [13] to investigate molecular mechanisms related to exocytosis and SNARE proteins. Complementary experiments were performed in human primary neutrophils to ensure the relevance of our results.
After determination of cytokine and SNARE expression profiles in dHL-60 cells and validation in human neutrophils, we showed that STX3 is involved in the secretion of IL-1α, IL-1β, IL-12b, and CCL4. We pointed out that STX3 is partly localized in gelatinase granules and is also required for exocytosis of their contents, suggesting a common secretory pathway involving cytokine release and degranulation.
MATERIALS AND METHODS
Cell culture
The promyelocytic HL-60 cell line [14] was purchased at American Type Culture Collection (Manassas, VA, USA; CCL-240) and was cultured in RPMI-1640 medium, supplemented with 10% heat-inactivated FBS, 2 mM L-glutamine, and 100 U/ml penicillin and streptomycin (Lonza, Verviers, Belgium). HL-60 cells were differentiated into neutrophil-like cells by addition of 1.3% DMSO to the culture medium for 4.5 days. The differentiation status of HL-60 cells upon DMSO treatment is evidenced by the monitored up-regulation of CD11b [15] and down-regulation of transferrin receptor (CD71; Supplemental Fig. 1) [16].
Purification of human neutrophils
Peripheral blood of healthy volunteers was collected in EDTA-containing Vacutainer tubes (BD Biosciences, Erembodegem, Belgium). Samples were collected in accordance with the good clinical practices and following the national and international ethical recommendations. Neutrophils were isolated from blood samples by the Polymorphprep separation procedure (Axis-Shield, Dundee, Scotland), according to the manufacturer’s instructions. The efficacy of the Polymorphprep method for neutrophil isolation from peripheral blood has been validated [17]. Remaining erythrocytes in the neutrophil cell suspension were lysed for 10 min with RBC lysis buffer (155 mM NH4Cl, 10 mM KHCO3, 0.1 mM EDTA, pH 7.4). Neutrophils were washed and resuspended in PBS, 1× (pH 7.4). Purity of the isolated neutrophil population was ≥98%, as analyzed by the FACSCanto II flow cytometer (BD Biosciences) by use of 2 mixtures of selection markers CD66b-FITC (clone B13.9)/CD11b-PE (clone MEM-174)/CD14-APC (clone MEM-18) and CD15-FITC (clone MEM-158)/CD16-PE (clone LNK16)/CD45-APC (clone MEM-28; Immunotools, Friesoythe, Germany) on 10,000 events in the gated population of homogenous (FSC-A vs. SSC-A), single (SSC-A vs. SSC-H), and living (negative cells for SYTOX Blue staining) cells (Life Technologies, Gent, Belgium). Purified neutrophils were positive for all of the selection markers used by flow cytometry. Monocytes could be distinguished from the neutrophil population by CD11b+CD66b−CD14high, lymphocytes by CD11b−CD66b−CD14−, and eosinophils by CD45+CD16− SSChigh (Supplemental Fig. 2). Human neutrophil samples were cultured in X-VIVO 15 medium with L-glutamine and gentamicin (Lonza) at 37°C and 5% CO2 up to 24 h after purification.
Cell stimulation
dHL-60 cells and highly purified neutrophils were stimulated with bacterial LPS from Escherichia coli serotype O111:B4 (Sigma, Bornem, Belgium) for simulating proinflammatory conditions. As LPS, at concentrations of 100 ng/ml, also acts on neutrophils independently of serum LPS-binding protein [18] and to avoid any serum component contamination, which could interfere with specific LPS-induced cell responses, stimulations were carried out under serum-free conditions. For kinetic studies of cytokine mRNA expression, 1 × 10⁷ cells were treated with 100 ng/ml LPS for 2, 6, and 12 h. To analyze cytokine secretion and degranulation, dHL-60 cells or neutrophils were stimulated with different LPS concentrations (10, 30, and 100 ng/ml) for 6 or 12 h, respectively. Time-points of 6 and 12 h of LPS stimulation were chosen according to the maximal cytokine mRNA-expression levels.
Total RNA extraction and quality control
RNA from dHL-60 cells was extracted by use of the innuPREP RNA mini kit (Analytik, Jena, Germany), according to the manufacturer’s instructions. The quantity and quality of total RNA were evaluated by a NanoDrop ND-2000 spectrophotometer (Thermo Scientific, Erembodegem, Belgium). To determine the integrity of total RNA, samples were examined on the 2100 Bioanalyzer (Agilent Technologies, Palo Alto, CA, USA) by use of an RNA 6000 Nano LabChip kit following the supplier’s instructions.
Affymetrix microarray and data analysis
Total RNA samples were reverse transcribed to dscDNA by use of specific primers that reduce the priming of rRNA. Then, cRNA was generated by in vitro transcription and reverse transcribed into a sense sscDNA. Afterwards, the cDNA was fragmented, labeled, and hybridized on GeneChip Human Gene 1.0 ST Arrays (Affymetrix, Santa Clara, CA, USA), according to the Ambion WT Expression kit for the Affymetrix GeneChip WT expression array protocol (P/N 4425209 Rev. B 05/2009) and GeneChip WT Terminal Labeling and Hybridization User Manual for use with the Ambion WT Expression kit (P/N 702808 Rev. 6; Life Technologies, Santa Clara, CA, USA). Microarrays were then washed, stained, and scanned, according to the manufacturer’s instructions. CIMFast Event Language files containing hybridization raw signal intensities were imported into GS software (Partek, St. Louis, MO, USA) for further statistical analysis. First, probe intensities were summarized to gene-expression signals by use of Partek default options (GC content adjustment, RMA background correction, quantile normalization, log2 transformation, and summarization by means). Variance in the data set was then analyzed by use of the PCA approach. As PCA separated samples into 4 groups, according to treatment and time, a 2-way ANOVA, followed by FDR correction, was applied to detect differential expressed genes. Two cutoffs were considered to identify those genes: FDR < 0.05 and absolute FC ≥ 2. The networks were generated through the use of Ingenuity Pathway Analysis (Ingenuity Systems, Redwood City, CA, USA). Microarray-expression data from LPS-stimulated dHL-60 cells are available at ArrayExpress (The European Molecular Biology Laboratory-European Bioinformatics Institute, Cambridge, United Kingdom) under the Accession Number E-MTAB-1393. Microarray-expression data for SNARE expression from undifferentiated HL-60 cells, dHL-60 cells, and human neutrophils are available under the Accession Number E-MTAB-2107.
qRT-PCR
cDNA was synthesized from 2 µg total RNA by use of the ThermoScript RT system (Life Technologies). Forward and reverse primers (Tables 1 and 2) were designed with the aid of the Online PCR Primer Design Tool (GenScript, Piscataway, NJ, USA). Primer efficiency and amplicon integrity were controlled by analysis of melting curves, agarose gel, and sequencing. qRT-PCR was performed with iQ SYBR Green Supermix (Bio-Rad Laboratories, Nazareth, Belgium) for 40 cycles on a MyiQ single-color qRT-PCR detection system. All data were analyzed in triplicates. Quantification of mRNA levels was carried out with Bio-Rad iQ5 software, and normalization of mRNA levels was calculated with respect to the reference gene β-actin, according to the 2−ΔΔ comparative threshold Livak and Schmittgen method [19].
TABLE 1.
Primer sequences used for cytokine gene expression by qRT-PCR
| Gene | GenBank ref. | Forward primer (5′–3′) | Reverse primer (5′–3′) |
|---|---|---|---|
| β-Actin | NM_001101 | TGA-CCC-AGA-TCA-TGT-TTG-AGA | AGT-CCA-TCA-CGA-TGC-CAG-T |
| TNF | NM_000594.2 | GGA-CAC-CAT-GAG-CAC-TGA-AA | AAG-AGG-CTG-AGG-AAC-AAG-CA |
| IL-1A | NM_000575.3 | GGA-GAT-GCC-TGA-GAT-ACC-CA | CCG-TGA-GTT-TCC-CAG-AAG-AA |
| IL-1B | NM_000576.2 | CAC-ATG-GGA-TAA-CGA-GGC-TT | TCC-ATA-TCC-TGT-CCC-TGG-AG |
| IL-6 | NM_000600.3 | CAC-ACA-GAC-AGC-CAC-TCA-CC | AGT-GCC-TCT-TTG-CTG-CTT-TC |
| IL-12B | NM_002187.2 | AAG-GAG-GCG-AGG-TTC-TAA-GC | GAA-TAA-TTC-TTG-GCC-TCG-CA |
| CCL2 | NM_002982.3 | AGG-AAC-CGA-GAG-GCT-GAG-AC | GCA-GAG-ACT-TTC-ATG-CTG-GA |
| CCL3 | NM_002983.2 | TGC-TCA-GAA-TCA-TGC-AGG-TC | TGA-TGC-AGA-GAA-CTG-GTT-GC |
| CCL4 | NM_002984.2 | GGA-CAC-AGC-TGG-GTT-CTG-A | TGG-TAT-TGG-TGG-CAA-AGA-GG |
| CCL5 | NM_002985.2 | GGT-TCT-GAG-CTC-TGG-CTT-TG | GCC-AGT-AAG-CTC-CTG-TGA-GG |
| IL-8 | NM_000584.2 | CTC-CAT-AAG-GCA-CAA-ACT-TTC-A | GTT-CCT-TCC-GGT-GGT-TTC-TT |
TABLE 2.
Primer sequences used for SNARE gene expression by qRT-PCR
| Gene | GenBank ref. | Forward primer (5′–3′) | Reverse primer (5′–3′) |
|---|---|---|---|
| STX3 | NM_000594.2 | GAG-TGG-CCT-AAG-AGG-CTG-CTG-CA | GAA-CGG-GTC-GCA-CTC-GCT-CTC |
| STX6 | NM_005819.4 | TGA-TCC-TGT-GTC-TGA-TCC-CA | ACA-TTT-GGA-GCC-TGA-GTG-GA |
| STX7 | NM_003569.2 | CTT-AGT-GCT-GTG-CTG-CCT-GA | ACC-TGG-AGT-GAA-CTG-GTG-CT |
| STX8 | NM_004853.2 | TGA-AGA-GGC-TAA-GCG-AGG-AG | AAA-CCC-AAG-CCT-CTG-GTC-TC |
| STX11 | NM_003764.3 | TTC-GCA-CTC-TCG-CTC-CCA-GTC-C | GGA-TGT-GGT-CCG-TCT-CGA-ACA-CG |
| STX16 | NM_001001433.1 | CCG-ACG-CTT-TCT-TGT-TGT-T | GCA-ATG-CTA-CGT-GAA-TGC-AG |
| SNAP23 | NM_003825.2 | AAG-AAC-TTT-GAG-TCT-GGC-AAG-G | TTG-CTG-AAG-CTG-ACC-ATT-TG |
| SNAP29 | NM_004782.3 | CAA-AGC-AAA-GGA-AAC-CTC-CA | GCC-TAT-GGA-GGC-TGT-GGA-TA |
| VAMP3 | NM_004781 | CAG-CTG-GCA-GTG-TTA-GGA-CA | CAG-GAG-CCA-GTG-GGT-TAC-AT |
| VAMP4 | NM_003762.4 | TCA-CTT-TGG-TAA-GTG-CCT-TTG-A | TGA-GGA-ATT-GAG-AAG-CTA-GGG-A |
| VAMP7 | NM_005638.5 | GCT-CGA-GCC-ATG-TGT-ATG-AA | GCT-TGG-CCA-TGT-AAA-TCC-AC |
| VAMP8 | NM_003761.4 | AAA-GTT-GGA-GCA-AGC-AGG-AA | CAC-GAT-CAT-TTC-CTC-CAC-CT |
siRNA assays
dssiRNA of 19 nt targeting human STX3 (as well as a nonsilencing, scramble siRNA) were custom ordered from Eurogentec (Seraing, Belgium). Three synthesized siRNA candidate duplexes were tested for silencing efficiency. The most efficient siRNA to mediate knockdown expression of STX3 was chosen, leading to ∼80% expression inhibition and used for functional analysis. All experiments were performed with a siRNA duplex (sense: 5′- GGCACGAGAUGAAACGAAA -3′, antisense: 5′- UUUCGUUUCAUCUCGUGCC -3′). The nonsilencing control siRNA (sense: 5′- UGCGCUACGAUCGACGAUG -3′, antisense: 5′- CAUCGUCGAUCGUAGCGCA -3′) was used as a negative control. siRNA target sequences chosen in this study were screened by National Center for Biotechnology Information Basic Local Alignment Search Tool searches to avoid mismatches. dHL-60 cells (2 × 10⁶) were transiently transfected with 2 μg STX3 siRNA or nonsilencing control sequence at Day 3 of differentiation by use of the Nucleofector apparatus (Amaxa Biosystems, Cologne, Germany) and the Nucleofector V kit with program T-019, according to the manufacturer’s protocol. Terminally differentiated cells were processed for further experiments upon 48 h post-transfection.
Western blot analysis
Cells were lysed in a buffer containing 50 mM Hepes, pH 7.5, 150 mM NaCl, 10% glycerol, 1 mM EDTA, 10 mM NaF, 0.5 mM Na3VO4, 1% Triton X-100, and 1.5 mM MgCl2, supplemented with a mix of serine and cysteine protease inhibitors (complete protease inhibitor cocktail tablets; Roche Molecular Biochemicals, Basel, Switzerland). For human neutrophil lysates, 30 µL 0.05 M diisopropylfluorophosphate (D0879; Sigma) was added to the 40 × 106 cell pellet before the addition of 500 µ1 lysis buffer. Lysates were centrifuged at 10,000 g at 4°C for 10 min, and an equal volume of Laemmli 2× buffer was added to supernatants. After resolving heat-denatured samples on 12% SDS-PAGE, proteins were transferred onto nitrocellulose (Hybond ECL; Amersham, GE Healthcare, Belgium) membranes that were saturated with blocking buffer containing 3% w/v nonfat milk. Immunodetection was realized by use of rabbit polyclonal anti-STX3 (1:2000 dilution, clone A31534; Sigma) and mouse monoclonal anti-β-actin (1:500 dilution, clone C4; Millipore, Bruxelles, Belgium) as primary antibodies and HRP-conjugated secondary antibodies directed against rabbit IgGs (1:10,000 dilution, AP132P; Millipore) or mouse IgGs (1:20,000 dilution, AP124P; Millipore). Revelation of bands was visualized by ECL detection. Band intensities were quantified by densitometry by use of ImageJ densitometry software (U.S. National Institutes of Health, Bethesda, MD, USA). The integrated intensity of the target protein band was normalized to the reference protein (β-actin).
ELISA
To quantify the release of granule matrix proteins upon degranulation, supernatants from LPS-stimulated dHL-60 cells were analyzed via human MPO ELISA kit (BMS2038INST; eBioscience, Vienna, Austria), human MMP-9 ELISA kit (ELH-MMP9-001; RayBio, Boechout, Belgium), and bovine albumin ELISA kit (E11-113; Bethyl Laboratories, Montgomery, TX, USA), according to the manufacturers’ instructions. Cell cytotoxicity, upon treatments, was examined by use of LDH (CytoTox 96 Non-Radioactive Cytotoxicity Assay, G1780; Promega, Leiden, The Netherlands), according to the manufacturer’s instructions. For normalization, ELISA absorbance results were divided by LDH absorbance values.
Cell analysis by flow cytometry
To analyze the rate of cell death, apoptotic cells were assessed by the use of the Annexin V-FITC apoptosis detection kit (556570; BD Biosciences), according to the manufacturer’s instructions. The percentage of apoptotic cells was determined as cells positive for Annexin V-FITC labeling on the entire cell population.
The most relevant markers have been selected for degranulation analysis, in accordance with the literature [1]. Degranulation was determined by measuring the expression of CD markers specific for azurophil granules (CD63-PE), gelatinase granules (CD11b-PE), and secretory vesicles (CD13-APC, CD14-APC, CD18-FITC, CD35-FITC, CD45-APC) at the plasma membrane by flow cytometry (all antibodies are from BD Biosciences except CD14-APC from Immunotools). IgG1-FITC and IgG2a-PE (BD Biosciences) and IgG1-APC antibodies (Immunotools) were used as negative isotype controls, whereas CD45-FITC, CD45-PE, or CD45-APC (BD Biosciences) single-dye staining was used to set compensations. Data analysis was performed by measuring the MFI for each CD marker with BD FACSDiva software (BD Biosciences) on the gated population of granulocytes (FSC-A vs. SSC-A) and single (SSC-A vs. SSC-H) and living (negative cells for SYTOX Blue staining; Life Technologies) cells. In total, 10,000 events were recorded per staining. The relative translocation at the plasma membrane of CD markers for each granule was determined by calculating the ratio between MFI (+LPS/−LPS) of STX3 siRNA-treated dHL-60 cells and (+LPS/−LPS) of nonsilencing, siRNA-treated dHL-60 cells.
Measurement of cytokine secretion by CBA
Cell density was adjusted to 2 × 10⁶ cells/condition for subsequent quantitative measurement of cytokine secretion by LPS-stimulated cells. Fresh supernatants were collected and used directly for CBA (BD Biosciences) analysis. The multiplex standard curve composed of mixed cytokine standards was set up by serial dilutions, according to the manufacturer’s instructions. Selected capture beads were prepared and added to supernatants. The following beads were used: CCL2 (MCP-1, bead D8), CCL3 (MIP-1α, bead B9), CCL4 (MIP-1β, bead E4), CCL5 (RANTES, bead D4), IL-1α (bead D6), IL-1β (bead B4), IL-6 (bead A7), IL-8 (CXCL8, bead A9), IL-12b (bead E5), and TNF-α (bead C4). After 1 h of incubation, detection reagent was added to each sample. After 2 h of incubation, samples were rinsed with wash buffer and centrifuged. Samples were washed again before flow cytometry analysis (BD FACSCanto II; BD Biosciences). Results were quantified by use of the standard curves and the Flow Cytometric Analysis Program Array software (Soft Flow, Minneapolis, MN, USA).
Immunofluorescence analysis of STX3 localization
Cells were centrifuged for 5 min at 300 g to adhere to glass coverslips. After fixation with 3% w/v paraformaldehyde/2% w/v sucrose in 1× PBS, cells were permeabilized in a 1× PBS buffer containing 0.1% w/v saponin and 0.5% w/v BSA and then blocked with 5% human IgG (Sigma). Cells were immunostained with the following primary antibodies: rabbit anti-human STX3 (1:400 dilution, clone A31534; Sigma) and mouse anti-human CD43 for plasma membrane (1:100 dilution, clone 290111; R&D Systems, Abingdon Oxon, United Kingdom); mouse anti-human CNX for endoplasmic reticulum (1:50 dilution, clone 546828; Millipore); mouse anti-human GM130 for Golgi (1:25 dilution, clone 35; BD Biosciences); mouse anti-human EEA1 for early endosomes (1:25 dilution, clone 14; BD Biosciences); mouse anti-human LAMP-1 (1:50 dilution, clone H4A3; BD Biosciences) and LAMP-2 (1:200 dilution, clone H4B4; BD Biosciences) for late endosomes; mouse anti-human MPO for azurophil granules (1:2500 dilution, clone 2C7; Thermo Scientific); mouse anti-human LTF for specific granules (1:1000 dilution, clone 2B8; AbD Serotec, Düsseldorf, Germany); mouse anti-human MMP-9 for gelatinase granules (1:600 dilution, clone 5G3; Thermo Scientific); and mouse anti-human TN for secretory vesicles (1:40 dilution, clone 5B7; Thermo Scientific). To assure the specificity of the rabbit anti-human STX3 antibody, STX3 was immunostained in dHL-60 cells treated with nonsilencing control siRNA and STX3 siRNA-treated dHL-60 cells. STX3 pixel intensities were quantified by densitometry by use of ImageJ densitometry software. The intensity of STX3 in STX3 siRNA-treated dHL-60 cells was normalized to the intensity in control dHL-60 cells. These results show that the STX3 fluorescent signal was reduced significantly in STX3 siRNA-treated dHL-60 cells compared with the control siRNA-treated cells (data not shown) and confirm the efficiently silenced STX3 protein level detected by Western blot in the entire siSTX3-transfected cell population. In addition, immunostaining with each marker alone as positive controls served to detect and avoid any fluorescent signal bleedthrough to other channels. The use of donkey serum (1:500 dilution; Jackson ImmunoResearch, Newmarket Suffolk, United Kingdom) served as negative control. After washing with blocking buffer, cells were incubated with cyanine 3-conjugated donkey anti-mouse (1:150 dilution, 715-165-150; Jackson ImmunoResearch) and Alexa Fluor 488-conjugated donkey anti-rabbit (1:200 dilution, A21206; Life Technologies) antibodies, as well as DAPI for nuclear staining (1 μM; D1306; Life Technologies). After washing, samples were mounted on Moviol/1,4-diazabicyclo (2,2,2) octane and monitored by confocal microscopy by use of a 63×/1.4 oil objective with a 405 nm laser and a bandpass BP 420–480 nm to excite and detect DAPI, a 488 nm laser and a BP 505–550 nm to excite and detect Alexa Fluor 488, and a 561 nm laser and a BP 575–615 nm to excite and detect cyanine 3, respectively (LSM 510 META; Zeiss, Zaventem, Belgium). Confocal 2-dimensional and z-stack images were deconvolved by use of AutoQuant X3 (Media Cybernetics, Rockville, MD, USA). A minimum of 100 cells/condition from z-stack images only was evaluated for PCC, which was calculated, as it is a rapid, simple, and most importantly, robust tool to investigate colocalization of 2 proteins [20]. The PCC was evaluated for each entire image, according to the equation mentioned by Barlow et al. [21]. In our case, we put the threshold of the PCC ≥0.7 to select only for highly positive correlation between green and red pixels.
Statistical analysis
Statistical analysis was performed by use of the 2-tailed unpaired Student's t-test in Prism 5 software (Graph Pad Software, La Jolla, CA, USA).
RESULTS
Cytokine-expression network in dHL-60 cells upon LPS stimulation
So far, no complete pattern of cytokine secretion has yet been defined in dHL-60 cells upon LPS treatment. Furthermore, data from the literature concerning the expression of many cytokines in human neutrophils (e.g., CCL2, CCL5, CCL7, CCL8, IL-10, IL-1B, IL-6, and TNF) are contradictory [22], and there are still many open questions about the exact cytokines actually released by human neutrophils upon proinflammatory conditions. To examine the cytokine regulatory network, we first established the cytokine-expression profile in LPS-treated dHL-60 cells and then validated our data in highly purified human neutrophils.
We performed a microarray gene-expression analysis to define transcriptional alterations in dHL-60 cells upon LPS stimulation. dHL-60 cells were left untreated (nonstimulated control) or incubated in the presence of 100 ng/ml LPS for 2 or 6 h, and total RNA extracted from triplicate assays was analyzed. Hierarchical clustering of array data with average linkage and PCC as similarity metrics were used to examine the variability within the expression data set. Correlation coefficients for replicates were >0.995, indicating high assay reproducibility. Interestingly, among the 472 genes differentially regulated upon 6 h of LPS stimulation (only 70 genes up-regulated upon 2 h of LPS stimulation), 44 genes encoding cytokine molecules or receptors were found to be up-regulated (microarray-expression data are available under E-MTAB-1393 at www.ebi.ac.uk/arrayexpress), emphasizing the importance of cytokine activity in the response to LPS. These include, e.g., IL-6, TNF, IL-1B, CCL2, CCL5, CCL7, and CCL8. No down-regulation of any of these 44 genes was observed at any time-point of the study.
To explore further the behavior of key players involved in the inflammatory response mediated by cytokines following LPS stimulation, our experimental data were analyzed by use of the Ingenuity Pathway Analysis platform (Ingenuity Systems; www.ingenuity.com). Based on information available in the Ingenuity knowledge base, describing the cytokines implicated in the biologic response to LPS, a regulatory network was built by considering all genes that were overexpressed in our experimental data set (treated vs. untreated cells after 6 h of stimulation). The resulting network represented in Fig. 1A shows that IL-8, IL-1A, IL-1B, and TNF constitute 4 important nodes in the cytokine response to LPS. A direct impact of LPS treatment on CCL2, IL-12B, and IL-6 gene expression was apparent from this analysis. In addition to these genes, 3 other relevant chemokines (CCL3, CCL4, and CCL5), described to have prominent roles in neutrophil-mediated inflammatory response [8, 23–25], have been chosen for qRT-PCR validation.
Figure 1. Cytokine transcript analysis of dHL-60 cells under proinflammatory conditions. (A) Microarray analysis was used to generate a literature-based cytokine-expression network in LPS-stimulated dHL-60 cells by use of Ingenuity Pathway designer. The representation includes the biologic interaction network of significant, differentially expressed cytokine genes (cutoff: FDR < 0.05 and FC ≥ 2) upon stimulation of dHL-60 cells for 6 h with 100 ng/ml LPS from E. coli O111:B4. LPS is represented as the single agonist for induction of the cytokine-expression network. Arrows represent interactions that promote expression. (B) Time-dependent effect of LPS on cytokine mRNA expression. Validation of cytokine mRNA expression was performed by qRT-PCR after treatment with 100 ng/ml LPS for 2, 6, and 12 h. Data were normalized to β-actin and expressed relative to the calibrator (nonstimulated control) at the corresponding time ± sem of at least 5 independent experiments. Significantly different from cytokine expression in the nonstimulated control: *P < 0.05; **P < 0.01.
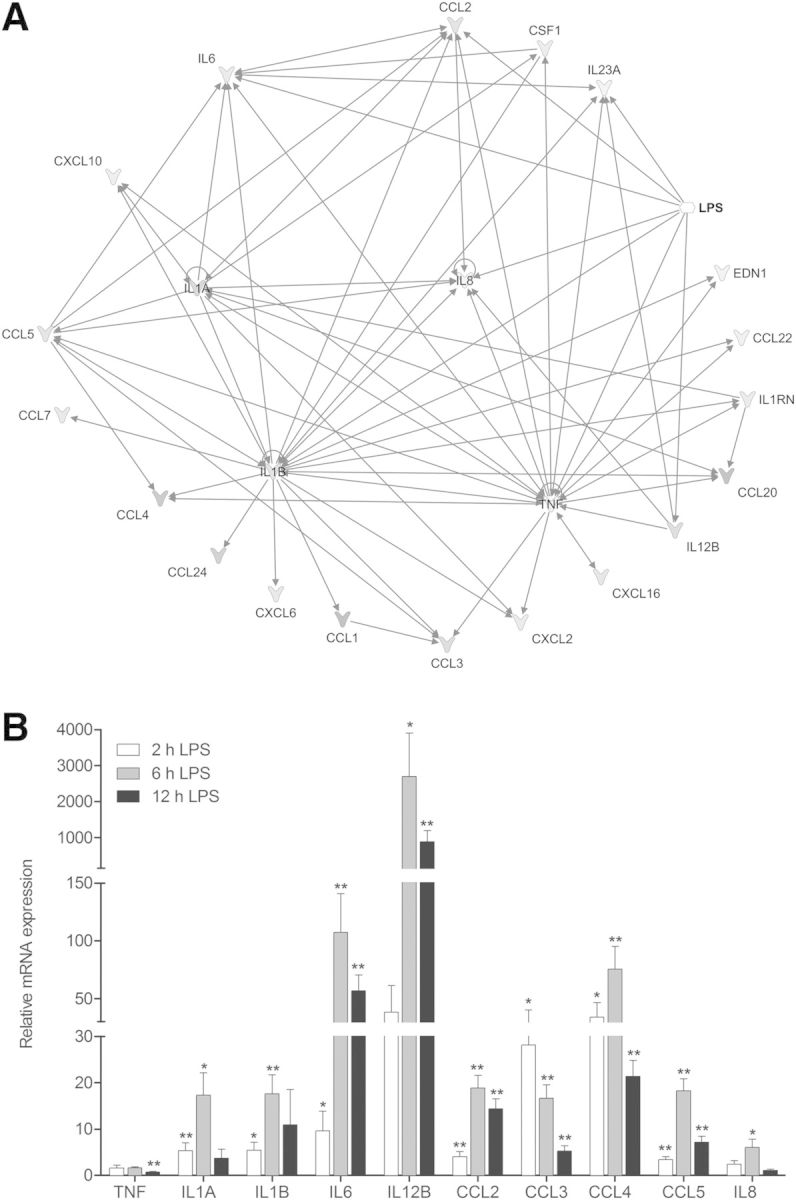
Cytokine mRNA expression in dHL-60 cells upon LPS stimulation
Gene-expression analysis of the selected set of cytokines by qRT-PCR (Fig. 1B) was highly similar to the microarray results. The correlation of cytokine expression between microarray and qRT-PCR data, derived from LPS-treated dHL-60 cells for 6 h, has been validated for statistical analysis by use of PCC (R = 0.79, P = 4.45 × 10⁻⁵; data not shown), underlining the robustness of the analyses. qRT-PCR time-series confirmed significant expression changes for 7 out of 10 genes examined. Transcript expression of selected cytokines was up-regulated upon LPS stimulation, except for TNF, CCL3, and IL-8, for which no significant change upon 6 h LPS treatment or down-regulation was observed. Most of the cytokines presented a peak expression after 6 h, which decreased after 12 h of LPS stimulation. In addition, cytokine expression varied in magnitude. On this basis, cytokines can be classified into 2 groups: 1 grouping—TNF, IL-1A, IL-1B, CCL2, CCL3, CCL5, and IL-8—showing moderate differential expression (inferior to 50-fold after LPS stimulation) and another—including IL-6, IL-12B, and CCL4—exhibiting a high differential expression, superior to 50-fold after LPS stimulation.
LPS-dependent cytokine release by dHL-60 cells
As mRNA levels do not necessarily reflect the relative amount of proteins, quantification of cytokine mRNA by qRT-PCR needs to be interpreted carefully. To corroborate mRNA-expression results at the protein functional level, we studied the ability of LPS to induce the release of cytokines.
dHL-60 cells were treated with increasing concentrations of LPS, and secreted cytokines were quantified by use of the CBA technology. Under nonstimulated conditions, CCL4 and IL-8 were secreted to a basal level by dHL-60 cells. Stimulation of cells with low concentrations of LPS (0.1 ng/ml, 0.3 ng/ml, 1 ng/ml, and 3 ng/ml) triggered a secretion of only IL-8 and CCL4 when compared with nonstimulated conditions (data not shown). Therefore, IL-8 and CCL4 can constitute a pool of proinflammatory mediators mobilized rapidly.
In the presence of higher LPS concentrations (10 ng/ml, 30 ng/ml, and 100 ng/ml), all selected cytokines, whose transcripts were expressed, were also released into the extracellular medium upon LPS stimulation in a concentration-dependent manner (Fig. 2A). IL-8 and CCL4 were found to be highly secreted, whereas IL-1α, IL-1β, TNF-α, and CCL5 were only detected discretely.
Figure 2. LPS-induced cytokine secretion in dHL-60 cells. (A) Concentration-dependent effect of LPS on cytokine secretion in dHL-60 cells. Cytokine secretion was measured by CBA upon 6 h stimulation with 10, 30, and 100 ng/ml LPS. Results are mean ± sem of at least 3 independent experiments. Significantly different from cytokine secretion in 6 h, nonstimulated control: **P < 0.01. (B) LPS-induced cytokine secretion in highly purified peripheral blood neutrophils. Cytokine secretion was measured by CBA in ≥98% pure neutrophils upon 12 h stimulation with 100 ng/ml LPS. Results are mean ± sem of at least 3 independent experiments. Significantly different from cytokine secretion in nonstimulated cells (control): **P < 0.01.

No variation of apoptosis rate has been observed in our experimental conditions (data not shown). In dHL-60 cells, the previously reported antiapoptotic effect of LPS in neutrophils [26] is not pronounced, probably as a result of the fact that dHL-60 cells derived from a patient with acute promyelocytic leukemia.
Validation of cytokine secretion in highly purified human neutrophils
Secretion of selected cytokines was additionally determined in primary human neutrophils isolated from peripheral blood. A preparation of neutrophils highly purified (≥98%) has been used for CBA experiments, avoiding as much as possible the presence of monocytes that have been reported to affect the data profoundly as a result of their high ability to secrete cytokines [27, 28]. To underline the fact that neutrophils are the source of the detected cytokines, we analyzed cytokine-secretion levels between neutrophils highly purified ≥98% and those purified to ≥90% (Supplemental Fig 3) and observed that they are similar. Our purification data show that the amount of monocytes is as low as 0.1%. According to our experimental conditions, we can conclude that the detected level of secreted cytokines, such as IL-6 and CCL2, might not derive from monocytes. Additionally, monocytes are known to produce not only IL-6 in great quantities but also TNF-α and IL-1. However, the latter 2 cytokines are secreted to a very low level (<100 pg/ml).
The maximal peak of secretion for the majority of the cytokines was reached at 12 h for a concentration of 100 ng/ml LPS. Figure 2B shows that all of the cytokines secreted by dHL-60 cells were also released by neutrophils. TNF-α, IL-1α, IL-1β, CCL3, CCL5, and IL-12b were only discretely secreted (<150 pg/ml), whereas IL-6, CCL4, and CCL2 were secreted at an intermediate level (∼250–600 pg/ml) and IL-8 highly secreted (∼10,000 pg/ml). The response is qualitatively similar in dHL-60 cells and neutrophils, despite quantitative difference in the cytokine-secretion profile upon LPS stimulation. The similar cytokine-secretion response from highly purified neutrophils, as well as the neutrophil-like cell model, additionally underlines the fact that neutrophils are the actual source of the detected cytokines.
In accordance with the literature [26], cell apoptosis in neutrophils was shown to be diminished significantly upon 12 h of LPS treatment in our experimental conditions, underlining the fact that LPS is able to delay apoptosis in freshly isolated human neutrophils (data not shown).
Endogenous expression of v- and t-SNAREs in myeloid cells
In a second step, we examined the expression of SNARE genes in promyelocytic undifferentiated and dHL-60 cells to induce terminal differentiation along granulocyte lineage [14]. For that, microarray experiments were conducted to detect the expression profile of SNARE genes (microarray-expression data are available at www.ebi.ac.uk/arrayexpress). The docking and fusion of transport vesicles with target membranes are mediated by the direct interaction of v-SNAREs, including synaptobrevin/VAMP family members, with t-SNAREs, including STXs and SNAP25 homologs [9]. Data analysis revealed that 22 v- and t-SNAREs were expressed in HL-60 cells (Fig. 3A).
Figure 3. Endogenous SNARE mRNA expression in dHL-60 cells compared with undifferentiated cells. (A) Screening of 22 SNARE genes was performed by microarray analysis. Data are given as ratio between dHL-60 and undifferentiated HL-60 cells of 3 independent experiments (ANOVA, FDR < 0.05, and absolute FC ≥ 2). (B) SNARE expression of 14 genes was validated by qRT-PCR in undifferentiated and dHL-60 cells. Data were normalized to β-actin and expressed relative to the SNARE expression in undifferentiated HL-60 cells ± sem of at least 3 independent experiments. Significantly different from the SNARE expression in undifferentiated HL-60 cells: *P < 0.05. (Inset) Correlation between microarray and qRT-PCR SNARE-expression log data is shown.

To examine possible divergence of SNARE gene expression in native and dHL-60 cells, we checked if SNARE mRNA patterns were modified during the process of DMSO differentiation. With the consideration of a FDR < 5% and absolute FC ≥ 2, Fig. 3A and Table 3 show that upon differentiation, the expression of 2 t-SNAREs (STX3 and STX11) and 1 v-SNARE (VAMP1) expression is up-regulated at a level ∼2.5- to 3-fold higher than in undifferentiated HL-60 cells. To the contrary, mRNA-expression levels of other SNAREs were not dramatically affected during the differentiation process.
TABLE 3.
Genomic expression of SNAREs in HL-60 cells and neutrophils
| Official symbol | Gene name | HL-60 differentiation | Neutrophils |
|---|---|---|---|
| STX2 | Syntaxin 2 | → | X |
| STX3 | Syntaxin 3 | ↗ | ν |
| STX4 | Syntaxin 4 | → | ν |
| STX5 | Syntaxin 5 | → | ν |
| STX6 | Syntaxin 6 | → | ν |
| STX7 | Syntaxin 7 | → | ν |
| STX8 | Syntaxin 8 | → | ν |
| STX10 | Syntaxin 10 | → | ν |
| STX11 | Syntaxin 11 | ↗ | ν |
| STX12 | Syntaxin 12 | → | ν |
| STX16 | Syntaxin 16 | → | ν |
| STX17 | Syntaxin 17 | → | ν |
| STX18 | Syntaxin 18 | → | X |
| SNAP23 | Synaptosomal-associated protein (23 kDa) | → | ν |
| SNAP29 | Synaptosomal-associated protein (29 kDa) | → | ν |
| VAMP1 | Vesicle-associated membrane protein 1 | ↗ | ν |
| VAMP2 | Vesicle-associated membrane protein 2 | → | ν |
| VAMP3 | Vesicle-associated membrane protein 3 | → | ν |
| VAMP4 | Vesicle-associated membrane protein 4 | → | ν |
| VAMP5 | Vesicle-associated membrane protein 5 | → | X |
| VAMP7 | Vesicle-associated membrane protein 7 | → | ν |
| VAMP8 | Vesicle-associated membrane protein 8 | → | ν |
→, No significant variation of genomic expression after differentiation of HL-60 cells; ↗, increase of genomic expression after differentiation of HL-60 cells; X, SNARE mRNA is not expressed in neutrophils; ν, SNARE mRNA is expressed in neutrophils.
Then, microarray data were validated by qRT-PCR by use of primers specifically designed and validated. Gene-expression analysis was highly similar to the microarray results, as highlighted by the up-regulated expression of the same genes: STX3, STX11, and VAMP1 (Fig. 3B). For statistical analysis, correlation between the microarray and qRT-PCR results has been validated by use of PCC (R = 0.98, P < 0.0001; Fig. 3B, inset). A comparable profile of SNARE mRNA expression has been found in highly purified human neutrophils, except for STX2, STX18, and VAMP5, which were not expressed in primary cells (Table 3).
Given that 1) STX3, STX11, and VAMP1 are up-regulated during the differentiation process in HL-60 cells, 2) STX11 and VAMP1 had already been implicated in granule exocytosis in neutrophils [29–32], and 3) no study has ever considered the functional role of STX3 in neutrophils, we investigated whether STX3 is required for cytokine release in dHL-60 cells.
Western blot analysis was carried out to correlate the STX3 mRNA to protein level and confirmed that this protein is expressed in mature peripheral blood human neutrophils and up-regulated during neutrophil differentiation of HL-60 cells with DMSO (Fig. 4A). As expected, STX3 was found to be expressed in human neutrophils and dHL-60 cells by use of a specific antibody that recognized a band of 29 kDa. The level of STX3 protein was ∼4.5-fold higher in dHL-60 cells than in undifferentiated HL-60 cells.
Figure 4. STX3 protein expression and efficiency of siRNA-mediated knockdown of STX3. (A) STX3 protein expression in undifferentiated HL-60 cells (ND), dHL-60 cells (D), and neutrophils was determined by Western blotting. Proteins were detected with specific rabbit polyclonal anti-STX3. A Western blot representative of 9 independent experiments is shown. Histogram representing the densitometry evaluation of Western blots was performed by ImageJ software. Protein level was normalized to β-actin. Results are given in ratio between differentiated and undifferentiated HL-60 cells ± sem of at least 9 independent experiments. Significantly different from undifferentiated HL-60 cells (control): *P < 0.05. (B) Efficiency of STX3 siRNA (siSTX3) was determined by qRT-PCR analysis. dHL-60 cells were transiently transfected with STX3 siRNA. The amount of STX3 mRNA in cells was normalized to β-actin and expressed as percent of STX3 mRNA obtained from cells transfected with a nonsilencing sequence used as control. Results are expressed as percent ± sem of at least 5 independent experiments. Significantly different from control: *P < 0.05. (C) Specificity of STX3 antibody was determined by Western blot analysis. A Western blot representative of 3 independent experiments is shown. Histogram shows efficiency of STX3 siRNA on protein expression. The integrated intensity of the target protein band was normalized to β-actin and expressed as percent of control (nonsilencing siRNA sequence). Results are expressed as percent ± sem of at least 3 independent experiments. Significantly different from control: *P < 0.05.

STX3 is required for LPS-induced release of IL-1α, IL-1β, IL-12b, and CCL4 from dHL-60 cells
To address the issue of whether STX3 is functionally involved in cytokine secretion, we used specific siRNA sequences to target and selectively suppress endogenous STX3 protein. STX3 siRNA led to an effective inhibition of the relevant target molecule. The mRNA level of targeted STX3 was reduced with a percentage of ∼80% (Fig. 4B). Specificity of this knockdown was confirmed by the absence of any significant changes in the levels of other STX isoforms (STX6, STX7, and STX11; data not shown). At the protein level, Western blotting revealed that the knockdown resulted in a decrease of >50% of STX3 (Fig. 4C).
In accordance with our results above, dHL-60 cells were stimulated for 6 h with 10 ng/ml LPS to analyze the role of STX3 on cytokine release. We found that down-regulation of STX3 reduced the secretion of IL-1α, IL-1β, IL-12b, and CCL4 elicited by LPS (Fig. 5). Whereas STX3 deficiency affected the release of ∼33% for IL-1α and IL-12b, ∼23% for IL-1β, and ∼16% for CCL4, STX3 siRNA did not affect the capacity of dHL-60 cells to release other cytokines.
Figure 5. Effect of STX3 knockdown in dHL-60 cells on cytokine secretion. dHL-60 cells were transiently transfected with STX3 siRNA. Transfected cells were assessed for cytokine secretion by use of CBA after 6 h stimulation by LPS (10 ng/ml). Results are expressed in relative cytokine secretion, meaning the ratio between siRNA STX3 (+LPS/−LPS) and control-transfected cells (+LPS/−LPS) ± sem of at least 3 independent experiments. Significantly different from nonsilencing siRNA: *P < 0.05.

Down-regulation of STX3 affects the LPS-mediated release of gelatinase granules in dHL-60 cells
As 1) STX3 affects the LPS-induced release of IL-1α, IL-1β, IL-12b, and CCL4, 2) it has been described that cytokines may be located in intracellular granules and vesicles [6], and 3) SNARE proteins are also involved in neutrophil granule exocytosis [10–12], we also investigated the requirement of STX3 for degranulation in dHL-60 cells.
To this purpose, supernatants of dHL-60 cells stimulated by 10 ng/ml LPS for 6 h were tested by ELISA for secretion of soluble mediators that have been described characteristic for the different granule types: MPO for azurophil granules, MMP-9 for gelatinase granules, and serum albumin for secretory vesicles [1]. No marker of specific granules has been used, as dHL-60 cells are known to lack these type of granules [13].
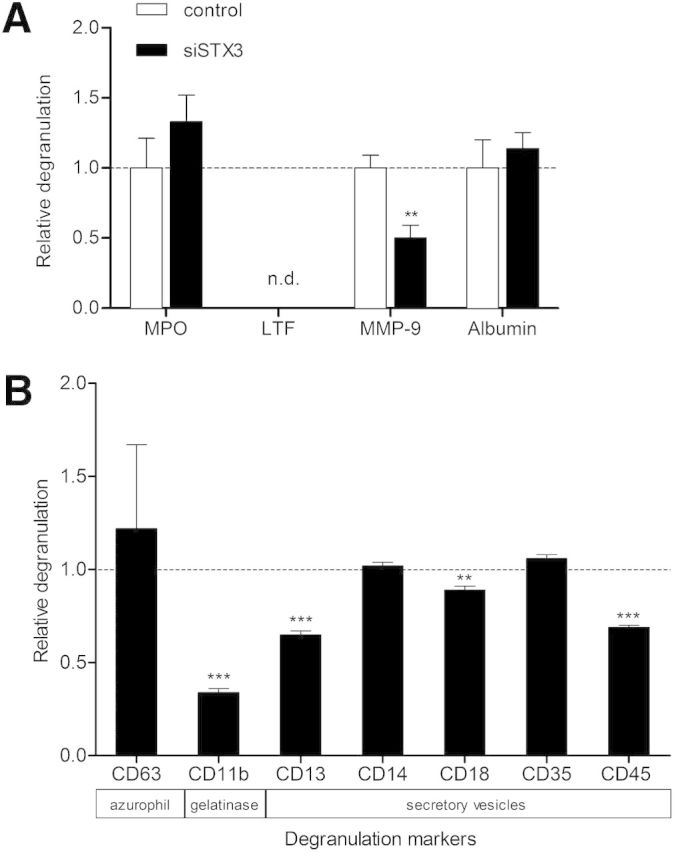
As shown in Fig. 6A, dHL-60 cells treated with STX3 siRNA displayed ∼50% reduction in their capacity to release MMP-9 compared with the control siRNA. On the contrary, MPO and albumin secretion was unchanged by the down-regulation of STX3 expression. In parallel to the ELISA data, we performed additional experiments to investigate the effect of STX3 siRNA on the LPS-mediated degranulation in dHL-60 cells (Fig. 6B). Degranulation can be determined by the up-regulation of granule membrane molecules as a consequence of membrane fusion from granules with the plasma membrane [1, 4]. Consequently, LPS-treated cells were analyzed for cell-surface expression of several CD molecules known as degranulation markers, e.g., CD63 for azurophil granules. Consistent with our ELISA results, STX3 siRNA was able to inhibit the presence of CD11b at the plasma membrane ∼65% upon 6 h of LPS stimulation and thus, the release of gelatinase granules in dHL-60 cells. Interestingly, knockdown of STX3 also altered the release of secretory vesicles, represented by the degranulation markers CD13, CD18, and CD45.
Figure 6. Effect of STX3 knockdown in dHL-60 cells on granule exocytosis. (A) Transfected cells were assessed for degranulation by use of MPO, MMP-9, and albumin ELISA kits after 6 h stimulation by LPS (10 ng/ml). As specific granules are absent from dHL-60 cells, LTF was not detected (n.d.) in the supernatants. Cells transfected with a nonsilencing sequence were used as control. Results are expressed in relative degranulation, meaning the ratio between siRNA STX3 (+LPS/−LPS) and control-transfected cells (+LPS/−LPS) ± sem of at least 3 independent experiments. Significantly different from nonsilencing siRNA: **P < 0.01. (B) Degranulation was determined by measuring the expression of CD markers specific for different types of granules at the plasma membrane by flow cytometry. The relative translocation at the plasma membrane of CD markers for each granule was determined by calculating the ratio between MFI of (+LPS/−LPS) of STX3 siRNA-treated dHL-60 cells and (+LPS/−LPS) of nonsilencing, siRNA-treated dHL-60 cells. Data are given as fold control ± sem of at least 3 independent experiments. Significant differences are indicated as follows: **P < 0.01; ***P < 0.001.
Localization of STX3 in dHL-60 cells and human neutrophils
As STX3 knockdown affected the release of IL-1α, IL-1β, IL-12b, and CCL4, we investigated whether STX3 colocalized with organelles from the secretory pathways in dHL-60 cells and human neutrophils. To visualize intracellular proteins, immunofluorescence staining was performed: dHL-60 cells and human neutrophils were double labeled with antibodies against STX3 and markers for the nucleus (DAPI), plasma membrane (CD43), endoplasmic reticulum (CNX), Golgi apparatus (GM130), EEA1, as well as the late endosomes (LAMP-1 and LAMP-2). Localization of STX3 was not observed at any of these subcellular levels in dHL-60 cells (Fig. 7A) and human neutrophils (Fig. 8A).
Figure 7. Intracellular STX3 localization in dHL-60 cells. Colocalization experiments by immunofluorescence staining were performed with STX3 (green); (A) CD43 for plasma membrane, CNX for endoplasmic reticulum, GM130 for Golgi, EEA1 for early endosomes, LAMP-1 and LAMP-2 for late endosomes/lysosomes, (B) MPO for azurophil granules, LTF for specific granules, MMP-9 for gelatinase granules, and TN for secretory vesicles (red); and DAPI for cell nucleus (blue). Original scale bars, 5 μm. Merge confocal images only represent green and red channels to conclude for colocalization. Corresponding scatter plots of the paired intensities of the green (y-axis for STX3 pixels) and red (x-axis for CD43, CNX, GM130, EEA1, LAMP-1, LAMP-2, MPO, LTF, MMP-9, or TN pixels) channels are depicted in the right column for the entire overlay image. PCCs were calculated for both channels in deconvolved z-stack confocal images by AutoQuant X3. Values ≥0.7 were considered strongly positive for colocalization. I, II, III, and IV represent the azurophil, specific and gelatinase granules, as well as secretory vesicles, respectively.
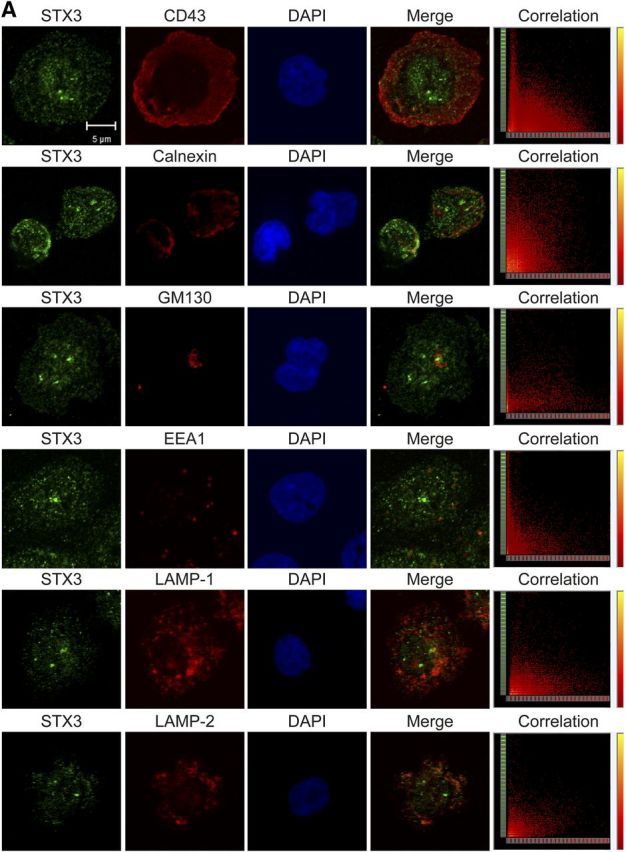

Figure 8. Intracellular STX3 localization in human neutrophils. Colocalization experiments by immunofluorescence staining were performed with STX3 (green); (A) CD43 for plasma membrane, CNX for endoplasmic reticulum, GM130 for Golgi, EEA1 for early endosomes, LAMP-1 and LAMP-2 for late endosomes/lysosomes, (B) MPO for azurophil granules, LTF for specific granules, MMP-9 for gelatinase granules, and TN for secretory vesicles (red); and DAPI for cell nucleus (blue). Original scale bars, 5 μm. Merge confocal images only represent green and red channels to conclude for colocalization. Corresponding scatter plots of the paired intensities of the green (y-axis for STX3 pixels) and red (x-axis for CD43, CNX, GM130, EEA1, LAMP-1, LAMP-2, MPO, LTF, MMP-9, or TN pixels) channels are depicted in the right column for the entire overlay image. PCCs were calculated for both channels in deconvolved z-stack confocal images by AutoQuant X3. Values ≥0.7 were considered strongly positive for colocalization. I, II, III, and IV represent the azurophil, specific and gelatinase granules, as well as secretory vesicles, respectively.


Additional experiments were performed to address the question of whether STX3 was located in the different types of granules. In this view, cells were colabeled with STX3 antibodies and markers for the cytoplasmic granules, namely MPO (azurophil granules), LTF (specific granules), MMP-9 (gelatinase granules), and TN (secretory vesicles). Results show that STX3 was partly colocalized with MMP-9 and TN in the membranes of gelatinase granules and secretory vesicles in dHL-60 cells (Fig. 7B), respectively. In human neutrophils, STX3 was also present in specific granules (Fig. 8B).
The same labeling procedures were performed in dHL-60 cells stimulated for 6 h with 100 ng/ml LPS and neutrophils stimulated for 12 h with 100 ng/ml LPS; STX3 did not relocalize in different organelles upon LPS stimulation (data not shown).
DISCUSSION
Intensive research efforts have focused on the mechanisms leading to the production of proinflammatory, soluble mediators intimately involved in host immunity and the development of inflammatory disorders. Initially, macrophages were described as the major source of cytokines, and neutrophils were considered unable to produce such molecules. Gradually, it became evident that cytokines are also released by neutrophils, which rapidly migrate to the inflammatory sites and play a preponderant role in the activation and recruitment of other cells of the immune system to sites of inflammation [33]. The first cytokine, and certainly the most studied, shown to be produced by human neutrophils, is IL-8 [34]. Later, several studies have indicated that other proinflammatory cytokines, including IL-1β, IL-6, and TNF-α, as well as CCL3, CCL4, and IL-12, are also produced by neutrophils [27], which may display some diversity in terms of expression.
It is primordial to determine undoubtedly the cytokine profile in neutrophils and dHL-60 cells, as controversies subsist on the nature of cytokines secreted by these cells [27]. After LPS stimulation, our data from microarray and qRT-PCR experiments indicated that neutrophils and dHL-60 cells display a similar profile of cytokine mRNA expression (data not shown). Multiplex bead-based immunoassays afford a powerful strategy to detect cytokines sensitively in the extracellular milieu, thereby allowing validation of cytokine expression at the functional level. With the use of the CBA technique, we found that TNF-α, IL-1α, IL-1β, IL-6, IL-12b, CCL2, CCL3, CCL4, CCL5 and IL-8 are released by human neutrophils, highly purified from peripheral blood and dHL-60 cells, confirming the capacity of these 2 cell types to produce and secrete similarly inflammatory mediators. For the first time, we were able to establish the strikingly similar transcriptome and cytokine-secretion profiles in dHL-60 cells and human neutrophils. These results not only validated the attribute of the dHL-60 cell model but also helped us to select significant proinflammatory mediators for further functional investigations in human cells.
The mechanisms underlining cytokine release have been largely elusive, but a few recent studies provided compelling evidence for an essential role of SNARE proteins in the exocytic pathway of myeloid cells. Initially, SNARE proteins have been involved in the process of cytosolic secretory granule fusion and exocytosis of their contents [35, 36]. Thereafter, several studies emphasized the critical role of SNAREs in many kinds of regulated secretory pathways in diverse cell types. In activated immune cells, an abundant increase of SNAREs at the plasma membrane allows the up-regulation of vesicular traffic and secretion of cytokines [37]. Recently, a subset of t-SNAREs (STX4, SNAP23) has been reported to be increased substantially by LPS in a temporal pattern, coinciding with TNF-α peak secretion in activated macrophages. The increased trafficking of TNF-α by overexpression of STX4 provided evidence that up-regulation of STX4 is a necessary event for the TNF-α secretion process [37]. A similar study that uses overexpression of intracellular SNARE proteins showed that STX6 has a rate-limiting role in TNF-α trafficking and secretion [38]. Therefore, we speculated on the contribution of distinct SNAREs in the release of cytokines in human neutrophils.
Microarrays were used in a wider screen to search for all SNARE genes expressed in dHL-60 cells and human neutrophils. In accordance with previous studies, we identified a range of SNAREs in both cell types, among them, diverse t-SNAREs: STX1, -3–7, -9, -11, and -16 [32, 39]. In particular, the expression of STX3 at mRNA and protein levels was up-regulated upon differentiation of HL-60 cells toward neutrophil-like cells, suggesting a functional role of this protein in mature neutrophils. Thus, STX3 has been selected from this screen as a potential regulator of cytokine release. By analyzing the participation of STX3 to cell-specific functional activities, we provide the first evidence of a role of STX3 in the release of 4 particular cytokines (IL-1α, IL-1β, IL-12b, and CCL4) in a model of neutrophils. Even though STX3 had been implicated in the release of de novo-synthesized cytokines IL-8, CCL2, CCL3, and CCL4 by mature human mast cells based on the use of neutralizing antibodies [40], its comparable role may not be obvious in neutrophils. In accordance with the SNARE hypothesis, different SNARE complexes constituted of variable SNARE proteins could be associated with specific functions in different cell types. For example, STX4 acts with VAMP3 in TNF secretion and phagocytosis in macrophages [37, 38], whereas these 2 proteins are involved in degranulation in mast cells [41–44]. It is also conceivable that STX3 interacts with different partners, according to cell types, to control similar or different functions [45]. To support this hypothesis, data established that STX4–SNAP23 forms a complex with VAMP1 or VAMP2, according to the different granule types for directing secretion [11, 32].
The knockdown of STX3 protein led to different inhibition levels on secretion of IL-1α, IL-1β, IL-12b, and CCL4, as well as MMP-9. In fact, the maximal amount of IL-1α and IL-1β was present in the supernatants of dHL-60 cells upon stimulation with 10 ng/ml LPS. IL-12b and CCL4 were maximally secreted upon stimulation with 100 ng/ml LPS. However, the different release pattern of these 4 cytokines does not preclude a role of STX3 in the regulation of the secretion pathway of these cytokines. It remains elusive in which way STX3 is specifically affecting cytokine release; therefore, as a perspective, SNARE partners that form complexes with STX3 and lead to the specific release of these cytokines need to be revealed. Effectively, STX3 can have different SNARE partners to define the specific transport of the cytokines to the extracellular milieu. Alternatively, in neutrophils, a release mechanism, called compound exocytosis, has been described, in which granules fuse in a multivesicular manner with one another in the cytosol before fusion with the plasma membrane or sequentially with the plasma membrane [46]. Thus, STX3 could be involved in the secretion of cytokines with a different release pattern by regulating the fusion between individual vesicles before exocytosis.
Traditionally, neutrophils have been seen as stores of preformed granules, and degranulation has been believed to occur mainly in a short time range, meaning within maximally 2 h upon stimulation [47]. However, this assumption needs to be balanced, as granule mobilization differs on the agonist used (e.g., fMLF, PMA) and its applied concentration. Under our experimental conditions, the maximal degranulation level upon LPS stimulation occurs far later than upon 2 h. In accordance with our ELISA results, flow cytometry analysis confirms the time-dependent degranulation upon LPS stimulation (unpublished results). Furthermore, it is generally admitted that neutrophils have the capacity to store and release loaded cytokines into secretory granules [6]. In dHL-60 cells, our data underline the evidence that STX3 is localized partly in gelatinase granules and secretory vesicles and involved in the regulation of the exocytosis of their components, such as MMP-9. In neutrophils, STX3 colocalizes also with MMP-9, which tends to prove that similar mechanisms involving STX3 for exocytosis may also occur in primary cells. Confirmation of this assumption is necessary but remains challenging, as neutrophils are not amenable for genetic manipulations. Our results show that the knockdown of STX3 affects only MMP-9 release upon 6 h of LPS stimulation. Although STX3 siRNA was not able to trigger inhibition of albumin release, the mobilization of degranulation markers characteristic for secretory vesicles to the plasma membrane was disturbed upon STX3 deficiency (Fig. 6B). As the preponderant role of secretory vesicles is to fuse with the plasma membrane to deliver receptors to the cell surface [1], we can hypothesize that STX3 is nevertheless involved in this phenomenon.
Controversial reports have been published about the expression of MMP-9 in dHL-60 cells [2]. Our data provide clear evidence that 1) MMP-9 mRNA is expressed (Supplemental Fig. 4), 2) MMP-9 protein is expressed in nonstimulated and LPS-stimulated dHL-60 cells (6 h, 100 ng/ml LPS), and 3) MMP-9 protein is time dependently secreted from dHL-60 cells upon stimulation with 100 ng/ml LPS. Additionally, we observed that MMP-9 mRNA expression was up-regulated significantly upon LPS stimulation of dHL-60 cells, pointing out that neutrophil-specific granule proteins are not only preformed but also de novo synthesized (Supplemental Fig. 4). To assess whether dHL-60 cells and neutrophils release MMP-9 similarly, we observed that MMP-9 release levels were not as high in human neutrophils as in dHL-60 cells but were time dependently increased upon LPS stimulation (Supplemental Fig. 4).
According to our results, we can hypothesize on the location of IL-1α, IL-1β, IL-12b, and CCL4 in gelatinase granules before exocytosis. These types of granules may be readily mobilized at the early stages of neutrophil activation, inferring a major role of these 4 cytokines in the initial stage of inflammation. However, confirmation of the subcellular organelle location of IL-1α, IL-1β, IL-12b, and CCL4 still remains a challenge, as no convincing methods to determine the intracellular location of cytokines in neutrophils have been described to our knowledge. Actually, the low amount of cytokines often leads to nonreliable staining by electron microscopy, and other techniques used to document subcellular organelle localization of cytokines have limited resolution (e.g., subcellular fractionation experiments) [48]. Currently, some research groups dedicate efforts to develop more sensitive techniques that would be a significant achievement for the understanding of mechanisms underlining cytokine secretion [49]. Furthermore, as STX3 knockdown induced an ∼50% inhibition in the release of MMP-9 but lower inhibition of IL-1α, IL-1β, IL-12b, and especially CCL4, it remains elusive to which amount the given cytokines could be stored in granules and to which extent the STX3 interaction partners can lead to the specificity of this transport.
We provide evidence that STX3, which has typically been described as a t-SNARE, is localized mainly in granules and secretory vesicles in neutrophils. In line with this result, STX7 has been reported previously to be present in azurophil granule membranes and relocalized to the plasma membrane after cell activation [50]. Although in our experimental conditions, we did not observe any relocalization of STX3 upon LPS stimulation. These findings suggest that STX3 participates in fusion events between a compartment of the secretory pathway and gelatinase granules/secretory vesicles but not with the plasma membrane. As mentioned, at this level, other SNARE partners could be implicated in the STX3-mediated release of IL-1α, IL-1β, IL-12b, and CCL4 and direct vesicle trafficking in a specific manner. Further interaction studies are required to identify partners of STX3 at the compartment of the secretory pathway and characterize potential other SNARE complexes involved in the release of these cytokines.
Although mechanisms for cytokine secretion in neutrophils are still elusive, lines of evidence demonstrated that multiple pathways coexist, in which SNAREs appear to play a fundamental role [5, 46]. These distinct pathways may ensure a spatiotemporal regulation of cytokine release in line with their intended functions during the inflammatory response. The next interesting step is the identification of SNARE interactions and their distribution to determine relevant SNARE complexes dedicated to specific functions of neutrophils in a physiologic state as well as in pathologic conditions. Disruption of SNARE complexes may also offer a window for the development of novel pharmacological molecules for the treatment of chronic inflammatory diseases.
Supplementary Material
ACKNOWLEDGMENTS
Financial support was provided by the University of Luxembourg and CRP-Santé through funds from the Luxembourg Ministry for Higher Education and Research. The authors thank the healthy volunteers for their blood donation, the Croix-Rouge Luxembourgeoise, and the Centre Hospitalier du Luxembourg for their collaboration.
Glossary
- APC
allophycocyanin
- CBA
cytometric bead array
- CD
cluster of differentiation
- CNX
calnexin
- dHL-60
DMSO-differentiated HL-60 cells
- EEA1
early endosome antigen 1
- FC
fold change(s)
- FDR
false discovery rate
- FSC-A
forward-scatter-area
- LAMP-1/2
lysosomal-associated membrane protein 1/2
- LDH
lactate dehydrogenase assay
- LTF
lactoferrin
- MFI
mean fluorescence intensity
- MMP-9
gelatinase B, matrix metallopeptidase-9
- MPO
myeloperoxidase
- PCA
principal component analysis
- PCC
Pearson's correlation coefficient
- qRT- PCR
quantitative RT-PCR
- siRNA
small interfering RNA
- SNAP
synaptosomal-associated protein
- SNARE
soluble N-ethylmaleimide-sensitive factor-attachment protein receptor
- SSC-A/H
side-scatter-area/height
- STX3
syntaxin 3
- t-SNARE
target soluble N-ethylmaleimide-sensitive factor-attachment protein receptor
- TN
tetranectin
- v-SNARE
vesicle soluble N-ethylmaleimide-sensitive factor-attachment protein receptor
- VAMP
vesicle-associated membrane protein
- WT
whole transcript
Footnotes
The online version of this paper, found at www.jleukbio.org, includes supplemental information.
AUTHORSHIP
S.B., E.J.T., and L.V. conceived of, designed, and supervised the experiments. I.N., S.P., and N.N. performed the experiments. I.N., S.P., T.K., and A.M. analyzed the data. S.B. and I.N. wrote the paper.
DISCLOSURES
The authors declare no commercial or financial conflict of interest.
REFERENCES
- 1.Borregaard N., Cowland J. B. (1997) Granules of the human neutrophilic polymorphonuclear leukocyte. Blood 89, 3503–3521. [PubMed] [Google Scholar]
- 2.Le Cabec V., Cowland J. B., Calafat J., Borregaard N. (1996) Targeting of proteins to granule subsets is determined by timing and not by sorting: the specific granule protein NGAL is localized to azurophil granules when expressed in HL-60 cells. Proc. Natl. Acad. Sci. USA 93, 6454–6457. [DOI] [PMC free article] [PubMed] [Google Scholar]
- 3.Almkvist J., Fäldt J., Dahlgren C., Leffler H., Karlsson A. (2001) Lipopolysaccharide-induced gelatinase granule mobilization primes neutrophils for activation by galectin-3 and formylmethionyl-Leu-Phe. Infect. Immun. 69, 832–837. [DOI] [PMC free article] [PubMed] [Google Scholar]
- 4.Cowland J. B., Borregaard N. (1999) The individual regulation of granule protein mRNA levels during neutrophil maturation explains the heterogeneity of neutrophil granules. J. Leukoc. Biol. 66, 989–995. [DOI] [PubMed] [Google Scholar]
- 5.Stanley A. C., Lacy P. (2010) Pathways for cytokine secretion. Physiology (Bethesda) 25, 218–229. [DOI] [PubMed] [Google Scholar]
- 6.Gaudry M., Brégerie O., Andrieu V., El Benna J., Pocidalo M. A., Hakim J. (1997) Intracellular pool of vascular endothelial growth factor in human neutrophils. Blood 90, 4153–4161. [PubMed] [Google Scholar]
- 7.Scapini P., Lapinet-Vera J. A., Gasperini S., Calzetti F., Bazzoni F., Cassatella M. A. (2000) The neutrophil as a cellular source of chemokines. Immunol. Rev. 177, 195–203. [DOI] [PubMed] [Google Scholar]
- 8.Kasama T., Miwa Y., Isozaki T., Odai T., Adachi M., Kunkel S. L. (2005) Neutrophil-derived cytokines: potential therapeutic targets in inflammation. Curr. Drug Targets Inflamm. Allergy 4, 273–279. [DOI] [PubMed] [Google Scholar]
- 9.Söllner T., Whiteheart S. W., Brunner M., Erdjument-Bromage H., Geromanos S., Tempst P., Rothman J. E. (1993) SNAP receptors implicated in vesicle targeting and fusion. Nature 362, 318–324. [DOI] [PubMed] [Google Scholar]
- 10.Uriarte S. M., Rane M. J., Luerman G. C., Barati M. T., Ward R. A., Nauseef W. M., McLeish K. R. (2011) Granule exocytosis contributes to priming and activation of the human neutrophil respiratory burst. J. Immunol. 187, 391–400. [DOI] [PMC free article] [PubMed] [Google Scholar]
- 11.Martín-Martín B., Nabokina S. M., Blasi J., Lazo P. A., Mollinedo F. (2000) Involvement of SNAP-23 and syntaxin 6 in human neutrophil exocytosis. Blood 96, 2574–2583. [PubMed] [Google Scholar]
- 12.Mollinedo F., Martín-Martín B., Calafat J., Nabokina S. M., Lazo P. A. (2003) Role of vesicle-associated membrane protein-2, through Q-soluble N-ethylmaleimide-sensitive factor attachment protein receptor/R-soluble N-ethylmaleimide-sensitive factor attachment protein receptor interaction, in the exocytosis of specific and tertiary granules of human neutrophils. J. Immunol. 170, 1034–1042. [DOI] [PubMed] [Google Scholar]
- 13.Harris P., Ralph P. (1985) Human leukemic models of myelomonocytic development: a review of the HL-60 and U937 cell lines. J. Leukoc. Biol. 37, 407–422. [DOI] [PubMed] [Google Scholar]
- 14.Collins S. J., Gallo R. C., Gallagher R. E. (1977) Continuous growth and differentiation of human myeloid leukaemic cells in suspension culture. Nature 270, 347–349. [DOI] [PubMed] [Google Scholar]
- 15.Carrigan S. O., Weppler A. L., Issekutz A. C., Stadnyk A. W. (2005) Neutrophil differentiated HL-60 cells model Mac-1 (CD11b/CD18)-independent neutrophil transepithelial migration. Immunology 115, 108–117. [DOI] [PMC free article] [PubMed] [Google Scholar]
- 16.Mora-Jensen H., Jendholm J., Fossum A., Porse B., Borregaard N., Theilgaard-Mönch K. (2011) Technical advance: immunophenotypical characterization of human neutrophil differentiation. J. Leukoc. Biol. 90, 629–634. [DOI] [PubMed] [Google Scholar]
- 17.Degel J., Shokrani M. (2010) Validation of the efficacy of a practical method for neutrophils isolation from peripheral blood. Clin. Lab. Sci. 23, 94–98. [PubMed] [Google Scholar]
- 18.Nakatomi K., Aida Y., Kusumoto K., Pabst M. J., Maeda K. (1998) Neutrophils responded to immobilized lipopolysaccharide in the absence of lipopolysaccharide-binding protein. J. Leukoc. Biol. 64, 177–184. [DOI] [PubMed] [Google Scholar]
- 19.Livak K. J., Schmittgen T. D. (2001) Analysis of relative gene expression data using real-time quantitative PCR and the 2(−Delta Delta C(T)) method. Methods 25, 402–408. [DOI] [PubMed] [Google Scholar]
- 20.Dunn K. W., Kamocka M. M., McDonald J. H. (2011) A practical guide to evaluating colocalization in biological microscopy. Am. J. Physiol. Cell Physiol. 300, C723–C742. [DOI] [PMC free article] [PubMed] [Google Scholar]
- 21.Barlow A. L., Macleod A., Noppen S., Sanderson J., Guérin C. J. (2010) Colocalization analysis in fluorescence micrographs: verification of a more accurate calculation of Pearson’s correlation coefficient. Microsc. Microanal. 16, 710–724. [DOI] [PubMed] [Google Scholar]
- 22.Cassatella M. A. (1995) The production of cytokines by polymorphonuclear neutrophils. Immunol. Today 16, 21–26. [DOI] [PubMed] [Google Scholar]
- 23.VanOtteren G. M., Strieter R. M., Kunkel S. L., Paine R. III, Greenberger M. J., Danforth J. M., Burdick M. D., Standiford T. J. (1995) Compartmentalized expression of RANTES in a murine model of endotoxemia. J. Immunol. 154, 1900–1908. [PubMed] [Google Scholar]
- 24.Lord P. C., Wilmoth L. M., Mizel S. B., McCall C. E. (1991) Expression of interleukin-1 alpha and beta genes by human blood polymorphonuclear leukocytes. J. Clin. Invest. 87, 1312–1321. [DOI] [PMC free article] [PubMed] [Google Scholar]
- 25.Kasama T., Strieter R. M., Standiford T. J., Burdick M. D., Kunkel S. L. (1993) Expression and regulation of human neutrophil-derived macrophage inflammatory protein 1 alpha. J. Exp. Med. 178, 63–72. [DOI] [PMC free article] [PubMed] [Google Scholar]
- 26.Lee A., Whyte M. K., Haslett C. (1993) Inhibition of apoptosis and prolongation of neutrophil functional longevity by inflammatory mediators. J. Leukoc. Biol. 54, 283–288. [PubMed] [Google Scholar]
- 27.Cassatella M. A. (1999) Neutrophil-derived proteins: selling cytokines by the pound. Adv. Immunol. 73, 369–509. [DOI] [PubMed] [Google Scholar]
- 28.Tamassia N., Cassatella M. A., Bazzoni F. (2014) Fast and accurate quantitative analysis of cytokine gene expression in human neutrophils. Methods Mol. Biol. 1124, 451–467. [DOI] [PubMed] [Google Scholar]
- 29.Xie L. X., de la Iglesia-Vicente J., Fang Y. X., Mollinedo F. (2009) Expression and subcellular localization of syntaxin 11 in human neutrophils. Inflamm. Res. 58, 407–412. [DOI] [PubMed] [Google Scholar]
- 30.D’Orlando O., Zhao F., Kasper B., Orinska Z., Müller J., Hermans-Borgmeyer I., Griffiths G. M., Zur Stadt U., Bulfone-Paus S. (2013) Syntaxin 11 is required for NK and CD8⁺ T-cell cytotoxicity and neutrophil degranulation. Eur. J. Immunol. 43, 194–208. [DOI] [PMC free article] [PubMed] [Google Scholar]
- 31.Nabokina S. M. (2001) Intracellular localization of VAMP-1 protein in human neutrophils. Bull. Exp. Biol. Med. 131, 130–131. [DOI] [PubMed] [Google Scholar]
- 32.Mollinedo F., Calafat J., Janssen H., Martín-Martín B., Canchado J., Nabokina S. M., Gajate C. (2006) Combinatorial SNARE complexes modulate the secretion of cytoplasmic granules in human neutrophils. J. Immunol. 177, 2831–2841. [DOI] [PubMed] [Google Scholar]
- 33.Nathan C. (2006) Neutrophils and immunity: challenges and opportunities. Nat. Rev. Immunol. 6, 173–182. [DOI] [PubMed] [Google Scholar]
- 34.Altstaedt J., Kirchner H., Rink L. (1996) Cytokine production of neutrophils is limited to interleukin-8. Immunology 89, 563–568. [DOI] [PMC free article] [PubMed] [Google Scholar]
- 35.Herrero-Turrión M. J., Calafat J., Janssen H., Fukuda M., Mollinedo F. (2008) Rab27a regulates exocytosis of tertiary and specific granules in human neutrophils. J. Immunol. 181, 3793–3803. [DOI] [PubMed] [Google Scholar]
- 36.Pivot-Pajot C., Varoqueaux F., de Saint Basile G., Bourgoin S. G. (2008) Munc13-4 regulates granule secretion in human neutrophils. J. Immunol. 180, 6786–6797. [DOI] [PubMed] [Google Scholar]
- 37.Pagan J. K., Wylie F. G., Joseph S., Widberg C., Bryant N. J., James D. E., Stow J. L. (2003) The t-SNARE syntaxin 4 is regulated during macrophage activation to function in membrane traffic and cytokine secretion. Curr. Biol. 13, 156–160. [DOI] [PubMed] [Google Scholar]
- 38.Murray R. Z., Wylie F. G., Khromykh T., Hume D. A., Stow J. L. (2005) Syntaxin 6 and Vti1b form a novel SNARE complex, which is up-regulated in activated macrophages to facilitate exocytosis of tumor necrosis factor-alpha. J. Biol. Chem. 280, 10478–10483. [DOI] [PubMed] [Google Scholar]
- 39.Martín-Martín B., Nabokina S. M., Lazo P. A., Mollinedo F. (1999) Co-expression of several human syntaxin genes in neutrophils and differentiating HL-60 cells: variant isoforms and detection of syntaxin 1. J. Leukoc. Biol. 65, 397–406. [DOI] [PubMed] [Google Scholar]
- 40.Frank S. P., Thon K. P., Bischoff S. C., Lorentz A. (2011) SNAP-23 and syntaxin-3 are required for chemokine release by mature human mast cells. Mol. Immunol. 49, 353–358. [DOI] [PubMed] [Google Scholar]
- 41.Pombo I., Rivera J., Blank U. (2003) Munc18-2/syntaxin3 complexes are spatially separated from syntaxin3-containing SNARE complexes. FEBS Lett. 550, 144–148. [DOI] [PubMed] [Google Scholar]
- 42.Paumet F., Le Mao J., Martin S., Galli T., David B., Blank U., Roa M. (2000) Soluble NSF attachment protein receptors (SNAREs) in RBL-2H3 mast cells: functional role of syntaxin 4 in exocytosis and identification of a vesicle-associated membrane protein 8-containing secretory compartment. J. Immunol. 164, 5850–5857. [DOI] [PubMed] [Google Scholar]
- 43.Puri N., Roche P. A. (2006) Ternary SNARE complexes are enriched in lipid rafts during mast cell exocytosis. Traffic 7, 1482–1494. [DOI] [PubMed] [Google Scholar]
- 44.Vaidyanathan V. V., Puri N., Roche P. A. (2001) The last exon of SNAP-23 regulates granule exocytosis from mast cells. J. Biol. Chem. 276, 25101–25106. [DOI] [PubMed] [Google Scholar]
- 45.Stow J. L., Low P. C., Offenhäuser C., Sangermani D. (2009) Cytokine secretion in macrophages and other cells: pathways and mediators. Immunobiology 214, 601–612. [DOI] [PubMed] [Google Scholar]
- 46.Lollike K., Lindau M., Calafat J., Borregaard N. (2002) Compound exocytosis of granules in human neutrophils. J. Leukoc. Biol. 71, 973–980. [PubMed] [Google Scholar]
- 47.Bentwood B. J., Henson P. M. (1980) The sequential release of granule constitutents from human neutrophils. J. Immunol. 124, 855–862. [PubMed] [Google Scholar]
- 48.Pasquali C., Fialka I., Huber L. A. (1999) Subcellular fractionation, electromigration analysis and mapping of organelles. J. Chromatogr. B Biomed. Sci. Appl. 722, 89–102. [DOI] [PubMed] [Google Scholar]
- 49.Lacy P., Stow J. L. (2011) Cytokine release from innate immune cells: association with diverse membrane trafficking pathways. Blood 118, 9–18. [DOI] [PubMed] [Google Scholar]
- 50.Xie L. X., Calafat J., Janssen H., de la Iglesia-Vicente J., Mollinedo F. (2010) Intracellular location of syntaxin 7 in human neutrophils. Immunol. Lett. 129, 72–77. [DOI] [PubMed] [Google Scholar]
Associated Data
This section collects any data citations, data availability statements, or supplementary materials included in this article.