

Abstract
In addition to direct assessment of high energy phosphorus containing metabolite content within tissues, phosphorus magnetic resonance spectroscopy (31P-MRS) provides options to measure phospholipid metabolites and cellular pH, as well as the kinetics of chemical reactions of energy metabolism in vivo. Even though the great potential of 31P-MR was recognized over 30 years ago, modern MR systems, as well as new, dedicated hardware and measurement techniques provide further opportunities for research of human biochemistry. This paper presents a methodological overview of the 31P-MR techniques that can be used for basic, physiological, or clinical research of human skeletal muscle and liver in vivo. Practical issues of 31P-MRS experiments and examples of potential applications are also provided. As signal localization is essential for liver 31P-MRS and is important for dynamic muscle examinations as well, typical localization strategies for 31P-MR are also described.
Keywords: Phosphorus magnetic resonance spectroscopy, Energy metabolism, Skeletal muscle, Liver, Exercise-recovery, Saturation transfer
List of abbreviations
- 1H-MRS
proton magnetic resonance spectroscopy
- 31P-MRS
phosphorus magnetic resonance spectroscopy
- 31P-MRSI
phosphorus magnetic resonance spectroscopic imaging
- ADP
adenosine-diphosphate
- AMARES
advanced method for accurate, robust, and efficient spectral fitting
- AMESING
adiabatic multi echo spectroscopic imaging
- ATP
adenosine-triphosphate
- BISTRO
B1-insensitive train to obliterate
- CK
creatine-kinase
- Cr
creatine
- CSDE
chemical shift displacement error
- CSI
chemical shift imaging
- cST
continuous irradiation saturation transfer
- DANTE
delays alternating with nutations for tailored excitation
- DC
direct current
- DRESS
depth-resolved surface coil MRS
- FA
flip angle
- FAST
four-angle saturation transfer
- FID
free induction decay
- G6P
glucose-6-phosphate
- GPC
glycerol-phosphocholine
- GPE
glycerol-phosphoethanolamine
- INEPT
insensitive nuclei enhanced by polarization transfer
- IR
inversion recovery
- ISIS
image-selected in vivo spectroscopy
- IT
inversion transfer
- MT
magnetization transfer
- MVC
maximal voluntary capacity
- NAD (NAD+, NADH)
nicotinamide adenine dinucleotide (its oxidized and reduced form, respectively)
- NAFLD
non-alcoholic fatty liver disease
- NASH
non-alcoholic steatohepatitis
- NET
non-equilibrium thermodynamic
- NOE
nuclear Overhauser effect
- OVS
outer-volume saturation
- PAD
peripheral arterial disease
- PC
phosphocholine
- PCr
phosphocreatine
- PDE
phosphodiesters
- PE
phosphoethanolamine
- Pi (Pi2)
inorganic phosphate (alkaline/mitochondrial Pi)
- prST
progressive saturation transfer
- pST
pulsed saturation transfer
- PtdC
phosphatidylcholine
- RF
radio-frequency
- semi-LASER
slice-selective excitation with localization by adiabatic selective refocusing
- SNR
signal-to-noise ratio
- ST
saturation transfer
- STEAM
stimulated echo acquisition mode
- SVS
single-voxel spectroscopy
- tCr
total creatine
- TE
echo time
- TR
repetition time
- TRiST
triple repetition time saturation transfer
- TwiST
two-repetition time saturation transfer
- UDPG
uridine diphosphate glucose
- VOI
volume of interest
1. Introduction
Phosphorus magnetic resonance spectroscopy (31P-MRS) and spectroscopic imaging (31P-MRSI) offer unique, non-invasive windows into the metabolism of human tissues [1], [2], [3]. In addition to the information contained within the static spectra, 31P-MRS also provides techniques for the assessment of the rates of chemical reactions that are involved in energy metabolism [4], [5]. Of particular interest is also the possibility to investigate the oxidative energy production by mitochondria in skeletal muscle during exercise and subsequent recovery [6], [7]. The current progress in MR hardware, represented by the ultra-high magnetic field strength of in vivo MR systems and improved dedicated radio-frequency (RF)-coil technology, provides significant benefits for 31P-MRS, and therefore, attracts many scientists to explore its potential.
This review provides an overview of the current status of in vivo 31P-MRS with a focus on the techniques for energy metabolism measurement applied to human skeletal muscle and liver. Aspects of static spectra acquisition, dynamic muscle experiments, and saturation transfer (ST) methods are discussed. Fig. 1 depicts the covered topics and their associations.
Fig. 1.

An overview of the biochemical parameters (orange) assessed and quantified through in vivo 31P-MRS/MRSI experimental approaches reviewed and discussed in the text (violet) in the organs of interest, i.e. skeletal muscle and liver, (red).
1.1. Information content of the 31P-MR spectrum
The dominant metabolite signal in the 31P-MR spectrum is singlet of the phosphorylated form of creatine (Cr), i.e. phosphocreatine (PCr). The high energy phosphate bond in PCr serves as a rapidly available energy reserve, ready to replenish energy catalyzed from adenosine-triphosphate (ATP) during increased energy expenditure. ATP contains three non-equivalent phosphate groups (α-, β-, and γ-) that differ in their resonance frequencies, which yield three individual signals in the 31P-MR spectra. As the phosphate nuclei in ATP interact with other nearby spins, i.e. undergo so-called homonuclear J-coupling, line splitting of the ATP signals can be observed, which forms doublets for α- and γ-ATP, and a triplet for β-ATP. Another important metabolite visible in the 31P-MRS spectrum is inorganic phosphate (Pi), which also serves as a substrate or product in chemical reactions of energy metabolism. Fig. 2 (left) depicts typical in vivo 31P-MR spectra from human skeletal muscle and Fig. 2 (right) depicts typical 31P-MR spectra from human liver. The main difference between these two spectra is obvious: there is no PCr signal in healthy liver.
Fig. 2.

Typical 31P-MR spectra acquired at 3 T (top) and 7 T (bottom), at rest, in skeletal muscle (left) and liver tissue (right). All spectra are depicted relative to the resonance frequency of phosphocreatine (PCr), although this is not present in healthy human liver tissue. Phosphorus metabolites common to both tissues include resonance lines of adenosine-triphosphate (ATP), nicotinamide adenine dinucleotide (NADH), phosphodiesters (PDEs) – glycerol-phoshocholine (GPC) and glycerol-phosphoethanolamine (GPE), inorganic phosphate (Pi) and phosphomonoesters (PMEs) – phosphocholine (PC) and phopshoethanolamine (PE). Note that PDEs and PMEs are readily resolved at 7 T. Another metabolite resolved in the muscle at 7 T is the recently described alkaline Pi (Pi2) pool. The liver spectrum, on the other hand, contains a resonance line of uridine diphosphate glucose (UDPG) and also a recently assigned spectral line of the bile component phosphatidylcholine (PtdC). Note that, due to the large frequency range at 7 T and the in vivo linewidth, the J-coupling of the ATP resonances is no longer resolved and the frequency limitations of the excitation pulse cause the β-ATP frequency line to be suppressed.
Other detectable 31P metabolites include cell membrane precursors, i.e. phosphomonoesters (PMEs) and cell membrane degradation products, i.e. phosphodiesters (PDEs). The major contributors to the PME signal in vivo are phosphocholine (PC) and phosphoethanolamine (PE), while the main PDEs are glycerol-phosphocholine (GPC) and glycerol-phosphoethanolamine (GPE). In skeletal muscle, however, the contribution of GPE is only minimal and the main PDE signal is, therefore, GPC (Fig. 2a). Recently, an additional phospholipid signal, i.e. phosphatidylcholine (PtdC), was recognized in the human liver spectra, which presumably originates from bile, and its assessment could potentially hold diagnostic value in bile duct and liver disorders [8]. Nicotinamide adenine dinucleotide (NAD) in its oxidized and reduced form (NAD+ and NADH, respectively) and uridine diphosphate glucose (UDPG) can be also detected in 31P-MR spectra, particularly when using ultra-high fields, such as 7 T.
The amount of visible phosphorus-containing metabolites constitutes important, but not the only information that can be gained from the analysis of 31P-MR spectra. The concentration of adenosine-diphosphate (ADP) is under physiological conditions too low to be detectable by in vivo MRS. However, as will be shown later, ADP can be indirectly calculated using information about PCr, ATP, and Cr, due to its involvement in the creatine-kinase (CK) reaction. Equally, the detection of glucose-6-phosphate (G6P) in skeletal muscles in vivo is severely hampered by its low tissue concentration under normoglycemic-normoinsulinemic conditions and its spectral overlap with other PME signals. However, increase in G6P levels during either euglycemic- or hyperglycemic-hyperinsulinemic clamp can be quantified by subtracting the initial resting spectra [9], [10], [11]. The chemical environment of phosphate nuclei in compounds, which defines their resonance positions in 31P MR spectra, may change with physiological or pathological conditions. These variations can be, in turn, used to indirectly define the actual physiological conditions under which the spectrum was acquired. Of particular importance is the effect of pH on the exact spectral resonance position of inorganic phosphate (Pi) [12]. While the position of the PCr peak remains constant, Pi resonance changes with pH. Thus, the chemical shift difference between PCr and Pi (δ) can be used to derive pH values using the modified Henderson-Hasselbach equation:
| (1) |
where pKA = 6.75 is the dissociation constant of Pi, δHA = 3.27 is the chemical shift of the protonated form of Pi, and δA = 5.63 is the chemical shift of the non-protonated form of Pi. As the dominant signal for Pi in the skeletal muscle spectra arises from sarcoplasm, it is the intramyocellular pH that can be determined in this way [7]. Another physiological condition that may influence the resonance positions of 31P metabolites is the cellular content of free Mg2+, which plays an important role in diverse intracellular biochemical reactions. In particular, the Mg2+ complexes of ADP and ATP act as substrates for ATPases and kinases. The amount of free Mg2+ can be calculated from the chemical shift between β-ATP and α-ATP [13] or from the chemical shift between β-ATP and PCr [14].
1.2. Particular differences and technical requirements compared to proton (1H)-MRS
31P-MRS cannot compete with the abundant 1H-MRS in signal sensitivity; however, it has other advantages. Next to its already mentioned ability to measure pH or quantify ADP and Mg2+ concentrations, 31P-MRS disposes a significantly larger spectral width, leading to better separation of metabolites. In particular, PC, PE, and GPC that are readily separated in 31P-MR spectra are all choline-containing compounds that cannot be differentiated by 1H-MRS in vivo. There is also no dominant water or fat signal present in the 31P-MR spectra, and thus, no frequency-selective suppression techniques are necessary. Another difference is the spin lattice relaxation dependence on the external magnetic field. While, for 1H-MRS, the leading relaxation mechanism is the magnetic dipole-dipole interaction, the relaxation of 31P metabolites is strongly influenced by a competing mechanism called chemical shift anisotropy, which prevails at higher field strengths [15], [16].
The main difference lies, however, in its Larmour frequency (ω0). As all clinical MR systems focus on the use of 1H nuclei for clinical imaging, they are tuned for the ω0 of 1H. Thus, to be able to use these systems for 31P-MR, additional hardware, i.e. a broadband transmitter and a receiver, as well as RF-coils, is necessary. To compensate for the low sensitivity of MR systems to 31P, surface coils that offer very high sensitivity in their close vicinity are often applied for organ-specific 31P-MR investigations [17], [18], [19], [20]. These are commonly constructed as simple single loops; however, several complex coil-arrays that provide higher sensitivity and better volume coverage have been introduced recently [21], [22], [23], [24]. While the receive sensitivity of such RF-probes is undoubtedly superior, their transmit efficiency, particularly at ultra-high fields, may be insufficient [23], [25]. The inhomogeneous excitation profiles of these RF-coils introduce strong flip-angle (FA) variability, which can significantly influence the quantification of 31P-MRSI data. To be able to correct for this spatial distribution, exact knowledge of the FA map is required. Techniques reported recently have been developed especially for FA mapping of 31P RF-coils at high fields [26], [27], where simulations and phantom replacement techniques might become unreliable.
The combination of the receive sensitivity of modern coil-arrays with the transmit power, B1 homogeneity, and volume coverage of volume coils, e.g., the recently proposed volume coil for 7 T [28], could, in the future, constitute a prime tool for 31P-MR at ultra-high fields.
1.3. How to improve the quality of 31P-MR spectra
Undoubtedly, similar to 1H-MRS, high homogeneity of the static magnetic field B0 increases the quality of the 31P-MR spectra. Still, there are also other options for further improving the spectral resolution and/or signal-to-noise ratio (SNR) of the 31P-MRS data.
Analogously to the already mentioned homonuclear spin coupling in ATP, there are also heteronuclear interactions between phosphate and proton spins in many other phosphorus-containing metabolites. This 1H—31P heteronuclear coupling broadens the resonance lines, particularly of PDEs and PMEs compounds, in the in vivo spectra. Applying RF irradiation at the 1H frequency during 31P signal acquisition can effectively decouple these interactions, yielding narrower and higher spectral lines [29]. Broadband 1H decoupling allows for separate quantification of metabolites that contribute to overall PDE and PME signals, which otherwise cannot be separated at lower fields (B0 ≤ 3 T), i.e. GPC and GPE, as well as PC and PE. As nothing is free in MRS, this increase in spectral resolution comes at the cost of increased power deposition, i.e. specific absorption rate (SAR), due to the long, intense RF-pulses used for 1H decoupling.
Another option for signal enhancement is the utilization of the nuclear Overhauser effect (NOE) to transfer magnetization from 1H to the 31P nuclei. Using the NOE, through 1H RF-irradiation during the 31P inter-pulse delay, the detection sensitivity for 31P can be increased up to about 80% at lower fields in skeletal muscle [30]. The reported increase of up to 44% in brain [31] and prostate [32] in 31P-MR signal at ultra-high fields cannot be directly transferred to skeletal muscle or liver, due to the NOE dependence on the tissue of interest. It is also important to note that the effect is metabolite-specific, and therefore, individual correction factors must be applied for reliable quantification. Similar to 1H decoupling, the NOE leads to significant power deposition, increasing SAR and limiting its use at ultra-high fields.
A further technique for the enhancement of 31P sensitivity is the insensitive nuclei enhanced by polarization transfer (INEPT) [33]. Polarization of the excited 1H spins is transferred through heteronuclear spin coupling to the 31P spins, e.g., in PMEs and PDEs. This happens during the period TE1H period, which has to be relatively long for optimal effect, thus, causing counteracting signal loss due to T2 relaxation. This can be partially compensated by the use of short TRs, utilizing the large T1 differences between 31P and 1H spins [34]. Similarly, adiabatic multi echo spectroscopic imaging (AMESING [35]) could be used to regain the sensitivity lost due to T2∗ losses [36].
A very important improvement in 31P-MR spectral quality, in terms of more than double the SNR and spectral resolution, comes through the use of ultra-high field MR systems (B0 ≥ 7 T) [15], [16], [18], [31], [37], [38]. Additional SNR per unit of time can be gained due to the shortening of the T1 relaxation times of phosphorus metabolites at 7 T [15], [38]. This is due to the previously mentioned chemical shift anisotropy dominance over the relaxation of 31P metabolites at 7 T [15]. The increase in SNR at ultra-high fields can be, in turn, exchanged for higher spatial or temporal resolution for time-demanding experiments, such as ST [39]. Therefore, ultra-high field MR systems (B0 ≥ 7 T) hold great potential for investigations of the not yet well-understood mechanisms of human energy metabolism.
1.4. Spectral processing
Next to the acquisition of high-quality data, the application of an appropriate processing technique is required to obtain reliable results. Prior to the actual quantification, the acquired data have to be pre-processed. The main 31P-MR spectra pre-processing step is the zero-order phase and the first-order phase correction. Data filtering is typically avoided during pre-processing and is used only for spectra visualization. A special case is a filter that does not cause any line broadening, e.g., a so-called line-width matched filter, which is occasionally applied in case of very-low SNR data [40]. Zero filling is also used to pre-process individual 31P-MR spectra. It is more commonly used in MRSI acquisition to zero-fill in the k-space during matrix interpolation.
A frequent quantification approach constitutes the application of a time domain fitting algorithm, which incorporates prior knowledge for improved spectral fitting. In particular, the advanced method for accurate, robust, and efficient spectral fitting (AMARES) routine [41] offers high flexibility of the fitting parameters and is, therefore, most commonly used for the analysis of 31P-MR spectra. AMARES is freely available as a part of the jMRUI software package [42], or as a MATLAB (Mathworks Inc, Natick, MA) function [43]. The possibility to include prior knowledge, e.g., resonance frequency and/or linewidth, and thus constrain the fitting parameters, can significantly improve/influence fitting performance. It is, therefore, important to clearly state any restrictive prior knowledge when reporting study results.
1.4.1. Quantification – relative vs. absolute
In addition to quality measures, e.g., SNR, linewidth of the peak (reflecting the quality of the shim), and the Cramer-Rao Lower Bound (quality of the spectral fitting), the results of spectral analysis include information about the first point of the free induction decay (FID), the amplitude of which is directly proportional to the area (integral) of the metabolite peak. It is common practice to publish the results of in vivo MRS, especially in the clinical field, as metabolite ratios. However, metabolite ratios cannot provide unambiguous information about metabolic changes, as encountered in many disorders and pathology studies with in vivo MRS. In order to achieve reliable statements about metabolic changes, it is crucial that absolute concentrations are obtained.
MRS can, in principle, be used to assess absolute concentrations in mmol L−1 or μmol g−1 of tissue in vivo. It is based on the fact that the thermal equilibrium magnetization, M0, is directly proportional to the number of spins (n), which is proportional to the molar concentration, and is given by the equation:
| (2) |
where γ is gyromagnetic ratio, h is the Planck constant, k is the Boltzmann constant, and T is absolute temperature.
In an MRS experiment, the acquired metabolite signal, Smet, is not directly M0, but depends on many experiment-specific factors:
| (3) |
where NA is the number of averages, RG is the receiver gain, [cmet] is the molar concentration of the metabolite, V is the volume size, and fseq and fcoil are functions that describe the signal modulations due to the pulse sequence and RF coil used, respectively. fseq depends on the repetition time (TR), the echo-time (TE), the number and type of RF pulses and on the T1 and T2 relaxation times. fcoil accounts for factors related to the quality and the geometry of the RF-coil (e.g., the quality factor Q and filling factor). Direct calculation of the metabolite concentration [cmet] from the detected signal, Smet, is not possible, because some of the coil-related factors in the fcoil function are unknown. Therefore, all quantification methods utilize a calibration or reference compound of known concentration [cref] to which the metabolite signals are referenced. The metabolite concentration can be then calculated according to:
| (4) |
where Sref is the signal detected from the reference compound and CMR is a correction factor accounting for differences in relaxation times, γ, diffusion, magnetic susceptibility, spatial position relative to the coil, and, in general, any other differences between the reference compound and the metabolite.
Generally, there are three approaches to convert relative numbers to absolute concentrations [44], [45], [46]. The first approach uses an internal concentration reference, which can be established from a stable metabolite that occurs naturally in the tissue. The second approach utilizes an external concentration reference positioned outside the object under investigation, but within the sensitive area of the coil. The third approach also uses an external concentration reference, which is, however, measured in a separate experiment. This is known as the phantom replacement technique.
A quantitative review of 31P MRS absolute quantification in muscle, published recently [47], concluded that, in healthy human muscle, metabolite concentrations can be safely obtained from uncalibrated 31P MRS measurements using muscular ATP concentration, which is assumed to be stable ([ATP] ≈ 5.5 mmol/kg wet weight ≈ 8.2 mmol/L cell water [48], [49], [50], [51]), as an internal concentration reference. Whether this is also the case in muscle affected by disease remains to be shown in further studies.
For quantification of the molar concentration of the 31P metabolites in human liver, it is essential to avoid skeletal muscle contamination. Therefore, it is very common to use techniques to select a volume in this organ [52], [53], [54], [55], [56], [57], [58], [59], [60], including the suppression of signal from abdominal muscle. Investigations on MR systems at 1.5 T reported highly discrepant hepatic metabolite concentrations, which was later investigated and attributed to T1 dependent saturation losses, as well as to differences in post-processing and quantification methods [59]. Recent studies with improved data quality at 3 T resulted in better reproducibility in a clinically acceptable time of around 30min [53], [54].
2. 31P-MRS of skeletal muscle
Because of its high metabolic activity, physiological importance, and relatively simple access, skeletal muscle of the lower or upper leg was the first human tissue studied by 31P-MRS in vivo [2], [61], [62]. These experiments confirmed the results of animal studies, which suggested that 31P-MRS can probe the human energy metabolism non-invasively [1] and encouraged numerous subsequent investigations. Next to the analysis of resting 31P-MR spectra, of particular interest is the possibility of obtaining the 31P-MR spectra in a dynamic fashion, with sufficient time resolution during an exercise challenge and consecutive recovery [2], [63]. The option to measure the dynamics of important chemical reactions in vivo through a magnetization transfer technique further increases the impact of 31P-MRS. All of these techniques are described in more detail in the next paragraphs, and although a detailed justification of the clinical implications of 31P-MRS is out of the scope of this methodological review, a few examples of its applications are provided to demonstrate its potential.
2.1. 31P-MRS of resting muscle
The most straightforward application of 31P-MRS is the acquisition of spectral transients at rest. The exact number of the transients depends on the parameters of the sequence used and on the required SNR. SNR enhancement techniques, e.g., NOE or 1H decoupling, described above, can be also applied, but have implications for the quantification of metabolites. The quantification (either relative or absolute) of such static 31P-MR spectra can be used to gather information about skeletal muscle fiber composition or the assessment of training status/fitness. Changes in relative 31P metabolite concentrations, i.e. a drop in PCr and an increase in Pi, were also observed in patients with mitochondrial myopathy [64], [65]. Increased levels of PDE measured at rest can be indicative of congenital lipodystrophy [66], fibromyalgia [67], or muscular dystrophies [68], [69]. It is also worth mentioning that changes in PCr/Pi or total (PCr+Pi) levels after exercise were attributed to muscle damage caused by a strenuous lengthening exercise [70]. And, as such damage may persist for two weeks, static 31P-MRS might potentially offer a tool for the non-invasive monitoring of muscle fitness during recuperation.
2.1.1. Muscle fiber composition
Skeletal muscles consist of a large number of muscle fibers. These can differ in their contractile (slow-twitch vs. fast-twitch) and metabolic (oxidative vs. glycolytic) properties. In humans, three main fiber groups have been defined [71]. Type I or slow-twitch oxidative fibers heavily rely on the oxidative capacity of the mitochondria and a high triglycerides reserve. Type IIb or fast-twitch glycolytic fibers demonstrate high ATPase activity and high glycolytic capacity, and Type IIa fast-twitch oxidative glycolytic fibers with mixed high oxidative and glycolytic activities [72]. The proportion of the fiber types within the muscle can be influenced by training [73], [74] and defines the main metabolic activity and influences the performance of the muscle in short and long challenges [75]. Although a muscle biopsy can provide information about fiber-type composition, the limited sample size and its invasive nature hinders large-scale use, particularly in repetitive studies.
Experiments performed on lower mammals, i.e. mice, rats and cats, showed that the muscle fibers differ in their content of energy-rich phosphates [76], [77]; therefore, 31P-MRS has been suggested as an alternative, non-invasive approach to muscle biopsy for the determination of fiber-type composition in human muscles. And, although several human studies have also found significant, but much smaller, differences in basal concentrations of PCr and/or Pi (or their ratio) between muscles containing mainly slow-twitch or fast twitch fibers, the scattering in metabolite content observed is large and the final conclusions vary [78], [79], [80], [81], [82], [83], [84], [85], [86], [87], [88]. This inconsistency complicates the straightforward use of resting 31P-MRS for muscle fiber composition determination, and potentially suggests that the basal phosphate content in humans does not correlate well with the defined muscle fiber classification [84].
2.1.2. 31P-MRS at rest and training status
31P-MRS of skeletal muscle at rest has been extensively used to assess training status. Fiber-type composition was suggested as a potential marker of muscles fitness, as sedentary subjects rely mostly on fast-twitch Type IIb fibers, but, these studies, again, led to contradictory results [83], [84], [89].
A different approach toward the characterization of training status from static spectra is the use of the concentration of the cell membrane phospholipids - phosphodiesters [50], [83], [90], [91], [92]. At ultra-high fields (i.e., 7 T), or by using 1H decoupling, the main phosphodiester in human skeletal muscle – GPC – can be separately evaluated and used directly rather than the total PDE signal [92]. A sedentary lifestyle, in particular, if accompanied by overweight, gives rise to significantly higher PDE levels [92]. This difference cannot be explained through the relation of PDE to body mass index [50], [92] alone, as the PDE levels were also shown to relate directly to energy metabolism of skeletal muscle, measured by dynamic or transfer-related 31P-MRS techniques [50], [92]. Increased PDE levels, although to a much lesser extent, have been also reported in professional cyclists [90], [91] in comparison to normally trained students. Long-distance runners also exhibit higher PDE levels than sprinters [83]. Of note is the age dependence of the muscular PDE content. As the PDE level tends to increase with age [50], [92], [93], special care has to be taken for age-matching of study participants, when PDE content is to be used as a marker of muscle fitness. Nevertheless, the concentration of muscle PDE (or GPC) measured at rest provides valuable information about training status.
A very recent approach for the determination of training status from resting 31P-MR spectra profits from the increased spectral resolution of the ultra-high field systems (i.e., 7 T), where an alkaline pool of Pi signal (Pi2) can be identified [94]. Based on its chemical shift (∼5.1 ppm), relatively short T1, and small contribution of extracellular space to skeletal muscle signal, the mitochondrial matrix has been recognized as the likely origin of this pool [94]. As such, it should be able to provide direct information about changes in mitochondrial density in response to training or defects of mitochondrial metabolism. A comparative study [95] showed an increased Pi2/Pi ratio in the quadriceps of the trained subjects (Fig. 3), and, thus, supported this hypothesis. Significantly lower Pi2 concentrations and Pi2/Pi ratios have also been reported in the overweight-to-obese sedentary subjects when compared to a group of lean, active individuals [92].
Fig. 3.
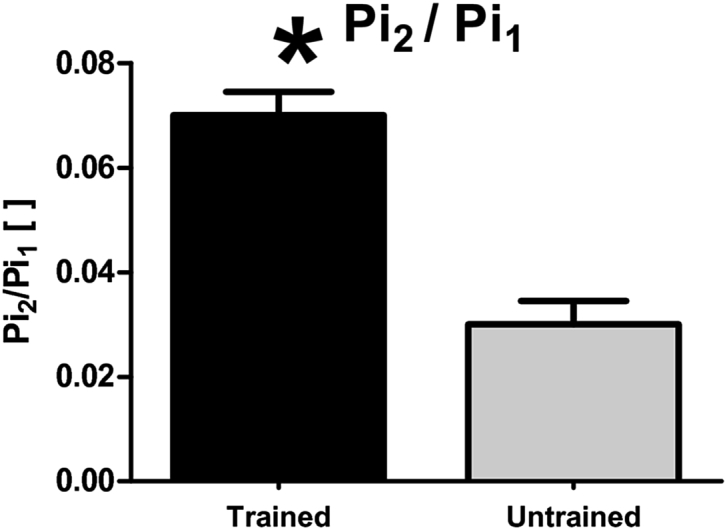
Bar plot showing a significantly higher Pi2/Pi (marked here as Pi2/Pi1) in the endurance trained athletes compared to the normal physical active group. Similarly, the Pi2/Pi was found lower in overweight-to-obese sedentary subjects than in lean, active individuals [92]. Figure was reproduced from Ref. [95].
2.2. Dynamic 31P-MRS during exercise-recovery challenge
31P-MRS measurement of the kinetics of intramyocellular pH and of the cytosolic concentrations of PCr, Pi, and ADP during perturbations of metabolic equilibrium can be generalized as dynamic 31P-MRS. The disturbance in metabolic balance is usually achieved through muscle contraction and recovery. Unlike in static investigations, a low number of transients (commonly just one) is used in dynamic examinations due to the high temporal resolution required (on the order of seconds). Through the measurement of post-exercise recovery, dynamic 31P-MRS allows direct investigation of the pH homeostasis, as well as of the oxidative ATP synthesis regulation in relation to ATP demand [6], [63], [96], [97]. Therefore, if technically possible, dynamic 31P-MRS is the method of choice for the investigation of the mitochondrial metabolism of skeletal muscle in vivo.
Examinations of the oxidative metabolism of the skeletal muscles provide not only important information about muscle physiology [3], but can also be used to observe the effects of aging [98], [99] and/or to help define the training status [51], [92]. In addition, dynamic 31P-MR examinations can identify mitochondrial defects in muscular diseases, such as Duchenne's muscular dystrophy [100] or mitochondrial myopathy [101]. Furthermore, dynamic 31P-MRS could uncover decreased oxidative metabolism of skeletal muscle in patients with diabetes mellitus [102], [103], [104], heart failure [105], or peripheral arterial disease [106], [107], [108].
2.2.1. Underlying physiology
A detailed description of the underlying physiology is out of the scope of this review and has been recently reviewed elsewhere [6]. Here, we provide only a brief introduction that is essential for an understanding of the role of dynamic 31P-MRS in examinations of skeletal muscle oxidative metabolism, along with the necessary equations for its basic evaluation.
The immediate source of energy for muscle contractions is the hydrolysis of ATP into ADP and Pi:
| (5) |
During exercise, this reaction is driven mainly by the force-generating role of the myosin ATPase enzyme and also partially by other ATPases involved in Ca2+ homeostasis. The ATP pool within the muscle tissue is limited, and therefore, would only last for a brief period of contractile activity. ATP is in skeletal muscle produced either by glycolytic conversion of glucose to lactate (anaerobic respiration) or by oxidative phosphorylation (aerobic respiration). The latter is preceded by entering carbons from the glycolytic pathway via acetyl coenzyme A into the TCA cycle, and subsequent oxidation of NADH in the mitochondria. As both of these pathways require some time to start, any temporary mismatch between ATP demand and supply is compensated by immediate consumption of energy reserves stored in PCr.
| (6) |
This temporal buffering reaction, catalyzed by the creatine-kinase (CK) enzyme, ensures that ATP concentration is virtually constant [109]. The consequential depletion of PCr is matched by the growth of free creatine (Cr), such that the total Cr (tCr) level remains stable (tCr = PCr + Cr). Similarly, the level of Pi also rises, such that the sum of PCr and Pi remains approximately constant. As illustrated in a stack plot of spectra acquired during dynamic examination in Fig. 4a, and the normalized time courses of the PCr and Pi signals in Fig. 4b, 31P-MRS provides a direct evidence of these processes.
Fig. 4.

The 31P-MRS dynamic experiment with an isotonic aerobic exercise at a single workload (25% of maximal voluntary contraction force). A stack of dynamically acquired spectra is depicted in a). Note that while PCr depletes and Pi rises, ATP levels remain constant. The time-courses of the normalized PCr (full line) and Pi (dotted line) signal intensities are given in b). Panel c) shows the dynamic evolution of the calculated pH based on the chemical shift of Pi. In order to demonstrate the differences in training status observable by dynamic 31P-MRS, data from a regularly active (black lines) and sedentary (grey lines) volunteer are visualized in panels b) and c). The grey area indicates the 6-min long exercise period.
The CK-driven PCr hydrolysis is also one of the processes involved in the stabilization of cellular pH. However, its rapid onset typically results in a small initial rise in pH (alkalization) after the start of the exercise (Fig. 4c). The fall in PCr and/or rise in pH also leads to an increase in free ADP, which still is much lower than ATP and bellow the 31P-MRS sensitivity in vivo. However, the concentration of ADP can be calculated according to CK equilibrium expression [110], which follows solution thermodynamics in skeletal muscle [111], using the equilibrium constant KCK ≈ 1.66 × 10⁹ M−1 [112]:
| (7) |
To solve equation (7), the concentration of free Cr must be estimated. There are two commonly used approaches for this quantification. One is based on the assumption that, under resting conditions, PCr represents ≈85% of tCr [96]. The other assumes a constant concentration of [tCr] ≈ 42 mM within the muscle tissue [47], [49].
The resynthesis of PCr after exercise can be considered entirely aerobic; therefore, the absolute PCr resynthesis rate measures the suprabasal ATP synthesis rate [6]. The time constant of PCr recovery (τPCr), or the PCr recovery rate constant (kPCr = 1/τPCr), can be fitted by a monoexponential function [109], given by:
| (8) |
where [PCr]end_exercise is the concentration of PCr at the end of exercise; and ΔPCr is the difference between [PCr] at rest and [PCr]end_exercise. A higher order exponential function can be also used for τPCr fitting, if appropriate. The slow component of PCr recovery would then be related to the interactions between pH and PCr in the CK equilibrium [113]. The initial rate of PCr resynthesis (ViPCr) during the recovery period, which roughly represents the oxidative phosphorylation flux [114], can be calculated as follows:
| (9) |
To quantify the maximal rate of oxidative ATP synthesis from the PCr recovery data (Qmax), i.e. mitochondrial capacity, one of three basic ‘models’ is commonly used.
The first assumes a linear relationship between the PCr depletion and the initial recovery rate, where the slope of the relationship is defined by the exponential recovery rate constant, kPCr. Thus, the linear model often uses kPCr (or τPCr) as a relative inverse measure of metabolic function. This can be extended by theoretically extrapolating the ViPCr for maximal PCr depletion, i.e. the maximal ATP synthesis rate [51], [115]:
| (10) |
The linear model offers only a rough estimation of the oxidative ATP synthesis rate, as both τPCr and Qmax-lin are highly dependent on the pH at the end of exercise [116], and is, therefore, valid only when pH changes are small. Besides, the calculation of Qmax-lin does not account for the resting rate of ATP turnover.
An alternative, more accurate model is based on the Michaelis-Menten dependence of oxidative metabolism on [ADP], i.e. the ‘ADP-based model’ [117]. The concentration of ADP at the end of exercise ([ADP]end_exercise), which can be calculated from equation (7), provides a direct relation to mitochondrial capacity (Qmax-ADP). The simple, commonly used, first-order, hyperbolic approximation given in equation (11) does not account for the whole dynamic range, without unrealistic assumptions about the basal ATP turnover rate.
| (11) |
Therefore, a sigmoid relationship with a Hill coefficient (nH ≈ 2), which also includes basal rate of ATP turnover (Qb ≈ 1.5–2.4 mM/min [114], [118]), was defined to provide a better fit [6],:
| (12) |
Km is the value of [ADP] at the half-maximal oxidation rate, which is approximately 30 μM in skeletal muscle tissue [63]; however, values in the literature range between 22 μM [114] and 44 μM [118]. To avoid the assumptions on fixed Km, Qb, and nH values, Qmax-ADP can be calculated from a revised equation (12), and converted into a multi-point sigmoidal fitting function [119]:
| (13) |
where VPCr(t) is the oxidative resynthesis rate of PCr during recovery at a certain time point, which can be calculated from the derivative of the fitted PCr recovery time course in equation (8).
The third model is based on the non-equilibrium thermodynamic (NET) approaches, i.e. the ‘NET mode. l’ The simplest case uses the relationship between oxidative ATP synthesis and the free energy of ATP hydrolysis (ΔGATP), which is supposedly quasi-linear [109]. Then, the rate constants of PCr or ΔGATP can be used as relative measures of metabolic function [6]. However, the linear relationship is valid only in a small range of ΔGATP values, being more exactly sigmoid [114], [118], [120], [121]. More complex fits have be used to obtain an extrapolated NET-model maximum flux [122]:
| (14) |
where A = 1 in a simple substrate-to-product reaction [123], B relates to thermodynamic reversibility, C is the value of ΔGATP at which flux is zero and which has a physiological interpretation [112], and RT ≈ 2.57 kJ/mol. Please note that the calculations based on these three different models must not, in general, provide similar numerical values of Qmax, and, therefore, are not directly comparable.
It is worth mentioning that the PCr dynamics during the actual exercise can also be used for ATP synthesis rate calculation. However, as the exercise must not always be purely aerobic [63], glycogenolytic ATP synthesis also must be considered. The calculation is, therefore, not as straightforward as in the case of using recovery data. The relevant methods for the quantification of oxidative and glycogenolytic ATP syntheses from 31P-MRS data acquired during different types of exercise have been reviewed elsewhere [3].
2.2.2. Hardware requirements
The metabolic processes under investigation are relatively fast, with τPCr on the order of tens of seconds in healthy individuals. Thus, for the measurement of the dynamics of 31P metabolites, the exercise must be synchronized with the MR data acquisition and performed on an MR-compatible device inside the MR system. The design of the device depends on the complexity of tasks it has to fulfill. In particular, if the only goal is to cause appropriate perturbation in 31P signals, e.g., at least 15% depletion in the PCr signal, very straightforward tactics can be used. The simplest include the use of rubber resistance bands for plantar flexion exercise of the calf muscle [124], [125], or the recently proposed use of a dual-pocket bag filled with weights and strapped to the ankle of the participant for knee extension exercise of the quadriceps [126]. Although these approaches are very simple and easily applicable in clinical studies [126], they lack the ability to measure additional parameters, e.g., generated force or total energy output, which are commonly provided by the more complex MR-ergometers.
There is an increasing amount of commercial MR-ergometers for different exercise types available [127], [128], [129], [130], with design and controlling software that enable exact workload calibration and recording of force, work, and trajectory or flexion angle. However, due to their costs and/or specific application demands, there are many more built-in-the-lab devices used worldwide [20], [104], [131], [132], [133], [134], [135], [136], [137], [138], [139]. Basic designs apply mechanical or pneumatic workload settings. The first is based on a system of pulleys that transfers the workload outside the magnet bore or even outside the magnet room with a set of counterweights or variable filling of the water-tank at the end of the pulley. A pneumatic design uses pistons pressured by compressed air for workload adjustment. Whether buying a commercial ergometer or constructing one, the experimental design must be considered, i.e. metabolism of which muscle group is to be investigated and what type of exercise is suitable for the task at hand. This is of particular importance when a multi-centric study is planned, and the results from dynamic experiments performed at different research sites are to be directly compared [20].
2.2.3. How to choose the right exercise protocol?
The choice of exercise protocol might have a significant influence on the muscle ATP turnover measured; however, there is a lack of systematic studies [6]. Moreover, it is important to mention that there is no optimal exercise protocol for every application and the choice effectively depends on the equipment and research question at hand. The four basic types of exercise that differ in the ATP synthesis pathways during exercise [63] are (i) ischemic exercise, (ii) pure aerobic exercise under steady-state conditions or (iii) during work jumps, and (iv) mixed exercise. As the blood/oxygen supply is cut off during ischemic exercise, oxidative ATP synthesis is negligible, and therefore, the only source of ATP is the glycolysis. On the other hand, during pure aerobic exercise, the contribution of glycogenolysis can be neglected and the oxidative pathway is solely responsible for ATP production. In mixed exercise, both pathways (oxidative and glycogenolytic) contribute to total ATP production. The two basic exercise modes are isometric, when the muscle tenses without changing its length, and isotonic, which can be further defined either as shortening or as lengthening. The selected design of the exercise, i.e. single workload or incremental, the length of exercise, and the duty cycle influence whether and when the steady-state condition, i.e., the absence of net changes in metabolite concentrations, will be met. A steady-state condition s typically achieved approximately 2 min after the onset of the exercise with a reasonable duty cycle (≈once every 2 s), at a stable moderate workload (20%–40% of maximal voluntary contraction force [MVC]) [140], [141], [142]. If only the oxidative ATP production is of interest, and PCr recovery data are to be used, basically any exercise mode can be selected without any major influence on measured Qmax [6]. A special case is a protocol, in which the muscles are directly electrically stimulated rather than performing exercise, and in which a tendency toward lower Qmax values has been observed [6].
Then again, this does not mean that careful planning of the exercise protocol is not necessary. One of the main points to be considered is the workload, particularly whether a fixed-value or a proportional workload should be used. The use of a fixed workload for each subject is typical when the differences between individual subjects are of interest, or when no large differences between subjects of the same metabolic group are expected. Although simple and not requiring additional complex setup for calibration measurements [128], [134], [143], such uncalibrated dynamic 31P-MRS experiments can lead to increased variability in the PCr depletion and/or a pH drop among subjects [20]. Normalization of the workload to a fraction of MVC substantially reduces the experimental variability. Pre-experimental measurement of MVC should be performed in an exercise setting identical to that in the dynamic experiment [126], [137], or at least should involve the same muscle groups [143]. Consistency of the protocol is also of high importance, as every subject should undergo the exact same examination. This might go without saying for each individual study, but must be also considered for follow-up and/or if a multi-center study is planned [20]. Furthermore, if repetition of more exercise-recovery bouts is planned within a single examination, there must be enough time reserved for physiological recovery of the muscle. It has been shown that results of a second exercise can be influenced, particularly in the presence of strong acidification [144], if the muscles did not have enough time for sufficient recovery. To prevent this influence, a minimum of 15 min of rest is suggested between two bouts of high-intensity exercise [145].
2.2.4. Exercise-induced changes in 31P-MR spectra
The most prominent exercise-induced alteration in 31P-MR spectra is the change in signal amplitudes of PCr and Pi. However, this is not the only effect on the 31P-MR spectrum.
The impact on resonance frequency of Pi has been implied, but not discussed. The chemical shift of Pi is strongly pH-dependent, and the intra-myocellular pH changes during exercise, i.e. rises at the onset of exercise due to the CK reaction and then decreases to a new level depending on the exercise intensity. Thus, the Pi signal dynamically changes its position in the spectrum during muscle exercise (Fig. 4a and 4c). If at any point during the exercise two or more sources with different pH contribute to the acquired signal, more than one Pi signal can be identified in the spectrum [119], [137], [146], [147], [148]. A potential source of Pi splitting could be a compartmentation of pH within one muscle group due to muscle fiber heterogeneity [146]. This hypothesis can be supported by the observation of carnosine peak-splitting by localized 1H-MRS of skeletal muscle [149] after exhausting exercise. However, recent studies at ultra-high field strength (i.e. 7 T) found no Pi-splitting when the signal was acquired from a single muscle group and attributed the Pi-splitting to the acquisition of the combined signals of several muscles with different pH [137], [150]. In any case, if Pi-splitting is observed and more than one pH value is calculated, the total Pi equals the sum of all Pi signals, and overall pH can be calculated as a weighted mean of the individual [119].
Another exercise-induced effect is the alteration of signal linewidths. First described at the Pi resonance line, it was also recently detected for the PCr resonance [137]. In general, during exercise, the linewidth of Pi, and, to a lower extent, also of PCr, increases and during recovery slowly returns to its original values. Unlike in Pi, where the line-broadening occurs mainly due to alterations in intramyocellular pH and was attributed to heterogeneous muscle compartmentation [146], the potential cause of PCr line-broadening is the deoxygenation of myoglobin during exercise and its over-oxygenation during recovery [137], similar to the blood oxygenation level dependent effect well known from functional MR imaging [151].
2.3. 31P-MRS saturation transfer
Another 31P technique that provides an insight into the reaction kinetics of energy metabolism is called magnetization transfer (MT). Its most commonly used form is saturation transfer (ST). ST uses the transfer of magnetization between nuclei that are linked by chemical exchange [3]. This technique allows non-invasive measurement of unidirectional exchange rates and metabolic fluxes under steady-state conditions. Thus, ST does not require additional exercise equipment, like dynamic 31P-MRS, and it is also applicable in organs that cannot be directly challenged by exercise, e.g., brain [5], [152], [153], liver [17], [19], [154] or heart [152], [155], [156], and potentially also in weak or injured skeletal muscles. On the other hand, the physiological interpretation of the measured data is not as straightforward, and, as such, does not have the same meaning as in dynamic 31P-MRS [157], [158], [159].
2.3.1. Underlying principle
The rate of chemical reaction between two metabolites can be studied by 31P-MR through selective irradiation of one metabolite involved in the reaction in order to perturb its magnetization from the equilibrium state, and then, measuring the effect on its exchange partner [160], [161]. One of the most-studied reactions by ST is the creatine-kinase (CK) reaction, described earlier by equation (6). In this reaction, CK catalyzes the exchange of the last phosphate moiety of the ATP molecule (γ-position) to PCr and back. In the standard ST experiment, the γ-ATP resonance frequency is selectively saturated, which results in a reduction in the PCr signal, as depicted in Fig. 5a, due to the forward flux in the CK reaction, the unavailability of unsaturated phosphate to replenish PCr via the reverse reaction, and the fact that the exchange rate is sufficiently faster than the intrinsic T1 (T1int), i.e. T1 that would be measured in the absence of any chemical exchange [158]. The fractional reduction in the PCr signal from its equilibrium (M0) to the steady-state value (Mz) is then equal to the pseudo-first-order forward rate constant (k), taking into account the apparent T1 of PCr (T1app), measured with the γ-ATP signal saturated [152]:
| (15) |
The T1int, if of interest, can be calculated using k and T1app as follows:
| (16) |
Fig. 5.

Standard continuous saturation transfer (cST) experiment performed in the gastrocnemius medialis muscle at 7 T. Saturation of the γ-ATP resonance and control spectra are depicted in a) and the inversion recovery (IR) experiment with continuous saturation of γ-ATP to determine the apparent T1app is shown in panel b). Arrows depict the saturation frequency in each experiment, i.e. in a) saturation of γ-ATP at −2.48 ppm (bottom); control saturation for the PCr-to-ATP reaction at 2.48 ppm (middle); and control saturation for the Pi-to-ATP reaction at 12.52 ppm (top). Figure was adapted from Ref. [142].
The pseudo, or apparent, designation of the first-order rate constant k is used because the studied reaction is enzymatic, and therefore, the rate constant calculated from the ST experiment is a complex function of the reactants and products, and, as such, does not have the direct meaning as in a non-enzymatic reaction [158]. The forward metabolic flux (F) is given by the product of k and the concentration:
| (17) |
Selective saturation of the γ-ATP resonance also affects the Pi resonance (Fig. 5a) through the ATP hydrolysis, as described in equation (5), and its reverse, i.e. the ATPase reaction. Therefore, the unidirectional rate and metabolic flux of ATP production can also be measured via 31P ST, by means of equations (15), (17), using the magnetizations, T1app and the concentration of Pi.
2.3.2. 31P saturation transfer techniques
As stated above, to calculate unidirectional rate constants, the knowledge of three parameters (Mz, M0, and T1app) is necessary. Based on the approach how these parameters are measured, we can differentiate several ST techniques. Standard ST uses low-power continuous irradiation (cST) aimed at the γ-ATP resonance frequency. Currently, due to the limitations of modern whole-body MR systems that do not allow extremely long pulses, a pseudo-continuous irradiation, which is performed by a train of very long saturation pulses with minimal inter-pulse delays, is used instead. On the other hand, pulsed ST (pST) uses a specific γ-ATP saturation scheme, e.g., DANTE [162] or BISTRO [163]. In either case, when the applied irradiation nulls the magnetization of the γ-ATP resonance and a new steady state is reached, the Mz of the exchange partner can be measured. The equilibrium magnetization M0, in the ideal case, is the magnetization without any γ-ATP saturation applied. However, as the saturation pulses are not ideally frequency-selective, to account for the direct saturation effect on the metabolite of interest, a control experiment with the saturation mirrored around its resonance frequency has been proposed to provide genuine M0 [164] (Fig. 5). To measure the T1app, the standard ST experiment involves a separate inversion recovery (IR) experiment with continuous irradiation of the γ-ATP resonance frequency (Fig. 5b). Finally, equation (15) can be used to calculate k.
Alternatively, a progressive ST (prST) experiment exploits the increasing duration of the selective γ-ATP irradiation. Thus, the acquired magnetization of exchange partners becomes a function of irradiation time (tir) and serves to extract both k and T1app [165]:
| (18) |
Potential issues with the calculation of k may arise in case of incomplete irradiation of γ-ATP, as both equations (15), (18) ignore the residual magnetization of the “saturated” γ-ATP [166]. In addition, introduction of a control saturation experiment that solved the direct saturation problem potentially carries the issue of radiofrequency spillover. Equations that correct for either incomplete saturation [166], or the radiofrequency spillover [167], i.e. combination of the effects of direct saturation and ongoing chemical exchange during the control experiment, have been proposed. More recently, an exhaustive analysis of the effects has been performed, providing equations that account for both potential issues [168]. As an example, based on these reported corrections, equation (15) can be extended to:
| (19) |
where Mz and M0 are, as previously defined, steady-state and equilibrium magnetization of the exchange partner (e.g., PCr or Pi), while MzATP is the residual magnetization of γ-ATP at steady-state and M0ATP is the magnetization of γ-ATP measured in the control experiment. These issues deserve particular attention at lower field strengths, with the relatively low spectral dispersion. At ultra-high fields, e.g. 7 T, only a minimal effect can be expected and equation (15) is considered to be quite accurate [154], [168].
Up to this point, we have considered only the two-site ST experiments for the measurement of the rate constants of the forward PCr-to-ATP and Pi-to-ATP reactions. Although both these reactions involve ATP, this simplification of the exchange system can be made, because there is no direct exchange between PCr and Pi [169]. However, if the rate constants of the reverse reactions, i.e. ATP-to-PCr and ATP-to-Pi, are to be measured, a slightly more complicated three-site ST experiment is required. This involves either performing two consecutive saturation experiments, aimed at PCr and Pi resonance frequencies, and two control experiments, correspondingly mirrored around the γ-ATP resonance, or including a measurement with simultaneous saturation of both. A detailed description of the necessary experiments and the related equations for the calculation of k can be found in Ref. [169].
Another 31P-MR technique that can potentially be used to measure both forward and reverse reaction rates in one experiment is a special case of MT called inversion transfer (IT). An IT experiment does not require long saturation pulses, nor complicated saturation schemes, but rather, uses a single frequency selective inversion pulse targeted at the γ-ATP resonance frequency. The inversion of γ-ATP causes a signal decrease and a consecutive recovery of the exchange partners, i.e. PCr and Pi. Magnetizations of PCr, Pi, and γ-ATP, acquired after different inversion times, are used to calculate both forward and reverse exchange rates. However, there is no simplification of the Bloch equations for the magnetization in a two-sided chemical exchange reaction when using IT [170]. An in vivo comparison study between 31P ST and IT in human skeletal muscle and liver at 3 T, which provides all the necessary equations for IT, has been recently reported [19]. The high potential of IT for the measurement of both reaction rates can potentially be hindered by the strong dependence of IT on the efficiency of the frequency-selective inversion [19]. The use of an asymmetric adiabatic inversion pulse, which targets frequencies downfield from PCr, i.e. all ATP resonances, was shown to improve the accuracy of the Pi-to-ATP reaction rate determination at 3 T [171]. To amplify the effects of magnetization exchange for ATP synthesis measurement at 7 T, a band inversion targeting all ATP resonances plus the PCr resonance frequency, was proposed recently [172]. This technique is based on the notion that PCr can temporarily store inverted magnetization and transfer it to γ-ATP [173], and thus magnify the MT between γ-ATP and Pi.
2.3.3. Does an ST experiment have to take so long?
One of the main limitations of a standard ST experiment is that it requires relatively long measurement times. The reason for this is threefold: first, it requires a long TR to allow full relaxation, and the T1s of the 31P metabolites are characteristically long [174]; second, precise measurement of T1app via IR requires several (e.g., eight) inversion times; and third, to reach sufficient SNR, extensive signal averaging is required, particularly in the case of the Pi-to-ATP reaction. The SNR increase at ultra-high fields (i.e. 7 T) allows for significantly shorter examination times for ST experiments [39], [153], [154]. Alternatively, several rapid ST techniques [155], [156], [175], [176], [177] have been proposed to increase the temporal resolution of the ST measurement. All of these techniques are based on the acquisition of partially T1-saturated spectra, through the utilization of short TRs and on the reduction of total scans needed for the calculation of k. Here, we provide an overview of these techniques; more details can be found in the corresponding papers.
Timing optimization of the pre-saturation delays and a BISTRO saturation train length, based on rapid measurement of T1int [178] and confident estimate of k range, based on reported literature values and/or prior experience, is one of the ways to achieve a significant reduction in the time required for a prST experiment [175]. Another rapid ST technique is called the four-angle saturation transfer (FAST) technique [155]. As the term already implies, this technique is based on the acquisition of only four spectra, two sets of γ-ATP saturated and control spectra, with optimized flip-angles (FAs), under partially saturated conditions (short TR), using the dual-angle method [179] to calculate the T1app. This technique has also its FASTer and FASTest versions for repeated experiments, when one or both of the low flip-angle acquisitions are omitted, making certain assumptions about the experiment. An exact knowledge of the FAs in the whole excited volume is crucial for the FAST technique. Thus, adiabatic excitation [155], or spatial localization with known FA distribution are applied [142], [180]. A similar approach to the FASTest technique requiring two acquisitions with arbitrary TRs and FAs is called the T1 nominal (T1nom) method [176]. An alternative approach that applies variable TRs rather than alternating FAs is the triple repetition time saturation transfer (TRiST) method [156]. The two-TR method [181] is employed to calculate the T1app from two acquisitions with saturated γ-ATP with long and short TR and the third acquisition is the control experiment that provides M0. A recently reported, modified version of TRiST that is based on prior knowledge of intrinsic T1 (T1int) and requires only two acquisitions, i.e. fully relaxed Mz and M0, is the so called two-repetition time ST (TwiST) method [177].
2.3.4. Interpretation of ST measurements
As the ST experiment does not yield a net chemical flux, the physiological interpretation of the ST results in skeletal muscle is not straightforward. It has been clearly demonstrated in many recent literature reviews that the unidirectional Pi-to-ATP metabolic fluxes measured by 31P ST techniques in skeletal muscle at rest significantly overestimate the oxidative ATP synthesis, and therefore, differences in ST results cannot be directly interpreted as alterations of mitochondrial function or capacity [157], [158], [159]. The main reasons are that the overall unidirectional Pi-to-ATP flux contains a major glycolytic component and both turnover reactions operate close to equilibrium, i.e. the net rates of both glycolytic and oxidative ATP synthesis are low at rest [158], although the influence of chemical exchanges with smaller metabolite pools or enzyme-bound metabolites also cannot be fully excluded [157]. Still, the ST measurement of the Pi-to-ATP reaction provides a valid tool for the non-invasive examination of tissue energy metabolism, as it tends to change in pathology, e.g., in insulin resistance, in the same direction as other metabolic measures [182]. The interpretation of the measured PCr-to-ATP reaction flux is much more direct, as it is reasonable to equate the ST measured flux with the overall flux through the CK reaction [159].
To obtain a reliable measure of mitochondrial ATP turnover using 31P-MR ST experiment, glycolytic synthesis has to account for just a fraction of the total measured flux, as is the case in working muscle [4], [159]. Initial attempts to measure the Pi-to-ATP flux in human skeletal muscle during steady-state exercise have been published simultaneously only recently [141], [142]. One study utilized an extended protocol consisting of two exercise periods, including saturation, control, and no-saturation measurement in the first period, and IR in the second period [141]. The other study used the FAST technique to measure the Pi-to-ATP flux, and thus, the application of a shorter exercise protocol was sufficient [142]. Both studies reported an increase in the measured flux in exercising muscle compared to rest, as expected, due to the increased ATP demand met by oxidative ATP synthesis. This opens new opportunities for studies of human muscle metabolism by 31P-MRS.
2.4. Interrelation between static, dynamic, and ST 31P-MRS
In the previous chapters, we have described three approaches for the non-invasive measurement of muscle energy metabolism using 31P-MR. Although each of them extracts different information and provides different measures, their focus is fairly similar, and therefore, some interrelations can be expected. In the next paragraphs, we will describe some of these, as reported in the literature.
First of all, mitochondrial capacity estimated from the dynamic 31P-MRS experiments was found to relate to the recently observed, resting alkaline Pi signal (Pi2), which was assigned to originate from the mitochondria [92], [95]. A good agreement between the measured relation between Pi2/Pi and the recovery time constant, τPCr, and a model prediction was also found [95]. In addition, there was also a positive correlation reported between [Pi2] and Qmax, as well as Pi2/Pi and Qmax [92]. The same study [92] also found a negative correlation between Qmax and the [PDE], in particular the [GPC], measured at rest. The link between GPC and energy metabolism is not entirely clear, but simultaneous observations of impaired oxidative metabolism and elevated PDE levels are not that rare [66], [67], [68], [69], [183]. The Pi-to-ATP metabolic flux measured by ST at rest has also been correlated with Pi2/Pi [92]. Similarly, a negative correlation between [PDE] and Pi-to-ATP flux measured at rest has been reported in the literature [50], [92]. Recently, a relationship has been described between the [PME] and Pi-to-ATP metabolic flux assessed by 31P-MRS ST, when measured at rest as well as during steady state exercise [141]. All these relations suggest that high-quality 31P-MR spectra acquired at rest can provide surrogate markers of skeletal muscle energy metabolism.
Several studies have also investigated the potential relations between the parameters of dynamic examinations and ST measurements. The relation between the unidirectional Pi-to-ATP flux and the PCr time recovery constant, τPCr, is of particular interest, as τPCr is often used as an indicator of mitochondrial metabolism. While a report of a negative correlation between them can be found [184], other studies did not observe this [141], [143], [185]. On the other hand, a positive correlation between the Pi-to-ATP flux and Qmax has been found across volunteers with various training status [92], [143], [184]. A correlation between the initial recovery rate (VPCr) and the Pi-to-ATP flux measured during steady-state muscle exercise, as well as between VPCr and the increment in the Pi-to-ATP flux from rest to exercise value, has also been reported [141]. We can summarize that, even though ST measured at rest does not provide a direct measure of oxidative metabolism, it provides a relevant parameter of energy metabolism that correlates with mitochondrial capacity, and can, therefore, be used as an alternative when dynamic examination is not possible.
2.5. Is the metabolism of every muscle the same?
As skeletal muscles differ in muscle fiber composition, their metabolic activity is also not completely alike. Hence, measured metabolic values are unique for each muscle/muscle group and are not directly transferable to another one. When making conclusions based on the 31P-MRS data, it is, therefore, important to know the anatomical source of the measured signal. The use of sensitive surface coils and simple pulse-acquire sequences in 31P-MRS examinations provides a coarse localization of the measured signal restricted by the sensitive volume of the coil. However, when the sensitive volume covers more muscle groups with a different metabolism and/or recruitment in the exercise challenge an additional localization technique should be applied. A typical example of when such signal localization is necessary is plantar flexion exercise, as the involvement of the gastrocnemius and soleus muscles is different [147], [186], [187], [188], [189], and therefore, the acquisition of a combined signal can bias the results [137], [150] and affect the comparability of results between research sites [20]. Localization strategies for static and dynamic 31P-MRS are discussed later in this review.
3. 31P-MRS of human liver
The liver is the largest organ within the human body and its superficial anatomical position makes it suitable for in vivo MRS experiments using surface coils. The liver is responsible for the metabolism of carbohydrates, lipids, and circulating proteins, and for detoxification of the body's waste products. It is the most important site for the metabolism of drugs and alcohol. Bile is produced in the liver, which is important for the digestion of fats in the gut, and also acts as a transport medium for the excretion of bilirubin and certain drugs. Since the indirect clinical and laboratory measures of hepatic function may be subject to extrahepatic influences, a direct non-invasive measure is of great importance.
31P MRS provides information about human liver metabolism in a non-invasive manner [17], [57], [190], [191], [192], [193], [194], [195], [196], [197], [198], [199], [200], [201], [202], [203], [204], [205]. As mentioned in the paragraph about the information content of the 31P-MR spectrum, the main feature of the healthy liver 31P spectrum is the lack of PCr signal, due to the fact that, under normal conditions, hepatocytes do not express creatine kinase. Alterations in hepatic energy metabolism are typical for inflammatory and neoplastic liver diseases. During the past few decades, the metabolic state of the resting liver has been studied in a wide range of pathologies [206]. These included viral [199], [207], [208] and alcoholic liver disease [191], [209], cirrhosis [195], [196], [197], [210], [211], [212], [213], non-alcoholic fatty liver [201], [205], as well as insulin resistance, and/or type 2 diabetes [202], [214]. Moreover, changes in the 31P-MRS pattern were associated with liver metastases [190], [192], [215], [216].
3.1. 31P-MRS of the liver at rest
To avoid possible contamination from muscle tissue, gall bladder, or adjacent liver tissue, localization of the hepatic 31P-MRS signal must be achieved [8], [17], [53], [217]. To this end, a variety of different strategies (Fig. 6) has been proposed and implemented [22], [37], [218], [219], [220]. These localization techniques are discussed in more detail in the next chapter. The full list of possible clinical applications and findings of hepatic 31P-MRS is out of the scope of this methodological review and can be found elsewhere [203], [221], [222], [223]. Here we provide only a short list of consensus findings.
Fig. 6.

Typical 31P-MRS localization strategies for liver examinations. Localizer image of the human liver with indicated surface coil position overlaid with different localization volumes is given in a). Slab-selective 1D image-selected in vivo spectroscopy (ISIS) localization with the slab parallel to the coil, as shown by full white lines provides the spectrum depicted in b). The spectrum in c) was acquired by a single voxel 3D-ISIS technique visualized by the white dotted rectangle. 2D chemical shift imaging (CSI) localization, shown as the yellow dashed matrix, delivers the spectrum depicted in d). The spectrum in e) was acquired using a 3D-CSI technique – red dotted matrix. Figure was reproduced from Ref. [275].
3.1.1. Hepatic energy homeostasis (ATP)
Hepatic energy homeostasis can be assessed through the measurement of ATP levels. This has been extensively used in 31P-MRS studies focused on investigating the viability of stored and transplanted livers [224], [225], [226], [227]. Although liver transplantation has proven to be a safe and effective means of treatment for end-stage organ failure, the ischemic damage sustained during cold storage can potentially affect the transplant viability. The amount of ATP present in the stored liver tissue reflects the length of cold storage [223]. If the measurement of hepatic energy homeostasis can predict response and recovery from partial hepatectomy, patient selection for surgical intervention could be improved. Another potential clinical application of 31P-MRS is the identification of prospective transplant rejection. The current gold standard is histology from a percutaneous liver biopsy. However, since changes in rejection may be patchy, biopsies may be subject to sampling errors. Moreover, biopsy itself is not without risk of morbidity or mortality.
ATP levels, measured by 31P-MRS, are also altered in patients with diffuse liver diseases, or general systemic metabolic diseases that also affect the liver, e.g., obesity or type 2 diabetes. Examples include non-alcoholic fatty liver disease (NAFLD), as well as non-alcoholic steatohepatitis (NASH) [228]. Obese subjects [229] and type 2 diabetic patients [230] were also shown to have more depleted baseline ATP reserves.
3.1.2. Alteration of cell membrane metabolism (PMEs and PDEs)
Whenever the cell membrane metabolism is altered, 31P-MRS may identify such changes as the, in the 31P-MR spectrum present, PMEs are cell membrane precursors and PDEs are cell membrane degradation products. PME/PDE impairment was, for example, reported in patients with liver cirrhosis [195], [196], [197], [210], [211], [212], [213].
Neoplastic changes are also associated with cell membrane reorganization, and, therefore, the most obvious and most consistent abnormality in spectra from liver tumors and metastases is an elevation in the PME region, which may be considered a diagnostic discriminator [231]. Subsequent MRS studies after treatment showed a reduction in PME levels, and, finally, after a successful therapy, the spectra became similar to those of healthy subjects. The majority of studies have involved easily accessible tumors; for example, lymph node metastases, bone tumors, lymphomas, and soft tissue tumors [231], [232], [233]. The findings of these studies suggest that falling of initially increased PME levels indicates that the drugs are reaching the target cells and affecting tumor cell metabolism, which may be of considerable clinical importance.
The 31P MR spectra from isolated human livers in cold storage, and those from large animals preserved under the same conditions, contain resonances attributable to PME and PDE, which diminish with time. However, the prediction of primary graft dysfunction using PMEs, was shown to be unreliable at the clinical field strength of 1.5 T [234].
3.1.3. The metabolically challenged liver
Another exciting line of research involves studies of hepatic metabolism after metabolic perturbations by exogenous substances. For example, type 2 diabetes mellitus is characterized by fasting hyperglycemia and an excessive, prolonged rise in plasma glucose concentrations after glucose or meal ingestion. The infusion of L-alanine or fructose bolus induces rapid and consistent changes of 31P MR spectra [193] and may serve as a tool for studies of gluconeogenesis [235], [236], [237], [238], [239]. Injections of acetaminophen, i.e. self-poisoning, were shown to cause a decrease in the concentration of all phosphorus metabolites in parallel to a decline in the synthetic ability of the liver. In severe cases, ATP and PDE levels fell to ∼20% of their normal concentrations [240].
3.1.4. Other potential biomarkers
Recent studies have pointed out the potential clinical importance of 31P metabolites other than ATP, PDE, and PME signals. In particular, NADH – a marker of inflammation and fibrinogenic activity – is increased in patients with NASH and in those with cirrhosis, but it is not increased in patients with NAFLD [201]. Increased fructose intake over a four week period was also shown to cause an increase in NADH in healthy volunteers [40]. Moreover, PtdC – a dominant component of the human bile MRS signal – contribution to the hepatic in vivo 31P-MRS signal was identified [8] and independently confirmed [217]. Further studies should investigate the potential use of the PtdC resonance for metabolic studies of the liver, gallbladder, and bile ducts. Changes in biliary PtdC may be an indicator of malignancy and dynamic metabolic perturbation, representing cell breakdown, death, and cellular regeneration [241]. The defects in biliary PtdC secretion may play a key role in the pathogenesis of bile duct and liver diseases [241], [242], [243], [244].
3.1.5. Saturation transfer in the human liver – the ATP synthase flux
The principle of the ST technique, as well as all the methods presented for skeletal muscle, can be applied to the human liver as well. There are, however, a few differences. As there is no PCr present in healthy liver tissue, the application of ST 31P-MRS for the non-invasive measurement of chemical exchange rates in the human liver is limited to the assessment of flux through the ATPase reaction. This does not diminish the value of ST, as the estimation of the hepatic Pi-to-ATP exchange rate provides important information about liver physiology. As the Pi-to-ATP exchange rate in skeletal muscle differs from the hepatic rate [19], a dedicated localization technique has to be used to avoid signal contamination from abdominal muscles. Further, due to the increased distance from the commonly used surface coil and the relatively low metabolite concentrations in liver, the full ST examination in human liver requires extensive averaging. Thus, the required measurement times reported for clinical MR systems (i.e. 3 T) are up to 1.5–2 h [17], [19]. The examination time can be significantly shortened, i.e. to ∼25 min, with relatively high repeatability, if the hepatic 31P-MRS ST measurements are performed at 7 T [154], [245]. This opens the possibility to include the estimation of the Pi-to-ATP exchange rate by 31P-MRS ST in clinical studies of the human liver in vivo [245]. Initial patient studies have reported a decreased hepatic Pi-to-ATP metabolic flux, caused by reduced Pi concentrations, in type II diabetic patients compared to matched healthy controls [202], as well as lower Pi-to-ATP exchange rate constant in patients with nonalcoholic steatohepatitis compared to healthy controls and patients with simple steatosis [205], [245].
4. Localization of 31P-MR signal for investigations of skeletal muscle and liver
31P-MRS is commonly, but not exclusively [22], [124], [246], employed with the use of highly sensitive surface coils. Nevertheless, signal localization by restricted sensitivity volume of these RF-probes does not allow a distinction between the signals that originate from different anatomic and/or morphologic compartments. Thus, particularly for liver 31P-MRS, at least a simple localization strategy must be applied. The following paragraphs describe the typical localization techniques (Fig. 6) for 31P-MRS of human liver and/or skeletal muscle, but these are also applicable to other organs of interest, e.g., heart or brain.
In general, the T2 relaxation times of 31P metabolites are relatively short, and thus, so-called “pulse-acquire” or “non-echo” FID-based MRS techniques are generally preferred [15]. Another important parameter to consider is the relatively large spectral dispersion of the 31P-MR spectra. Thus, chemical shift displacement error (CSDE) could lead to significant bias in the localization accuracy of 31P spectra. The use of CSDE-insensitive methods, i.e. implementation of selective, refocusing, and inversion pulses with relatively large bandwidths, is, therefore, essential [37].
4.1. Outer volume suppression
Suppression of the signal from the volume in the vicinity of the volume of interest, e.g., suppression of abdominal muscle signal during MRS of the liver, can be used as a standalone “negative” localization technique, but can also accompany and expand any other localization sequence.
One such technique is based on the utilization of broadband outer-volume saturation (OVS) bands, consisting of spatially selective RF-pulses, inserted into the main pulse sequence. OVS can be effectively used to selectively saturate, i.e. suppress, the 31P-MR signal originating from muscles of the abdominal wall, leaving only negligible contamination and also allowing hepatic ST measurements [19]. Then again, this suppression technique is rather SAR intensive, and therefore, would not be applicable at ultra-high fields, i.e. 7 T, particularly, if combined with the saturation pulses for ST experiment.
An alternative option to suppress the superficially originating signals without any additional RF power deposition is to use a surface-spoiling crusher coil [247], [248], [249]. The underlying idea is that a direct current (DC) applied to a crusher coil produces a region of inhomogeneous magnetic field in its vicinity. This effectively means that if the crusher coil is placed over the abdominal wall muscles, the use of DC pulses between RF excitation and signal acquisition can lead to signal dephasing, i.e. spoiling of the transverse magnetization, in the superficially located muscles, leaving the signal originating from the liver intact. The depth of dephasing is proportional to the applied DC current, and the sharpness of the transition between spoiled and unspoiled regions depends on the crusher coil design and placement. Besides, the SAR reduction provided by the crusher coil allows for more SAR intensive sequence design, even at ultra-high fields [248].
4.2. Single voxel localization
There is a variety of single-voxel spectroscopy (SVS) sequences available for accurate spatial selection of a cuboid 3D volume, i.e. a voxel, which can be used for single muscle or liver localization. To minimize the influence of T2 relaxation and J modulation on the acquired signals, FID-based sequences with a negligible acquisition delay are generally preferred for 31P-MRS. The only FID-based SVS technique is the so-called image-selected in vivo spectroscopy (ISIS). It combines eight FID acquisitions with different configurations of spatially selective inversion pulses, preceding excitation, for accurate selection of a 3D voxel [219]. To avoid contamination due to T1 smearing under partially saturated conditions, an extended ISIS scheme [250], combining 38 acquisitions for volume selection, is required [37]. This is not a limitation for the measurements of human liver or skeletal muscle at rest, and thus, high-quality spectra, with accurate spatial selectivity of a 3D volume, can be acquired using the ISIS sequence within clinically acceptable measurement times [37]. Nevertheless, the multi-acquisition nature of full 3D-ISIS volume selection makes it prone to movement artifacts and its relatively long acquisition time is impractical for dynamic 31P-MRS. Single-shot SVS localization sequences that allow full signal localization in only one acquisition are, therefore, preferred for this purpose. A stimulated echo acquisition mode (STEAM) sequence has been shown to be sufficient for dynamic single-muscle localization at 3 T [133]. However, the temporal resolution of STEAM localization for dynamic examinations is lower in comparison to pulse-acquire sequences, as signal averaging is necessary to retain sufficient SNR for reliable quantification of the measured spectra. The use of ultra-high fields, i.e. 7 T, significantly improves the SNR of the STEAM sequence, allowing higher temporal resolution. However, the CSDE that is caused by the low bandwidth of the spatially selective RF pulses used in STEAM considerably influences the localization accuracy at 7 T. To reduce CSDE, high-bandwidth RF pulses have to be applied for spatial selection [37]. For dynamic 31P-MRS, it has been demonstrated that using conventional slice-selective excitation, combined with localization by adiabatic selective refocusing (semi-LASER), can provide high selection efficiency and low outer volume contamination at 7 T [251]. Effective adiabatic refocusing used in semi-LASER has also the potential to yield double SNR compared to STEAM. However, long refocusing pulses within a semi-LASER sequence imply relatively long TE, thus reducing the sensitivity of the sequence for metabolites with short T2 or spins undergoing J-modulation, e.g., ATP [251].
4.3. Slab-selective localization
Full 3D localization of the volume of interest is often not absolutely necessary; particularly, if surface coils with inherently spatially restrictive sensitivity volumes are used. When the applied pulse sequence (e.g., ISIS) provides localization in only one spatial dimension (1D) and the sensitive volume of the coil is used for localization in the other two dimensions, a so-called slab-selective localization (e.g., 1D-ISIS) is achieved. Such 1D-ISIS localization does not provide spatial information from within the selected volume, which is commonly very large, and therefore, it is ideal for the investigation of homogeneous tissues and systemic diseases. In particular, this type of spatial selection is highly efficient for liver signal localization, as the slab can be positioned parallel to the RF-coil, i.e. avoiding muscle tissue contamination [38]. 1D-ISIS localization has been also shown to provide sufficient volume selection for hepatic 31P-MRS ST measurements [17], [154].
When applied to skeletal muscle, 1D-ISIS can be used for single-muscle localization with FID acquisition and low CSDE, which has been demonstrated for both ST [154] and also for dynamic 31P-MRS [252]. However, as 1D-ISIS localization requires a combination of two transients, it might still be prone to motion artifacts during a dynamic examination. A different FID acquisition-based 1D localization sequence, called depth-resolved surface coil MRS (DRESS [253]) using a slice-selective excitation pulse, was presented for dynamic 31P-MRS recently [150] (Fig. 7). DRESS has also been successfully combined with frequency-selective saturation pulses to measure muscle-specific unidirectional PCr-to-ATP and Pi-to-ATP fluxes using the standard ST and/or FAST technique [142]. Slab-selective localization has been shown to provide sufficient localization of the superficially located muscles, e.g., the gastrocnemius, for both dynamic and ST 31P-MRS, but the localization in only one dimension would not be optimal for deeper muscles.
Fig. 7.

A comparison of spectra acquired in a dynamic examination using simple topical surface-coil localization (non-localized) and a slice-selective, depth-resolved surface coil MRS (DRESS) localization. An in vivo localizer image with the depicted RF-coil position overlaid with localization volumes is given in a). The full line represents the DRESS selection placed over the gastrocnemius medialis, and the dotted line represents the approximate RF-coil sensitivity volume, containing several muscles. Stack plots of the 31P spectra acquired during rest, exercise and subsequent recovery are shown for the non-localized (b) and DRESS-localized (c) acquisitions. The spectra are scaled for equal noise to show the lower signal intensity of the localized experiment. On the other hand, the specificity to challenged muscle improves the dynamic range of PCr depletion. Note the Pi split in the non-localized data, which is lacking in the DRESS-localized MRS time course. Figure was reproduced from Ref. [150].
4.4. Multi-voxel MRS localization
The localization techniques for dynamic 31P-MRS described above typically target only a single muscle at a time, and therefore, to investigate several muscle groups, repeated examinations have to be performed [187]. Recently, an interleaved semi-LASER acquisition that provides information from two independent voxels in one dynamic experiment, was proposed [254]. However, small, spatially defined injuries, myopathies, or functional deficits in peripheral arterial disease (PAD) can still be overlooked if not present in the acquired volume of interest (VOI). Thus, an option to spatially localize signal from several muscle groups at once would be beneficial. Similarly, 31P-MRS investigations of human liver would benefit from spatially resolved acquisitions. MR spectroscopic imaging (MRSI) techniques allow spatially localized mapping of metabolite concentration within a larger VOI, and therefore might provide a suitable option [218], [255].
The basic principle of MRSI can be illustrated through phase-encoding in magnetic resonance imaging (MRI), with the extension of an additional frequency dimension, i.e. the chemical shift dispersion. Therefore, MRSI is commonly referred to as chemical shift imaging (CSI); and we will use these abbreviations interchangeably to accustom the reader to both of them. The key element during any MRSI experiment is a gradient pulse Gn, which produces a phase shift in the acquired FID, corresponding to the encoded spatial information. Such phase encoding used in all three directions makes 31P 3D-CSI completely insensitive to CSDE [53], [256]. 31P 3D-CSI was successfully applied in many metabolic studies of human liver [53], [55], [230], [257] or skeletal muscle [94]; however, it can be very time-consuming [258], especially if larger matrix sizes are acquired. A decreased number of encoded spatial dimensions, i.e. 1D or 2D-CSI, could offer multi-voxel acquisition in clinically acceptable measurement times [38], [259]. Unfortunately, standard 31P 2D-MRSI sequences suffer from the inherent disadvantages of slice-selective excitation, i.e. CSDE. In addition, time-consuming pulse adjustments and accurate knowledge of FA distribution are mandatory for quantification corrections. To overcome this restraint, a combination of 1D-ISIS slab selection with 2D-CSI spatial encoding has been suggested [220]. This fully adiabatic 31P 2D-CSI sequence reduces operator preparation time and the number of correction factors for metabolite quantification.
Although MRSI enables spatially resolved acquisition of 31P-MR spectra of the human liver and skeletal muscle at rest, traditional CSI sequences still require relatively long acquisition times, and therefore, do not allow high temporal resolution suitable for dynamic experiments, unless very low spatial resolution [146], specialized protocols [260], and/or rapid encoding strategies [261] are applied. The focus of the next several paragraphs will be only on these specialized cases.
As mentioned, the direct use of 31P-MRSI for dynamic examinations allows only low matrix sizes, e.g., 4 × 4, and, even with the implementation of fast Hadamard encoding [262], results in temporal resolution of 96 s [146]. While this allows investigation of the changes in metabolite concentrations and pH from rest to exercise, it is insufficient to reliably map the PCr recovery. To overcome this limitation, a dedicated exercise protocol has been proposed [260], [263]. Repeated contractions followed by short relaxation periods in a gated protocol cause the spectra to reach a new steady state in which the PCr recovery curves of each cycle follow the same exponential as would the PCr recovery after a conventional repetitive exercise. Therefore, each phase-encoding step of the gated MRSI protocol can be acquired during different recovery and the PCr recovery curve can be sampled with high temporal resolution. The spatial resolution of gated MRSI is limited by the need for a repeated contraction-relaxation cycle for each encoding step; e.g., matrix sizes of 8 × 8 voxels require a 16-min exercise protocol [263].
To avoid the need for an extended exercise protocol while acquiring high spatially resolved dynamic data, the slow Cartesian phase-encoding has to be exchanged for a faster trajectory. Recently, a constant-density spiral spectroscopic readout has been proposed for dynamic 31P-MRSI experiments [261]. The use of temporal interleaved spirals allowed the acquisition of a 14 × 14 matrix in 10 s; thus, a simple measurement protocol using repetitive exercise can be used. This rapid acquisition readout is traded for spectral bandwidth; thus, the range of resonance frequencies that are covered is rather limited. However, the main metabolites of interest for dynamic experiments, i.e. PCr, Pi and γ-ATP, are within the bandwidth measured with the proposed setup [261].
4.5. Selective 31P-MR imaging
An alternative approach to MRSI that provides high spatial resolution with reasonable temporal resolution is MRI. However, while in 1H MRI the overwhelmingly strong signal of water dominates signals of all other metabolites, there is no such source in 31P-MR. Even if PCr was assumed to be the main source of 31P-MRI signal at rest, this could change during exercise. In addition, total 31P signal does not change during exercise, and therefore, there would be no exercise-induced changes visible in the MR images of the total 31P signal. To obtain images that represent only one single metabolite, spectrally selective 31P-MRI [264] can be used. The underlying principle of spectrally selective 31P-MRI is the use of low bandwidth excitation pulses that selectively excite only the metabolite of interest. Although typically only one metabolite image is acquired [246], [265], [266], [267], simultaneous imaging of multiple 31P metabolites, using either interleaved [268], [269], [270] of multi-frequency excitation [271], has also been suggested.
If only one metabolite is to be imaged, the choice for dynamic 31P-MRI experiments is clear. Imaging of dynamic changes in the PCr signal has been recently shown to be feasible, with temporal resolution on the order of seconds [124], [125], [267]. High spatial resolution of selective 31P-MRI allows good differentiation between multiple muscle groups within the VOI, and therefore, muscle-specific PCr recovery can be evaluated. However, for the evaluation of mitochondrial capacity, dynamic information about other metabolites and, more importantly, about pH, is missing. The simultaneous acquisition of PCr and Pi images with high temporal resolution to obtain additional information about Pi dynamics has been proposed recently [270]. In addition to the observation of Pi dynamics, the phase images were used to calculate the chemical shift of Pi, and thus, also the information about pH can be extracted [270].
31P-MRI can also be combined with saturation pulses and used for localized ST experiments [272], [273], [274]. Although the cST approach with an IR experiment for T1app measurement has been shown to be feasible at 7 T for the PCr-to-ATP reaction [272], the required measurement time was relatively long (∼60 min). Therefore, to avoid the lengthy IR experiment, the use of a prST experiment was suggested for the PCr-to-ATP reaction rate imaging at 3 T [273], as well as for imaging of the unidirectional Pi-to-ATP metabolic flux at 7 T [274]. Although a selective excitation pulse is used, partial off-resonance excitation of highly concentrated PCr cannot be fully excluded and requires an additional PCr suppression pulse [274].
5. Conclusions
31P MR spectroscopy and imaging are capable of the non-invasive assessment of human skeletal muscle and liver metabolism. Next to the identification of different pathologies and tissue characterization at basal resting conditions, the dynamic in vivo 31P MRS investigation of PCr depletion and resynthesis during ischemia, exercise challenge, and following aerobic recovery, can be applied to monitor ATP handling in skeletal muscle. Dynamic 31P MRS has been applied in the field of sports physiology and has increased our knowledge of energy metabolism under challenged conditions. This, again, can be used to phenotype diffuse tissue disease and follow-up different therapy approaches, including pharmacological treatment, nutrition, and life-style intervention. An alternative method of saturation transfer (ST) can monitor the chemical exchange of phosphorous atoms between ATP, PCr, and Pi, and can be used to quantify the energy fluxes in skeletal muscle and liver. Defects of ATP synthase flux in muscle and liver were revealed in type 2 diabetes mellitus and pre-diabetic states. It was also shown that adjusted and accelerated ST measurements can be applied to measure ATP handling in the beating myocardium.
Large frequency dispersion in 31P MR spectra allows for simple and coarsely localized skeletal muscle and liver experiments, even at a low field strength of 1.5 T, but the potential of the method can be fully explored at high (3 T) and ultra-high (7 T) field strengths only. Experimental time resolution and/or signal localization prosper from the improved SNR, enabling 2D31P CSI of the lower leg in a dynamic exercise-challenged fashion, and clear separation of different muscle groups. Recent methodological developments have focused exactly on the issue of accelerating and refining the measurement without losing substantial physiological information. In the field of hardware, which was not in the scope of this review, RF-probes with increased sensitivity, improved B1 homogeneity, and SAR efficacy will further boost this research in the near future. This will further reduce patient examination time and increase the value of 31P MRS/I for the biochemical analysis of tissue-specific energy metabolism.
Acknowledgement
The financial support for the research of the authors at their home institutions by the Christian Doppler Society – Clinical Molecular MR Imaging (MOLIMA), by the OeNB Jubilaeumsfond (grant #15363 and #15455), by the Slovak Grant Agencies VEGA (grant #2/0001/17) and APVV (grant #15-0029), and by a Sir Henry Dale Fellowship from the Wellcome Trust and the Royal Society (grant #098436/Z/12/Z), is gratefully acknowledged.
References
- 1.Ackerman J.J., Grove T.H., Wong G.G., Gadian D.G., Radda G.K. Mapping of metabolites in whole animals by 31P NMR using surface coils. Nature. 1980;283:167–170. doi: 10.1038/283167a0. [DOI] [PubMed] [Google Scholar]
- 2.Chance B., Eleff S., Leigh J.S., Jr., Sokolow D., Sapega A. Mitochondrial regulation of phosphocreatine/inorganic phosphate ratios in exercising human muscle: a gated 31P NMR study. Proc. Natl. Acad. Sci. U. S. A. 1981;78:6714–6718. doi: 10.1073/pnas.78.11.6714. [DOI] [PMC free article] [PubMed] [Google Scholar]
- 3.Prompers J.J., Jeneson J.A., Drost M.R., Oomens C.C., Strijkers G.J., Nicolay K. Dynamic MRS and MRI of skeletal muscle function and biomechanics. NMR Biomed. 2006;19:927–953. doi: 10.1002/nbm.1095. [DOI] [PubMed] [Google Scholar]
- 4.Brindle K.M., Blackledge M.J., Challiss R.A., Radda G.K. 31P NMR magnetization-transfer measurements of ATP turnover during steady-state isometric muscle contraction in the rat hind limb in vivo. Biochemistry. 1989;28:4887–4893. doi: 10.1021/bi00437a054. [DOI] [PubMed] [Google Scholar]
- 5.Cadoux-Hudson T.A., Blackledge M.J., Radda G.K. Imaging of human brain creatine kinase activity in vivo. FASEB J. 1989;3:2660–2666. doi: 10.1096/fasebj.3.14.2629743. [DOI] [PubMed] [Google Scholar]
- 6.Kemp G.J., Ahmad R.E., Nicolay K., Prompers J.J. Quantification of skeletal muscle mitochondrial function by 31P magnetic resonance spectroscopy techniques: a quantitative review. Acta Physiol. (Oxf.) 2015;213:107–144. doi: 10.1111/apha.12307. [DOI] [PubMed] [Google Scholar]
- 7.Heerschap A., Houtman C., in 't Zandt H.J., van den Bergh A.J., Wieringa B. Introduction to in vivo 31P magnetic resonance spectroscopy of (human) skeletal muscle. Proc. Nutr. Soc. 1999;58:861–870. doi: 10.1017/s0029665199001160. [DOI] [PubMed] [Google Scholar]
- 8.Chmelík M., Valkovič L., Wolf P. Phosphatidylcholine contributes to in vivo 31P MRS signal from the human liver. Eur. Radiol. 2015;25:2059–2066. doi: 10.1007/s00330-014-3578-y. [DOI] [PubMed] [Google Scholar]
- 9.Rothman D.L., Shulman R.G., Shulman G.I. 31P nuclear magnetic resonance measurements of muscle glucose-6-phosphate. Evidence for reduced insulin-dependent muscle glucose transport or phosphorylation activity in non-insulin-dependent diabetes mellitus. J. Clin. Invest. 1992;89:1069–1075. doi: 10.1172/JCI115686. [DOI] [PMC free article] [PubMed] [Google Scholar]
- 10.de Haan J.H., Klomp D.W., Tack C.J., Heerschap A. Optimized detection of changes in glucose-6-phosphate levels in human skeletal muscle by 31P MR spectroscopy. Magn. Reson Med. 2003;50:1302–1306. doi: 10.1002/mrm.10630. [DOI] [PubMed] [Google Scholar]
- 11.Roden M., Krssak M., Stingl H., Gruber S., Hofer A., Furnsinn C., Moser E., Waldhausl W. Rapid impairment of skeletal muscle glucose transport/phosphorylation by free fatty acids in humans. Diabetes. 1999;48:358–364. doi: 10.2337/diabetes.48.2.358. [DOI] [PubMed] [Google Scholar]
- 12.Moon R.B., Richards J.H. Determination of intracellular pH by 31P magnetic resonance. J. Biol. Chem. 1973;248:7276–7278. [PubMed] [Google Scholar]
- 13.Gupta R.K., Gupta P., Moore R.D. NMR studies of intracellular metal ions in intact cells and tissues. Annu. Rev. Biophys. Bioeng. 1984;13:221–246. doi: 10.1146/annurev.bb.13.060184.001253. [DOI] [PubMed] [Google Scholar]
- 14.Iotti S., Frassineti C., Alderighi L., Sabatini A., Vacca A., Barbiroli B. In vivo assessment of free magnesium concentration in human brain by 31P MRS. A new calibration curve based on a mathematical algorithm. NMR Biomed. 1996;9:24–32. doi: 10.1002/(SICI)1099-1492(199602)9:1<24::AID-NBM392>3.0.CO;2-B. [DOI] [PubMed] [Google Scholar]
- 15.Bogner W., Chmelík M., Schmid A.I., Moser E., Trattnig S., Gruber S. Assessment of 31P relaxation times in the human calf muscle: a comparison between 3 T and 7 T in vivo. Magn. Reson Med. 2009;62:574–582. doi: 10.1002/mrm.22057. [DOI] [PubMed] [Google Scholar]
- 16.Qiao H., Zhang X., Zhu X.H., Du F., Chen W. In vivo 31P MRS of human brain at high/ultrahigh fields: a quantitative comparison of NMR detection sensitivity and spectral resolution between 4 T and 7 T. Magn. Reson. Imaging. 2006;24:1281–1286. doi: 10.1016/j.mri.2006.08.002. [DOI] [PMC free article] [PubMed] [Google Scholar]
- 17.Schmid A.I., Chmelík M., Szendroedi J., Krššák M., Brehm A., Moser E., Roden M. Quantitative ATP synthesis in human liver measured by localized 31P spectroscopy using the magnetization transfer experiment. NMR Biomed. 2008;21:437–443. doi: 10.1002/nbm.1207. [DOI] [PubMed] [Google Scholar]
- 18.Rodgers C.T., Clarke W.T., Snyder C., Vaughan J.T., Neubauer S., Robson M.D. Human cardiac 31P magnetic resonance spectroscopy at 7 Tesla. Magn. Reson Med. 2014;72:304–315. doi: 10.1002/mrm.24922. [DOI] [PMC free article] [PubMed] [Google Scholar]
- 19.Buehler T., Kreis R., Boesch C. Comparison of 31P saturation and inversion magnetization transfer in human liver and skeletal muscle using a clinical MR system and surface coils. NMR Biomed. 2015;28:188–199. doi: 10.1002/nbm.3242. [DOI] [PubMed] [Google Scholar]
- 20.Šedivý P., Kipfelsberger M.C., Dezortová M., Krššák M., Drobný M., Chmelík M., Rydlo J., Trattnig S., Hájek M., Valkovič L. Dynamic 31P MR spectroscopy of plantar flexion: influence of ergometer design, magnetic field strength (3 and 7 T), and RF-coil design. Med. Phys. 2015;42:1678–1689. doi: 10.1118/1.4914448. [DOI] [PubMed] [Google Scholar]
- 21.Avdievich N.I. Transceiver-phased arrays for human brain studies at 7 T. Appl. Magn. Reson. 2011;41:483–506. doi: 10.1007/s00723-011-0280-y. [DOI] [PMC free article] [PubMed] [Google Scholar]
- 22.Panda A., Jones S., Stark H., Raghavan R.S., Sandrasegaran K., Bansal N., Dydak U. Phosphorus liver MRSI at 3T using a novel dual-tuned eight-channel 31P/1H H coil. Magn. Reson. Med. 2012;68:1346–1356. doi: 10.1002/mrm.24164. [DOI] [PubMed] [Google Scholar]
- 23.C.T. Rodgers, W. Clarke, D. Berthel, S. Neubauer, M.D. Robson, A 16-element receive array for human cardiac 31P MR spectroscopy at 7T, in: Proceedings of the 22nd Annual Meeting & Exhibition of the ISMRM 2014, Milan, Italy, 2014, p. 2896.
- 24.Goluch S., Kuehne A., Meyerspeer M. A form-fitted three channel 31P, two channel 1H transceiver coil array for calf muscle studies at 7T. Magn. Reson. Med. 2015;73:2376–2389. doi: 10.1002/mrm.25339. [DOI] [PubMed] [Google Scholar]
- 25.Valkovič L., Clarke W.T., Purvis L.A., Schaller B., Robson M.D., Rodgers C.T. Adiabatic excitation for 31P MR spectroscopy in the human heart at 7T: a feasibility study. Magn. Reson. Med. 2016 doi: 10.1002/mrm.26576. [DOI] [PMC free article] [PubMed] [Google Scholar]
- 26.Chmelík M., Považan M., Jiru F., Just Kukurová I., Dezortová M., Krššák M., Bogner W., Hájek M., Trattnig S., Valkovič L. Flip-angle mapping of 31P coils by steady-state MR spectroscopic imaging. J. Magn. Reson Imaging. 2014;40:391–397. doi: 10.1002/jmri.24401. [DOI] [PubMed] [Google Scholar]
- 27.Clarke W.T., Robson M.D., Rodgers C.T. Bloch-Siegert B1+-mapping for human cardiac 31P-MRS at 7 Tesla. Magn. Reson. Med. 2016;76:1047–1058. doi: 10.1002/mrm.26005. [DOI] [PMC free article] [PubMed] [Google Scholar]
- 28.Loring J., van der Kemp W.J., Almujayyaz S., van Oorschot J.W., Luijten P.R., Klomp D.W. Whole-body radiofrequency coil for 31P MRSI at 7T. NMR Biomed. 2016;29:709–720. doi: 10.1002/nbm.3517. [DOI] [PubMed] [Google Scholar]
- 29.Luyten P.R., Bruntink G., Sloff F.M., Vermeulen J.W., van der Heijden J.I., den Hollander J.A., Heerschap A. Broadband proton decoupling in human 31P NMR spectroscopy. NMR Biomed. 1989;1:177–183. doi: 10.1002/nbm.1940010405. [DOI] [PubMed] [Google Scholar]
- 30.Brown T.R., Stoyanova R., Greenberg T., Srinivasan R., Murphy-Boesch J. NOE enhancements and T1 relaxation times of phosphorylated metabolites in human calf muscle at 1.5 Tesla. Magn. Reson. Med. 1995;33:417–421. doi: 10.1002/mrm.1910330316. [DOI] [PubMed] [Google Scholar]
- 31.Lei H., Zhu X.H., Zhang X.L., Ugurbil K., Chen W. In vivo 31P magnetic resonance spectroscopy of human brain at 7 T: an initial experience. Magn. Reson. Med. 2003;49:199–205. doi: 10.1002/mrm.10379. [DOI] [PubMed] [Google Scholar]
- 32.Lagemaat M.W., Maas M.C., Vos E.K., Bitz A.K., Orzada S., Weiland E., van Uden M.J., Kobus T., Heerschap A., Scheenen T.W. 31P MR spectroscopic imaging of the human prostate at 7T: T1 relaxation times, Nuclear Overhauser Effect, and spectral characterization. Magn. Reson. Med. 2015;73:909–920. doi: 10.1002/mrm.25209. [DOI] [PubMed] [Google Scholar]
- 33.Gonen O., Mohebbi A., Stoyanova R., Brown T.R. In vivo phosphorus polarization transfer and decoupling from protons in three-dimensional localized nuclear magnetic resonance spectroscopy of human brain. Magn. Reson. Med. 1997;37:301–306. doi: 10.1002/mrm.1910370228. [DOI] [PubMed] [Google Scholar]
- 34.Klomp D.W., Wijnen J.P., Scheenen T.W., Heerschap A. Efficient 1H to 31P polarization transfer on a clinical 3T MR system. Magn. Reson. Med. 2008;60:1298–1305. doi: 10.1002/mrm.21733. [DOI] [PubMed] [Google Scholar]
- 35.van der Kemp W.J., Boer V.O., Luijten P.R., Stehouwer B.L., Veldhuis W.B., Klomp D.W. Adiabatic multi-echo 31P spectroscopic imaging (AMESING) at 7T for the measurement of transverse relaxation times and regaining of sensitivity in tissues with short T2* values. NMR Biomed. 2013;26:1299–1307. doi: 10.1002/nbm.2952. [DOI] [PubMed] [Google Scholar]
- 36.van der Kemp W.J., Boer V.O., Luijten P.R., Klomp D.W. Increased sensitivity of 31P MRSI using direct detection integrated with multi-echo polarization transfer (DIMEPT) NMR Biomed. 2014;27:1248–1255. doi: 10.1002/nbm.3183. [DOI] [PubMed] [Google Scholar]
- 37.Bogner W., Chmelík M., Andronesi O.C., Sorensen A.G., Trattnig S., Gruber S. In vivo 31P spectroscopy by fully adiabatic extended image selected in vivo spectroscopy: a comparison between 3 T and 7 T. Magn. Reson. Med. 2011;66:923–930. doi: 10.1002/mrm.22897. [DOI] [PubMed] [Google Scholar]
- 38.Chmelík M., Považan M., Krššák M., Gruber S., Tkačov M., Trattnig S., Bogner W. In vivo 31P magnetic resonance spectroscopy of the human liver at 7T: an initial experience. NMR Biomed. 2014;27:478–485. doi: 10.1002/nbm.3084. [DOI] [PubMed] [Google Scholar]
- 39.Valkovič L., Chmelík M., Just Kukurová I., Krššák M., Gruber S., Frollo I., Trattnig S., Bogner W. Time-resolved phosphorous magnetization transfer of the human calf muscle at 3 T and 7 T: a feasibility study. Eur. J. Radiol. 2013;82:745–751. doi: 10.1016/j.ejrad.2011.09.024. [DOI] [PubMed] [Google Scholar]
- 40.M. Gajdošík, C. Kienbacher, M. Chmelík, L. Valkovič, S. Traussnigg, M. Krebs, M. Trauner, S. Trattnig, M. Krššák, Localized 31P MRS reveals increased hepatic NADPH following 4 week of oral fructose challenge in healthy volunteers, in: 32nd Annual Scientific Meeting of the ESMRMB 2015, 2015, Edinburgh, UK, p. 411.
- 41.Vanhamme L., van den Boogaart A., Van Huffel S. Improved method for accurate and efficient quantification of MRS data with use of prior knowledge. J. Magn. Reson. 1997;129:35–43. doi: 10.1006/jmre.1997.1244. [DOI] [PubMed] [Google Scholar]
- 42.Naressi A., Couturier C., Castang I., de Beer R., Graveron-Demilly D. Java-based graphical user interface for MRUI, a software package for quantitation of in vivo/medical magnetic resonance spectroscopy signals. Comput. Biol. Med. 2001;31:269–286. doi: 10.1016/s0010-4825(01)00006-3. [DOI] [PubMed] [Google Scholar]
- 43.L.A.B. Purvis, W. Clarke, L. Biasiolli, M.D. Robson, C.T. Rodgers, Linewidth constraints in Matlab AMARES using per-metabolite T2 and per-voxel DeltaB0, in: Proceedings of the 22nd Annual Meeting & Exhibition of the ISMRM 2014, Milan, Italy, 2014, p. 2885.
- 44.Roth K., Hubesch B., Meyerhoff D.J., Naruse S., Gober J.R., Lawry T.J., Boska M.D., Matson G.B., Weiner M.W. Noninvasive quantitation of phosphorus metabolites in human-tissue by Nmr-spectroscopy. J. Magn. Reson. 1989;81:299–311. [Google Scholar]
- 45.Buchli R., Boesiger P. Comparison of methods for the determination of absolute metabolite concentrations in human muscles by P-31 Mrs. Magn. Reson. Med. 1993;30:552–558. doi: 10.1002/mrm.1910300505. [DOI] [PubMed] [Google Scholar]
- 46.Kreis R., Ernst T., Ross B.D. Absolute quantitation of water and metabolites in the human brain. 2. Metabolite concentrations. J. Magn. Reson. B. 1993;102:9–19. [Google Scholar]
- 47.Kemp G.J., Meyerspeer M., Moser E. Absolute quantification of phosphorus metabolite concentrations in human muscle in vivo by 31P MRS: a quantitative review. NMR Biomed. 2007;20:555–565. doi: 10.1002/nbm.1192. [DOI] [PubMed] [Google Scholar]
- 48.Harris R.C., Hultman E., Nordesjo L.O. Glycogen, glycolytic intermediates and high-energy phosphates determined in biopsy samples of musculus quadriceps femoris of man at rest. Methods and variance of values. Scand. J. Clin. Lab. Invest. 1974;33:109–120. [PubMed] [Google Scholar]
- 49.Blei M.L., Conley K.E., Kushmerick M.J. Separate measures of ATP utilization and recovery in human skeletal muscle. J. Physiol. 1993;465:203–222. doi: 10.1113/jphysiol.1993.sp019673. [DOI] [PMC free article] [PubMed] [Google Scholar]
- 50.Szendroedi J., Schmid A.I., Chmelik M., Krssak M., Nowotny P., Prikoszovich T., Kautzky-Willer A., Wolzt M., Waldhausl W., Roden M. Skeletal muscle phosphodiester content relates to body mass and glycemic control. PLoS One. 2011;6:e21846. doi: 10.1371/journal.pone.0021846. [DOI] [PMC free article] [PubMed] [Google Scholar]
- 51.Layec G., Bringard A., Le Fur Y., Vilmen C., Micallef J.P., Perrey S., Cozzone P.J., Bendahan D. Comparative determination of energy production rates and mitochondrial function using different 31P MRS quantitative methods in sedentary and trained subjects. NMR Biomed. 2011;24:425–438. doi: 10.1002/nbm.1607. [DOI] [PubMed] [Google Scholar]
- 52.Buchli R., Meier D., Martin E., Boesiger P. Assessment of absolute metabolite concentrations in human tissue by 31P MRS in vivo. Part II: muscle, liver, kidney. Magn. Reson. Med. 1994;32:453–458. doi: 10.1002/mrm.1910320405. [DOI] [PubMed] [Google Scholar]
- 53.Chmelik M., Schmid A.I., Gruber S., Szendroedi J., Krssak M., Trattnig S., Moser E., Roden M. Three-dimensional high-resolution magnetic resonance spectroscopic imaging for absolute quantification of 31P metabolites in human liver. Magn. Reson. Med. 2008;60:796–802. doi: 10.1002/mrm.21762. [DOI] [PubMed] [Google Scholar]
- 54.Laufs A., Livingstone R., Nowotny B., Nowotny P., Wickrath F., Giani G., Bunke J., Roden M., Hwang J.H. Quantitative liver 31P magnetic resonance spectroscopy at 3T on a clinical scanner. Magn. Reson Med. 2014;71:1670–1675. doi: 10.1002/mrm.24835. [DOI] [PubMed] [Google Scholar]
- 55.Li C.W., Negendank W.G., Murphy-Boesch J., Padavic-Shaller K., Brown T.R. Molar quantitation of hepatic metabolites in vivo in proton-decoupled, nuclear Overhauser effect enhanced 31P NMR spectra localized by three-dimensional chemical shift imaging. NMR Biomed. 1996;9:141–155. doi: 10.1002/(SICI)1099-1492(199606)9:4<141::AID-NBM403>3.0.CO;2-P. [DOI] [PubMed] [Google Scholar]
- 56.Meyerhoff D.J., Karczmar G.S., Matson G.B., Boska M.D., Weiner M.W. Non-invasive quantitation of human liver metabolites using image-guided 31P magnetic resonance spectroscopy. NMR Biomed. 1990;3:17–22. doi: 10.1002/nbm.1940030103. [DOI] [PubMed] [Google Scholar]
- 57.Noren B., Lundberg P., Ressner M., Wirell S., Almer S., Smedby O. Absolute quantification of human liver metabolite concentrations by localized in vivo 31P NMR spectroscopy in diffuse liver disease. Eur. Radiol. 2005;15:148–157. doi: 10.1007/s00330-004-2434-x. [DOI] [PubMed] [Google Scholar]
- 58.Rajanayagam V., Lee R.R., Ackerman Z., Bradley W.G., Ross B.D. Quantitative P-31 MR spectroscopy of the liver in alcoholic cirrhosis. J. Magn. Reson. Imaging. 1992;2:183–190. doi: 10.1002/jmri.1880020211. [DOI] [PubMed] [Google Scholar]
- 59.Sijens P.E., Dagnelie P.C., Halfwerk S., van Dijk P., Wicklow K., Oudkerk M. Understanding the discrepancies between 31P MR spectroscopy assessed liver metabolite concentrations from different institutions. Magn. Reson. Imaging. 1998;16:205–211. doi: 10.1016/s0730-725x(97)00246-4. [DOI] [PubMed] [Google Scholar]
- 60.Tosner Z., Dezortova M., Tintera J., Hajek M. Application of two-dimensional CSI for absolute quantification of phosphorus metabolites in the human liver. MAGMA. 2001;13:40–46. doi: 10.1007/BF02668649. [DOI] [PubMed] [Google Scholar]
- 61.Cresshull I., Dawson M.J., Edwards R.H.T., Gadian D.G., Gordon R.E., Radda G.K., Shaw D., Wilkie D.R. Human muscle analysed by 31P nuclear magnetic resonance in intact subjects. J. Physiol. 1981;317:18P. [Google Scholar]
- 62.Ross B.D., Radda G.K., Gadian D.G., Rocker G., Esiri M., Falconer-Smith J. Examination of a case of suspected McArdle's syndrome by 31P nuclear magnetic resonance. N. Engl. J. Med. 1981;304:1338–1342. doi: 10.1056/NEJM198105283042206. [DOI] [PubMed] [Google Scholar]
- 63.Kemp G.J., Radda G.K. Quantitative interpretation of bioenergetic data from 31P and 1H magnetic resonance spectroscopic studies of skeletal muscle: an analytical review. Magn. Reson. Q. 1994;10:43–63. [PubMed] [Google Scholar]
- 64.Taylor D.J., Kemp G.J., Radda G.K. Bioenergetics of skeletal muscle in mitochondrial myopathy. J. Neurol. Sci. 1994;127:198–206. doi: 10.1016/0022-510x(94)90073-6. [DOI] [PubMed] [Google Scholar]
- 65.Lodi R., Taylor D.J., Tabrizi S.J., Kumar S., Sweeney M., Wood N.W., Styles P., Radda G.K., Schapira A.H. In vivo skeletal muscle mitochondrial function in Leber's hereditary optic neuropathy assessed by 31P magnetic resonance spectroscopy. Ann. Neurol. 1997;42:573–579. doi: 10.1002/ana.410420407. [DOI] [PubMed] [Google Scholar]
- 66.Sleigh A., Stears A., Thackray K. Mitochondrial oxidative phosphorylation is impaired in patients with congenital lipodystrophy. J. Clin. Endocrinol. Metab. 2012;97:E438–E442. doi: 10.1210/jc.2011-2587. [DOI] [PMC free article] [PubMed] [Google Scholar]
- 67.Park J.H., Phothimat P., Oates C.T., Hernanz-Schulman M., Olsen N.J. Use of P-31 magnetic resonance spectroscopy to detect metabolic abnormalities in muscles of patients with fibromyalgia. Arthritis Rheum. 1998;41:406–413. doi: 10.1002/1529-0131(199803)41:3<406::AID-ART5>3.0.CO;2-L. [DOI] [PubMed] [Google Scholar]
- 68.Younkin D.P., Berman P., Sladky J., Chee C., Bank W., Chance B. 31P NMR studies in Duchenne muscular dystrophy: age-related metabolic changes. Neurology. 1987;37:165–169. doi: 10.1212/wnl.37.1.165. [DOI] [PubMed] [Google Scholar]
- 69.Wokke B.H., Hooijmans M.T., van den Bergen J.C., Webb A.G., Verschuuren J.J., Kan H.E. Muscle MRS detects elevated PDE/ATP ratios prior to fatty infiltration in Becker muscular dystrophy. NMR Biomed. 2014;27:1371–1377. doi: 10.1002/nbm.3199. [DOI] [PubMed] [Google Scholar]
- 70.McCully K.K., Argov Z., Boden B.P., Brown R.L., Bank W.J., Chance B. Detection of muscle injury in humans with 31-P magnetic resonance spectroscopy. Muscle Nerve. 1988;11:212–216. doi: 10.1002/mus.880110304. [DOI] [PubMed] [Google Scholar]
- 71.Saltin B., Henriksson J., Nygaard E., Andersen P., Jansson E. Fiber types and metabolic potentials of skeletal muscles in sedentary man and endurance runners. Ann. N. Y. Acad. Sci. 1977;301:3–29. doi: 10.1111/j.1749-6632.1977.tb38182.x. [DOI] [PubMed] [Google Scholar]
- 72.Pette D., Staron R.S. Cellular and molecular diversities of mammalian skeletal muscle fibers. Rev. Physiol. Biochem. Pharmacol. 1990;116:1–76. doi: 10.1007/3540528806_3. [DOI] [PubMed] [Google Scholar]
- 73.Simoneau J.A., Bouchard C. Genetic determinism of fiber type proportion in human skeletal muscle. FASEB J. 1995;9:1091–1095. doi: 10.1096/fasebj.9.11.7649409. [DOI] [PubMed] [Google Scholar]
- 74.Hakkinen K., Alen M., Kraemer W.J. Neuromuscular adaptations during concurrent strength and endurance training versus strength training. Eur. J. Appl. Physiol. 2003;89:42–52. doi: 10.1007/s00421-002-0751-9. [DOI] [PubMed] [Google Scholar]
- 75.Costill D.L., Daniels J., Evans W., Fink W., Krahenbuhl G., Saltin B. Skeletal muscle enzymes and fiber composition in male and female track athletes. J. Appl. Physiol. 1985;40(1976):149–154. doi: 10.1152/jappl.1976.40.2.149. [DOI] [PubMed] [Google Scholar]
- 76.Meyer R.A., Brown T.R., Kushmerick M.J. Phosphorus nuclear magnetic resonance of fast- and slow-twitch muscle. Am. J. Physiol. 1985;248:C279–C287. doi: 10.1152/ajpcell.1985.248.3.C279. [DOI] [PubMed] [Google Scholar]
- 77.Kushmerick M.J., Moerland T.S., Wiseman R.W. Mammalian skeletal muscle fibers distinguished by contents of phosphocreatine, ATP, and Pi. Proc. Natl. Acad. Sci. U. S. A. 1992;89:7521–7525. doi: 10.1073/pnas.89.16.7521. [DOI] [PMC free article] [PubMed] [Google Scholar]
- 78.Rehunen S., Naveri H., Kuoppasalmi K., Harkonen M. High-energy phosphate compounds during exercise in human slow-twitch and fast-twitch muscle fibres. Scand. J. Clin. Lab. Invest. 1982;42:499–506. [PubMed] [Google Scholar]
- 79.Boicelli C.A., Baldassarri A.M., Borsetto C., Conconi F. An approach to noninvasive fiber type determination by NMR. Int. J. Sports Med. 1989;10:53–54. doi: 10.1055/s-2007-1024874. [DOI] [PubMed] [Google Scholar]
- 80.Tesch P.A., Thorsson A., Fujitsuka N. Creatine phosphate in fiber types of skeletal muscle before and after exhaustive exercise. J. Appl. Physiol. 1985;66(1989):1756–1759. doi: 10.1152/jappl.1989.66.4.1756. [DOI] [PubMed] [Google Scholar]
- 81.Soderlund K., Hultman E. ATP and phosphocreatine changes in single human muscle fibers after intense electrical stimulation. Am. J. Physiol. 1991;261:E737–E741. doi: 10.1152/ajpendo.1991.261.6.E737. [DOI] [PubMed] [Google Scholar]
- 82.Greenhaff P.L., Soderlund K., Ren J.M., Hultman E. Energy metabolism in single human muscle fibres during intermittent contraction with occluded circulation. J. Physiol. 1993;460:443–453. doi: 10.1113/jphysiol.1993.sp019480. [DOI] [PMC free article] [PubMed] [Google Scholar]
- 83.Bernus G., Gonzalez de Suso J.M., Alonso J., Martin P.A., Prat J.A., Arus C. 31P-MRS of quadriceps reveals quantitative differences between sprinters and long-distance runners. Med. Sci. Sports Exerc. 1993;25:479–484. [PubMed] [Google Scholar]
- 84.Vandenborne K., Walter G., Ploutz-Snyder L., Staron R., Fry A., De Meirleir K., Dudley G.A., Leigh J.S. Energy-rich phosphates in slow and fast human skeletal muscle. Am. J. Physiol. 1995;268:C869–C876. doi: 10.1152/ajpcell.1995.268.4.C869. [DOI] [PubMed] [Google Scholar]
- 85.Takahashi H., Kuno S.Y., Katsuta S., Shimojo H., Masuda K., Yoshioka H., Anno I., Itai Y. Relationships between fiber composition and NMR measurements in human skeletal muscle. NMR Biomed. 1996;9:8–12. doi: 10.1002/(SICI)1099-1492(199602)9:1<8::AID-NBM387>3.0.CO;2-F. [DOI] [PubMed] [Google Scholar]
- 86.Maurer J., Konstanczak P., Sollner O., Ehrenstein T., Knollmann F., Wolff R., Vogl T.J., Felix R. Muscle metabolism of professional athletes using 31P-spectroscopy. Acta Radiol. 1999;40:73–77. doi: 10.1080/02841859909174407. [DOI] [PubMed] [Google Scholar]
- 87.Johansen L., Quistorff B. 31P-MRS characterization of sprint and endurance trained athletes. Int. J. Sports Med. 2003;24:183–189. doi: 10.1055/s-2003-39085. [DOI] [PubMed] [Google Scholar]
- 88.Rzanny R., Stutzig N., Gussew A., Burmeister H., Kaiser W.A., Thorhauer H.-A., Reichenbach J.R. Monitoring training-induced metabolic adaptations in the M. gastrocnemius of volleyball players by 31P-MRS. In: Dössel O., Schlegel W.C., editors. World Congress on Medical Physics and Biomedical Engineering, September 7-12, 2009, Munich, Germany: Vol. 25/4 Image Processing, Biosignal Processing, Modelling and Simulation, Biomechanics. Springer Berlin Heidelberg; Berlin, Heidelberg: 2010. pp. 453–456. [Google Scholar]
- 89.Guthrie B.M., Frostick S.P., Goodman J., Mikulis D.J., Plyley M.J., Marshall K.W. Endurance-trained and untrained skeletal muscle bioenergetics observed with magnetic resonance spectroscopy. Can. J. Appl. Physiol. 1996;21:251–263. doi: 10.1139/h96-022. [DOI] [PubMed] [Google Scholar]
- 90.Hug F., Bendahan D., Le Fur Y., Cozzone P.J., Grelot L. Metabolic recovery in professional road cyclists: a 31P-MRS study. Med. Sci. Sports Exerc. 2005;37:846–852. doi: 10.1249/01.mss.0000162616.20085.b4. [DOI] [PubMed] [Google Scholar]
- 91.Hug F., Marqueste T., Le Fur Y., Cozzone P.J., Grelot L., Bendahan D. Selective training-induced thigh muscles hypertrophy in professional road cyclists. Eur. J. Appl. Physiol. 2006;97:591–597. doi: 10.1007/s00421-006-0218-5. [DOI] [PubMed] [Google Scholar]
- 92.Valkovič L., Chmelík M., Ukropcová B. Skeletal muscle alkaline Pi pool is decreased in overweight-to-obese sedentary subjects and relates to mitochondrial capacity and phosphodiester content. Sci. Rep. 2016;6:20087. doi: 10.1038/srep20087. [DOI] [PMC free article] [PubMed] [Google Scholar]
- 93.Satrustegui J., Berkowitz H., Boden B., Donlon E., McLaughlin A., Maris J., Warnell R., Chance B. An in vivo phosphorus nuclear magnetic resonance study of the variations with age in the phosphodiester content of human muscle. Mech. Ageing Dev. 1988;42:105–114. doi: 10.1016/0047-6374(88)90066-8. [DOI] [PubMed] [Google Scholar]
- 94.Kan H.E., Klomp D.W., Wong C.S., Boer V.O., Webb A.G., Luijten P.R., Jeneson J.A. In vivo 31P MRS detection of an alkaline inorganic phosphate pool with short T1 in human resting skeletal muscle. NMR Biomed. 2010;23:995–1000. doi: 10.1002/nbm.1517. [DOI] [PMC free article] [PubMed] [Google Scholar]
- 95.van Oorschot J.W., Schmitz J.P., Webb A., Nicolay K., Jeneson J.A., Kan H.E. 31P MR spectroscopy and computational modeling identify a direct relation between Pi content of an alkaline compartment in resting muscle and phosphocreatine resynthesis kinetics in active muscle in humans. PLoS One. 2013;8:e76628. doi: 10.1371/journal.pone.0076628. [DOI] [PMC free article] [PubMed] [Google Scholar]
- 96.Kemp G.J., Roussel M., Bendahan D., Le Fur Y., Cozzone P.J. Interrelations of ATP synthesis and proton handling in ischaemically exercising human forearm muscle studied by 31P magnetic resonance spectroscopy. J. Physiol. 2001;535:901–928. doi: 10.1111/j.1469-7793.2001.00901.x. [DOI] [PMC free article] [PubMed] [Google Scholar]
- 97.Kemp G.J., Tonon C., Malucelli E., Testa C., Liava A., Manners D., Trevisi E., Martinuzzi A., Barbiroli B., Lodi R. Cytosolic pH buffering during exercise and recovery in skeletal muscle of patients with McArdle's disease. Eur. J. Appl. Physiol. 2009;105:687–694. doi: 10.1007/s00421-008-0950-0. [DOI] [PubMed] [Google Scholar]
- 98.Coggan A.R., Abduljalil A.M., Swanson S.C., Earle M.S., Farris J.W., Mendenhall L.A., Robitaille P.M. Muscle metabolism during exercise in young and older untrained and endurance-trained men. J. Appl. Physiol. 1985;75(1993):2125–2133. doi: 10.1152/jappl.1993.75.5.2125. [DOI] [PubMed] [Google Scholar]
- 99.Tonson A., Ratel S., Le Fur Y., Vilmen C., Cozzone P.J., Bendahan D. Muscle energetics changes throughout maturation: a quantitative 31P-MRS analysis. J. Appl. Physiol. 1985;109(2010):1769–1778. doi: 10.1152/japplphysiol.01423.2009. [DOI] [PMC free article] [PubMed] [Google Scholar]
- 100.Newman R.J., Bore P.J., Chan L., Gadian D.G., Styles P., Taylor D., Radda G.K. Nuclear magnetic resonance studies of forearm muscle in Duchenne dystrophy. Br. Med. J. Clin. Res. Ed. 1982;284:1072–1074. doi: 10.1136/bmj.284.6322.1072. [DOI] [PMC free article] [PubMed] [Google Scholar]
- 101.Taivassalo T., Shoubridge E.A., Chen J., Kennaway N.G., DiMauro S., Arnold D.L., Haller R.G. Aerobic conditioning in patients with mitochondrial myopathies: physiological, biochemical, and genetic effects. Ann. Neurol. 2001;50:133–141. doi: 10.1002/ana.1050. [DOI] [PubMed] [Google Scholar]
- 102.Crowther G.J., Milstein J.M., Jubrias S.A., Kushmerick M.J., Gronka R.K., Conley K.E. Altered energetic properties in skeletal muscle of men with well-controlled insulin-dependent (type 1) diabetes. Am. J. Physiol. Endocrinol. Metab. 2003;284:E655–E662. doi: 10.1152/ajpendo.00343.2002. [DOI] [PubMed] [Google Scholar]
- 103.Scheuermann-Freestone M., Madsen P.L., Manners D., Blamire A.M., Buckingham R.E., Styles P., Radda G.K., Neubauer S., Clarke K. Abnormal cardiac and skeletal muscle energy metabolism in patients with type 2 diabetes. Circulation. 2003;107:3040–3046. doi: 10.1161/01.CIR.0000072789.89096.10. [DOI] [PubMed] [Google Scholar]
- 104.Schrauwen-Hinderling V.B., Kooi M.E., Hesselink M.K., Jeneson J.A., Backes W.H., van Echteld C.J., van Engelshoven J.M., Mensink M., Schrauwen P. Impaired in vivo mitochondrial function but similar intramyocellular lipid content in patients with type 2 diabetes mellitus and BMI-matched control subjects. Diabetologia. 2007;50:113–120. doi: 10.1007/s00125-006-0475-1. [DOI] [PubMed] [Google Scholar]
- 105.Mancini D.M., Walter G., Reichek N., Lenkinski R., McCully K.K., Mullen J.L., Wilson J.R. Contribution of skeletal muscle atrophy to exercise intolerance and altered muscle metabolism in heart failure. Circulation. 1992;85:1364–1373. doi: 10.1161/01.cir.85.4.1364. [DOI] [PubMed] [Google Scholar]
- 106.Greiner A., Esterhammer R., Messner H., Biebl M., Muhlthaler H., Fraedrich G., Jaschke W.R., Schocke M.F. High-energy phosphate metabolism during incremental calf exercise in patients with unilaterally symptomatic peripheral arterial disease measured by phosphor 31 magnetic resonance spectroscopy. J. Vasc. Surg. 2006;43:978–986. doi: 10.1016/j.jvs.2006.01.020. [DOI] [PubMed] [Google Scholar]
- 107.Isbell D.C., Berr S.S., Toledano A.Y., Epstein F.H., Meyer C.H., Rogers W.J., Harthun N.L., Hagspiel K.D., Weltman A., Kramer C.M. Delayed calf muscle phosphocreatine recovery after exercise identifies peripheral arterial disease. J. Am. Coll. Cardiol. 2006;47:2289–2295. doi: 10.1016/j.jacc.2005.12.069. [DOI] [PMC free article] [PubMed] [Google Scholar]
- 108.Schocke M., Esterhammer R., Greiner A. High-energy phosphate metabolism in the exercising muscle of patients with peripheral arterial disease. Vasa. 2008;37:199–210. doi: 10.1024/0301-1526.37.3.199. [DOI] [PubMed] [Google Scholar]
- 109.Meyer R.A. A linear model of muscle respiration explains monoexponential phosphocreatine changes. Am. J. Physiol. 1988;254:C548–C553. doi: 10.1152/ajpcell.1988.254.4.C548. [DOI] [PubMed] [Google Scholar]
- 110.Kemp G.J., Taylor D.J., Thompson C.H., Hands L.J., Rajagopalan B., Styles P., Radda G.K. Quantitative analysis by 31P magnetic resonance spectroscopy of abnormal mitochondrial oxidation in skeletal muscle during recovery from exercise. NMR Biomed. 1993;6:302–310. doi: 10.1002/nbm.1940060504. [DOI] [PubMed] [Google Scholar]
- 111.Wiseman R.W., Kushmerick M.J. Creatine kinase equilibration follows solution thermodynamics in skeletal muscle. 31P NMR studies using creatine analogs. J. Biol. Chem. 1995;270:12428–12438. doi: 10.1074/jbc.270.21.12428. [DOI] [PubMed] [Google Scholar]
- 112.Harkema S.J., Meyer R.A. Effect of acidosis on control of respiration in skeletal muscle. Am. J. Physiol. 1997;272:C491–C500. doi: 10.1152/ajpcell.1997.272.2.C491. [DOI] [PubMed] [Google Scholar]
- 113.Takahashi H., Inaki M., Fujimoto K., Katsuta S., Anno I., Niitsu M., Itai Y. Control of the rate of phosphocreatine resynthesis after exercise in trained and untrained human quadriceps muscles. Eur. J. Appl. Physiol. Occup. Physiol. 1995;71:396–404. doi: 10.1007/BF00635872. [DOI] [PubMed] [Google Scholar]
- 114.Jeneson J.A., Schmitz J.P., van den Broek N.M., van Riel N.A., Hilbers P.A., Nicolay K., Prompers J.J. Magnitude and control of mitochondrial sensitivity to ADP. Am. J. Physiol. Endocrinol. Metab. 2009;297:E774–E784. doi: 10.1152/ajpendo.00370.2009. [DOI] [PMC free article] [PubMed] [Google Scholar]
- 115.Conley K.E., Esselman P.C., Jubrias S.A., Cress M.E., Inglin B., Mogadam C., Schoene R.B. Ageing, muscle properties and maximal O2 uptake rate in humans. J. Physiol. 2000;526(Pt 1):211–217. doi: 10.1111/j.1469-7793.2000.00211.x. [DOI] [PMC free article] [PubMed] [Google Scholar]
- 116.van den Broek N.M., De Feyter H.M., de Graaf L., Nicolay K., Prompers J.J. Intersubject differences in the effect of acidosis on phosphocreatine recovery kinetics in muscle after exercise are due to differences in proton efflux rates. Am. J. Physiol. Cell Physiol. 2007;293:C228–C237. doi: 10.1152/ajpcell.00023.2007. [DOI] [PubMed] [Google Scholar]
- 117.Chance B., Leigh J.S., Jr., Clark B.J., Maris J., Kent J., Nioka S., Smith D. Control of oxidative metabolism and oxygen delivery in human skeletal muscle: a steady-state analysis of the work/energy cost transfer function. Proc. Natl. Acad. Sci. U. S. A. 1985;82:8384–8388. doi: 10.1073/pnas.82.24.8384. [DOI] [PMC free article] [PubMed] [Google Scholar]
- 118.Jeneson J.A., Wiseman R.W., Westerhoff H.V., Kushmerick M.J. The signal transduction function for oxidative phosphorylation is at least second order in ADP. J. Biol. Chem. 1996;271:27995–27998. doi: 10.1074/jbc.271.45.27995. [DOI] [PubMed] [Google Scholar]
- 119.Layec G., Haseler L.J., Hoff J., Hart C.R., Liu X., Le Fur Y., Jeong E.K., Richardson R.S. Short-term training alters the control of mitochondrial respiration rate before maximal oxidative ATP synthesis. Acta Physiol. (Oxf.) 2013;208:376–386. doi: 10.1111/apha.12103. [DOI] [PMC free article] [PubMed] [Google Scholar]
- 120.Jeneson J.A., Westerhoff H.V., Brown T.R., Van Echteld C.J., Berger R. Quasi-linear relationship between Gibbs free energy of ATP hydrolysis and power output in human forearm muscle. Am. J. Physiol. 1995;268:C1474–C1484. doi: 10.1152/ajpcell.1995.268.6.C1474. [DOI] [PubMed] [Google Scholar]
- 121.Combs C.A., Aletras A.H., Balaban R.S. Effect of muscle action and metabolic strain on oxidative metabolic responses in human skeletal muscle. J. Appl. Physiol. 1985;87(1999):1768–1775. doi: 10.1152/jappl.1999.87.5.1768. [DOI] [PubMed] [Google Scholar]
- 122.Westerhoff H.V., van Echteld C.J., Jeneson J.A. On the expected relationship between Gibbs energy of ATP hydrolysis and muscle performance. Biophys. Chem. 1995;54:137–142. doi: 10.1016/0301-4622(94)00129-8. [DOI] [PubMed] [Google Scholar]
- 123.Vandermeer R., Westerhoff H.V., Vandam K. Linear relation between rate and thermodynamic force in enzyme-catalyzed reactions. Biochim. Biophys. Acta. 1980;591:488–493. doi: 10.1016/0005-2728(80)90179-6. [DOI] [PubMed] [Google Scholar]
- 124.Parasoglou P., Feng L., Xia D., Otazo R., Regatte R.R. Rapid 3D-imaging of phosphocreatine recovery kinetics in the human lower leg muscles with compressed sensing. Magn. Reson Med. 2012;68:1738–1746. doi: 10.1002/mrm.24484. [DOI] [PMC free article] [PubMed] [Google Scholar]
- 125.Parasoglou P., Xia D., Chang G., Regatte R.R. Dynamic three-dimensional imaging of phosphocreatine recovery kinetics in the human lower leg muscles at 3T and 7T: a preliminary study. NMR Biomed. 2013;26:348–356. doi: 10.1002/nbm.2866. [DOI] [PMC free article] [PubMed] [Google Scholar]
- 126.Sleigh A., Lupson V., Thankamony A., Dunger D.B., Savage D.B., Carpenter T.A., Kemp G.J. Simple and effective exercise design for assessing in vivo mitochondrial function in clinical applications using 31P magnetic resonance spectroscopy. Sci. Rep. 2016;6:19057. doi: 10.1038/srep19057. [DOI] [PMC free article] [PubMed] [Google Scholar]
- 127.Pedersen E.M., Kozerke S., Ringgaard S., Scheidegger M.B., Boesiger P. Quantitative abdominal aortic flow measurements at controlled levels of ergometer exercise. Magn. Reson. Imaging. 1999;17:489–494. doi: 10.1016/s0730-725x(98)00209-4. [DOI] [PubMed] [Google Scholar]
- 128.Isbell D.C., Epstein F.H., Zhong X. Calf muscle perfusion at peak exercise in peripheral arterial disease: measurement by first-pass contrast-enhanced magnetic resonance imaging. J. Magn. Reson. Imaging. 2007;25:1013–1020. doi: 10.1002/jmri.20899. [DOI] [PMC free article] [PubMed] [Google Scholar]
- 129.Pesta D., Paschke V., Hoppel F., Kobel C., Kremser C., Esterhammer R., Burtscher M., Kemp G.J., Schocke M. Different metabolic responses during incremental exercise assessed by localized 31P MRS in sprint and endurance athletes and untrained individuals. Int. J. Sports Med. 2013;34:669–675. doi: 10.1055/s-0032-1327648. [DOI] [PubMed] [Google Scholar]
- 130.Schocke M.F., Esterhammer R., Arnold W., Kammerlander C., Burtscher M., Fraedrich G., Jaschke W.R., Greiner A. High-energy phosphate metabolism during two bouts of progressive calf exercise in humans measured by phosphorus-31 magnetic resonance spectroscopy. Eur. J. Appl. Physiol. 2005;93:469–479. doi: 10.1007/s00421-004-1233-z. [DOI] [PubMed] [Google Scholar]
- 131.Nishijima H., Nishida M., Anzai T., Yonezawa K., Fukuda H., Sato I., Yasuda H. A simple ergometer for 31P NMR spectroscopy during dynamic forearm exercise in a whole body magnetic resonance imaging system. Jpn. Heart J. 1992;33:185–192. doi: 10.1536/ihj.33.185. [DOI] [PubMed] [Google Scholar]
- 132.Jeneson J.A., van Dobbenburgh J.O., van Echteld C.J., Lekkerkerk C., Janssen W.J., Dorland L., Berger R., Brown T.R. Experimental design of 31P MRS assessment of human forearm muscle function: restrictions imposed by functional anatomy. Magn. Reson Med. 1993;30:634–640. doi: 10.1002/mrm.1910300515. [DOI] [PubMed] [Google Scholar]
- 133.Meyerspeer M., Krssak M., Kemp G.J., Roden M., Moser E. Dynamic interleaved 1H/31P STEAM MRS at 3 Tesla using a pneumatic force-controlled plantar flexion exercise rig. MAGMA. 2005;18:257–262. doi: 10.1007/s10334-005-0014-y. [DOI] [PMC free article] [PubMed] [Google Scholar]
- 134.Layec G., Bringard A., Vilmen C., Micallef J.P., Fur Y.L., Perrey S., Cozzone P.J., Bendahan D. Accurate work-rate measurements during in vivo MRS studies of exercising human quadriceps. MAGMA. 2008;21:227–235. doi: 10.1007/s10334-008-0117-3. [DOI] [PubMed] [Google Scholar]
- 135.Jeneson J.A., Schmitz J.P., Hilbers P.A., Nicolay K. An MR-compatible bicycle ergometer for in-magnet whole-body human exercise testing. Magn. Reson. Med. 2010;63:257–261. doi: 10.1002/mrm.22179. [DOI] [PubMed] [Google Scholar]
- 136.Gusso S., Salvador C., Hofman P., Cutfield W., Baldi J.C., Taberner A., Nielsen P. Design and testing of an MRI-compatible cycle ergometer for non-invasive cardiac assessments during exercise. Biomed. Eng. Online. 2012;11:13. doi: 10.1186/1475-925X-11-13. [DOI] [PMC free article] [PubMed] [Google Scholar]
- 137.Meyerspeer M., Robinson S., Nabuurs C.I., Scheenen T., Schoisengeier A., Unger E., Kemp G.J., Moser E. Comparing localized and nonlocalized dynamic 31P magnetic resonance spectroscopy in exercising muscle at 7 T. Magn. Reson. Med. 2012;68:1713–1723. doi: 10.1002/mrm.24205. [DOI] [PMC free article] [PubMed] [Google Scholar]
- 138.Hiepe P., Gussew A., Rzanny R., Anders C., Walther M., Scholle H.C., Reichenbach J.R. Interrelations of muscle functional MRI, diffusion-weighted MRI and 31P-MRS in exercised lower back muscles. NMR Biomed. 2014;27:958–970. doi: 10.1002/nbm.3141. [DOI] [PubMed] [Google Scholar]
- 139.Tschiesche K., Rothamel M., Rzanny R., Gussew A., Hiepe P., Reichenbach J.R. MR-compatible pedal ergometer for reproducible exercising of the human calf muscle. Med. Eng. Phys. 2014;36:933–937. doi: 10.1016/j.medengphy.2014.02.026. [DOI] [PubMed] [Google Scholar]
- 140.Jeneson J.A., Bruggeman F.J. Robust homeostatic control of quadriceps pH during natural locomotor activity in man. FASEB J. 2004;18:1010–1012. doi: 10.1096/fj.03-0762fje. [DOI] [PubMed] [Google Scholar]
- 141.Sleigh A., Savage D.B., Williams G.B., Porter D., Carpenter T.A., Brindle K., Kemp G.J. 31P magnetization transfer measurements of Pi->ATP flux in exercising human muscle. J. Appl. Physiol. 1985;120(2016):649–656. doi: 10.1152/japplphysiol.00871.2015. [DOI] [PMC free article] [PubMed] [Google Scholar]
- 142.Tušek Jelenc M., Chmelík M., Bogner W., Krššák M., Trattnig S., Valkovič L. Feasibility and repeatability of localized 31P-MRS four-angle saturation transfer (FAST) of the human gastrocnemius muscle using a surface coil at 7T. NMR Biomed. 2016;29:57–65. doi: 10.1002/nbm.3445. [DOI] [PMC free article] [PubMed] [Google Scholar]
- 143.Valkovič L., Ukropcová B., Chmelík M. Interrelation of 31P-MRS metabolism measurements in resting and exercised quadriceps muscle of overweight-to-obese sedentary individuals. NMR Biomed. 2013;26:1714–1722. doi: 10.1002/nbm.3008. [DOI] [PubMed] [Google Scholar]
- 144.Yoshida T., Watari H. Changes in intracellular pH during repeated exercise. Eur. J. Appl. Physiol. Occup. Physiol. 1993;67:274–278. doi: 10.1007/BF00864228. [DOI] [PubMed] [Google Scholar]
- 145.Forbes S.C., Raymer G.H., Kowalchuk J.M., Thompson R.T., Marsh G.D. Effects of recovery time on phosphocreatine kinetics during repeated bouts of heavy-intensity exercise. Eur. J. Appl. Physiol. 2008;103:665–675. doi: 10.1007/s00421-008-0762-2. [DOI] [PubMed] [Google Scholar]
- 146.Vandenborne K., Walter G., Leigh J.S., Goelman G. pH heterogeneity during exercise in localized spectra from single human muscles. Am. J. Physiol. 1993;265:C1332–C1339. doi: 10.1152/ajpcell.1993.265.5.C1332. [DOI] [PubMed] [Google Scholar]
- 147.Vandenborne K., McCully K., Kakihira H., Prammer M., Bolinger L., Detre J.A., De Meirlier K., Walter G., Chance B., Leigh J.S. Metabolic heterogeneity in human calf muscle during maximal exercise. Proc. Natl. Acad. Sci. U. S. A. 1991;88:5714–5718. doi: 10.1073/pnas.88.13.5714. [DOI] [PMC free article] [PubMed] [Google Scholar]
- 148.Layec G., Trinity J.D., Hart C.R., Kim S.E., Groot H.J., Le Fur Y., Sorensen J.R., Jeong E.K., Richardson R.S. In vivo evidence of an age-related increase in ATP cost of contraction in the plantar flexor muscles. Clin. Sci. Lond. 2014;126:581–592. doi: 10.1042/CS20130442. [DOI] [PubMed] [Google Scholar]
- 149.Just Kukurová I., Valkovič L., Ukropec J., de Courten B., Chmelík M., Ukropcová B., Trattnig S., Krššák M. Improved spectral resolution and high reliability of in vivo 1H MRS at 7 T allow the characterization of the effect of acute exercise on carnosine in skeletal muscle. NMR Biomed. 2016;29:24–32. doi: 10.1002/nbm.3447. [DOI] [PMC free article] [PubMed] [Google Scholar]
- 150.Valkovič L., Chmelík M., Just Kukurová I. Depth-resolved surface coil MRS (DRESS)-localized dynamic 31P-MRS of the exercising human gastrocnemius muscle at 7 T. NMR Biomed. 2014;27:1346–1352. doi: 10.1002/nbm.3196. [DOI] [PubMed] [Google Scholar]
- 151.Ogawa S., Lee T.M., Kay A.R., Tank D.W. Brain magnetic resonance imaging with contrast dependent on blood oxygenation. Proc. Natl. Acad. Sci. U. S. A. 1990;87:9868–9872. doi: 10.1073/pnas.87.24.9868. [DOI] [PMC free article] [PubMed] [Google Scholar]
- 152.Bottomley P.A., Hardy C.J. Mapping creatine-kinase reaction-rates in human brain and heart with 4-tesla saturation transfer P-31 Nmr. J. Magn. Reson. 1992;99:443–448. [Google Scholar]
- 153.Lei H., Ugurbil K., Chen W. Measurement of unidirectional Pi to ATP flux in human visual cortex at 7 T by using in vivo 31P magnetic resonance spectroscopy. Proc. Natl. Acad. Sci. U. S. A. 2003;100:14409–14414. doi: 10.1073/pnas.2332656100. [DOI] [PMC free article] [PubMed] [Google Scholar]
- 154.Valkovič L., Bogner W., Gajdošík M., Považan M., Just Kukurová I., Krššák M., Gruber S., Frollo I., Trattnig S., Chmelík M. One-dimensional image-selected in vivo spectroscopy localized phosphorus saturation transfer at 7T. Magn. Reson. Med. 2014;72:1509–1515. doi: 10.1002/mrm.25058. [DOI] [PubMed] [Google Scholar]
- 155.Bottomley P.A., Ouwerkerk R., Lee R.F., Weiss R.G. Four-angle saturation transfer (FAST) method for measuring creatine kinase reaction rates in vivo. Magn. Reson. Med. 2002;47:850–863. doi: 10.1002/mrm.10130. [DOI] [PMC free article] [PubMed] [Google Scholar]
- 156.Schar M., El-Sharkawy A.M., Weiss R.G., Bottomley P.A. Triple repetition time saturation transfer (TRiST) 31P spectroscopy for measuring human creatine kinase reaction kinetics. Magn. Reson. Med. 2010;63:1493–1501. doi: 10.1002/mrm.22347. [DOI] [PMC free article] [PubMed] [Google Scholar]
- 157.Balaban R.S., Koretsky A.P. Interpretation of 31P NMR saturation transfer experiments: what you can't see might confuse you. Focus on “Standard magnetic resonance-based measurements of the Pi-->ATP rate do not index the rate of oxidative phosphorylation in cardiac and skeletal muscles”. Am. J. Physiol. Cell Physiol. 2011;301:C12–C15. doi: 10.1152/ajpcell.00100.2011. [DOI] [PMC free article] [PubMed] [Google Scholar]
- 158.From A.H., Ugurbil K. Standard magnetic resonance-based measurements of the Pi-->ATP rate do not index the rate of oxidative phosphorylation in cardiac and skeletal muscles. Am. J. Physiol. Cell Physiol. 2011;301:C1–C11. doi: 10.1152/ajpcell.00345.2010. [DOI] [PMC free article] [PubMed] [Google Scholar]
- 159.Kemp G.J., Brindle K.M. What do magnetic resonance-based measurements of Pi -> ATP flux tell us about skeletal muscle metabolism? Diabetes. 2012;61:1927–1934. doi: 10.2337/db11-1725. [DOI] [PMC free article] [PubMed] [Google Scholar]
- 160.Forsen S., Hoffman R.A. Study of moderately rapid chemical exchange reactions by means of nuclear magnetic double resonance. J. Chem. Phys. 1963;39:2892. [Google Scholar]
- 161.Brindle K.M., Campbell I.D. Nmr-studies of kinetics in cells and tissues. Q. Rev. Biophys. 1987;19:159–182. doi: 10.1017/s003358350000411x. [DOI] [PubMed] [Google Scholar]
- 162.Morris G.A., Freeman R. Selective excitation in fourier-transform nuclear magnetic-resonance. J. Magn. Reson. 1978;29:433–462. doi: 10.1016/j.jmr.2011.08.031. [DOI] [PubMed] [Google Scholar]
- 163.Luo Y., de Graaf R.A., DelaBarre L., Tannus A., Garwood M. BISTRO: an outer-volume suppression method that tolerates RF field inhomogeneity. Magn. Reson Med. 2001;45:1095–1102. doi: 10.1002/mrm.1144. [DOI] [PubMed] [Google Scholar]
- 164.Alger J.R., Shulman R.G. Nmr-studies of enzymatic rates invitro and invivo by magnetization transfer. Q. Rev. Biophys. 1984;17:83–124. doi: 10.1017/s0033583500005266. [DOI] [PubMed] [Google Scholar]
- 165.Kasparova S., Brezova V., Valko M., Horecky J., Mlynarik V., Liptaj T., Vancova O., Ulicna O., Dobrota D. Study of the oxidative stress in a rat model of chronic brain hypoperfusion. Neurochem. Int. 2005;46:601–611. doi: 10.1016/j.neuint.2005.02.006. [DOI] [PubMed] [Google Scholar]
- 166.Spencer R.G.S., Horska A., Ferretti J.A., Weiss G.H. Spillover and incomplete saturation in kinetic measurements. J. Magn. Reson B. 1993;101:294–296. [Google Scholar]
- 167.Horska A., Spencer G.S. Correctly accounting for radiofrequency spillover in saturation transfer experiments: application to measurement of the creatine kinase reaction rate in human forearm muscle. MAGMA. 1997;5:159–163. doi: 10.1007/BF02592247. [DOI] [PubMed] [Google Scholar]
- 168.Kingsley P.B., Monahan W.G. Corrections for off-resonance effects and incomplete saturation in conventional (two-site) saturation-transfer kinetic measurements. Magn. Reson. Med. 2000;43:810–819. doi: 10.1002/1522-2594(200006)43:6<810::aid-mrm6>3.0.co;2-j. [DOI] [PubMed] [Google Scholar]
- 169.Kingsley P.B., Monahan W.G. Correcting for incomplete saturation and off-resonance effects in multiple-site saturation-transfer kinetic measurements. J. Magn. Reson. 2000;146:100–109. doi: 10.1006/jmre.2000.2124. [DOI] [PubMed] [Google Scholar]
- 170.Joubert F., Gillet B., Mazet J.L., Mateo P., Beloeil J., Hoerter J.A. Evidence for myocardial ATP compartmentation from NMR inversion transfer analysis of creatine kinase fluxes. Biophys. J. 2000;79:1–13. doi: 10.1016/s0006-3495(00)76269-2. [DOI] [PMC free article] [PubMed] [Google Scholar]
- 171.Pouymayou B., Buehler T., Kreis R., Boesch C. Test–retest analysis of multiple 31P magnetization exchange pathways using asymmetric adiabatic inversion. Magn. Reson. Med. 2016 doi: 10.1002/mrm.26337. [DOI] [PubMed] [Google Scholar]
- 172.Ren J., Sherry A.D., Malloy C.R. Amplification of the effects of magnetization exchange by 31P band inversion for measuring adenosine triphosphate synthesis rates in human skeletal muscle. Magn. Reson. Med. 2015;74:1505–1514. doi: 10.1002/mrm.25514. [DOI] [PMC free article] [PubMed] [Google Scholar]
- 173.Ren J., Yang B., Sherry A.D., Malloy C.R. Exchange kinetics by inversion transfer: integrated analysis of the phosphorus metabolite kinetic exchanges in resting human skeletal muscle at 7 T. Magn. Reson. Med. 2015;73:1359–1369. doi: 10.1002/mrm.25256. [DOI] [PMC free article] [PubMed] [Google Scholar]
- 174.Bottomley P.A., Ouwerkerk R. Optimum flip-angles for exciting NMR with uncertain T1 values. Magn. Reson. Med. 1994;32:137–141. doi: 10.1002/mrm.1910320120. [DOI] [PubMed] [Google Scholar]
- 175.Xiong Q., Li Q., Mansoor A., Jameel M.N., Du F., Chen W., Zhang J. Novel strategy for measuring creatine kinase reaction rate in the in vivo heart. Am. J. Physiol. Heart Circ. Physiol. 2009;297:H1010–H1019. doi: 10.1152/ajpheart.01195.2008. [DOI] [PMC free article] [PubMed] [Google Scholar]
- 176.Xiong Q., Du F., Zhu X., Zhang P., Suntharalingam P., Ippolito J., Kamdar F.D., Chen W., Zhang J. ATP production rate via creatine kinase or ATP synthase in vivo: a novel superfast magnetization saturation transfer method. Circ. Res. 2011;108:653–663. doi: 10.1161/CIRCRESAHA.110.231456. [DOI] [PMC free article] [PubMed] [Google Scholar]
- 177.Schar M., Gabr R.E., El-Sharkawy A.M., Steinberg A., Bottomley P.A., Weiss R.G. Two repetition time saturation transfer (TwiST) with spill-over correction to measure creatine kinase reaction rates in human hearts. J. Cardiovasc Magn. Reson. 2015;17:70. doi: 10.1186/s12968-015-0175-4. [DOI] [PMC free article] [PubMed] [Google Scholar]
- 178.Horska A., Horsky J., Spencer R.G.S. Measurement of spin-lattice relaxation-times in systems undergoing chemical-exchange. J. Magn. Reson. A. 1994;110:82–89. [Google Scholar]
- 179.Bottomley P.A., Ouwerkerk R. The dual-angle method for fast, sensitive T-1 measurement in-vivo with low-angle adiabatic pulses. J. Magn. Reson. B. 1994;104:159–167. [Google Scholar]
- 180.Clarke W.T., Robson M.D., Neubauer S., Rodgers C.T. Creatine kinase rate constant in the human heart measured with 3D-localization at 7 tesla. Magn. Reson. Med. 2016 doi: 10.1002/mrm.26357. [DOI] [PMC free article] [PubMed] [Google Scholar]
- 181.El-Sharkawy A.M., Schar M., Ouwerkerk R., Weiss R.G., Bottomley P.A. Quantitative cardiac 31P spectroscopy at 3 Tesla using adiabatic pulses. Magn. Reson. Med. 2009;61:785–795. doi: 10.1002/mrm.21867. [DOI] [PMC free article] [PubMed] [Google Scholar]
- 182.Befroy D.E., Rothman D.L., Petersen K.F., Shulman G.I. 31P-magnetization transfer magnetic resonance spectroscopy measurements of in vivo metabolism. Diabetes. 2012;61:2669–2678. doi: 10.2337/db12-0558. [DOI] [PMC free article] [PubMed] [Google Scholar]
- 183.McCully K.K., Mulcahy T.K., Ryan T.E., Zhao Q. Skeletal muscle metabolism in individuals with spinal cord injury. J. Appl. Physiol. 1985;111(2011):143–148. doi: 10.1152/japplphysiol.00094.2011. [DOI] [PMC free article] [PubMed] [Google Scholar]
- 184.Schmid A.I., Schrauwen-Hinderling V.B., Andreas M., Wolzt M., Moser E., Roden M. Comparison of measuring energy metabolism by different 31P-magnetic resonance spectroscopy techniques in resting, ischemic, and exercising muscle. Magn. Reson. Med. 2012;67:898–905. doi: 10.1002/mrm.23095. [DOI] [PubMed] [Google Scholar]
- 185.van den Broek N.M., Ciapaite J., Nicolay K., Prompers J.J. Comparison of in vivo postexercise phosphocreatine recovery and resting ATP synthesis flux for the assessment of skeletal muscle mitochondrial function. Am. J. Physiol. Cell Physiol. 2010;299:C1136–C1143. doi: 10.1152/ajpcell.00200.2010. [DOI] [PubMed] [Google Scholar]
- 186.Price T.B., Kamen G., Damon B.M., Knight C.A., Applegate B., Gore J.C., Eward K., Signorile J.F. Comparison of MRI with EMG to study muscle activity associated with dynamic plantar flexion. Magn. Reson. Imaging. 2003;21:853–861. doi: 10.1016/s0730-725x(03)00183-8. [DOI] [PubMed] [Google Scholar]
- 187.Fiedler G.B., Meyerspeer M., Schmid A.I. Localized semi-LASER dynamic 31P magnetic resonance spectroscopy of the soleus during and following exercise at 7 T. MAGMA. 2015;28:493–501. doi: 10.1007/s10334-015-0484-5. [DOI] [PMC free article] [PubMed] [Google Scholar]
- 188.Schewzow K., Fiedler G.B., Meyerspeer M., Goluch S., Laistler E., Wolzt M., Moser E., Schmid A.I. Dynamic ASL and T2-weighted MRI in exercising calf muscle at 7 T: a feasibility study. Magn. Reson. Med. 2015;73:1190–1195. doi: 10.1002/mrm.25242. [DOI] [PubMed] [Google Scholar]
- 189.Fiedler G.B., Schmid A.I., Goluch S. Skeletal muscle ATP synthesis and cellular H+ handling measured by localized 31P-MRS during exercise and recovery. Sci. Rep. 2016;6:32037. doi: 10.1038/srep32037. [DOI] [PMC free article] [PubMed] [Google Scholar]
- 190.Cox I.J., Sargentoni J., Calam J., Bryant D.J., Iles R.A. Four-dimensional phosphorus-31 chemical shift imaging of carcinoid metastases in the liver. NMR Biomed. 1988;1:56–60. doi: 10.1002/nbm.1940010110. [DOI] [PubMed] [Google Scholar]
- 191.Meyerhoff D.J., Boska M.D., Thomas A.M., Weiner M.W. Alcoholic liver disease: quantitative image-guided P-31 MR spectroscopy. Radiology. 1989;173:393–400. doi: 10.1148/radiology.173.2.2798871. [DOI] [PubMed] [Google Scholar]
- 192.Cox I.J., Bell J.D., Peden C.J., Iles R.A., Foster C.S., Watanapa P., Williamson R.C. In vivo and in vitro 31P magnetic resonance spectroscopy of focal hepatic malignancies. NMR Biomed. 1992;5:114–120. doi: 10.1002/nbm.1940050303. [DOI] [PubMed] [Google Scholar]
- 193.Dagnelie P.C., Menon D.K., Cox I.J., Bell J.D., Sargentoni J., Coutts G.A., Urenjak J., Iles R.A. Effect of L-alanine infusion on 31P nuclear magnetic resonance spectra of normal human liver: towards biochemical pathology in vivo. Clin. Sci. (Lond.) 1992;83:183–190. doi: 10.1042/cs0830183. [DOI] [PubMed] [Google Scholar]
- 194.Dagnelie P.C., Bell J.D., Cox I.J., Menon D.K., Sargentoni J., Coutts G.A., Williams S.C. Effects of fish oil on phospholipid metabolism in human and rat liver studied by 31P NMR spectroscopy in vivo and in vitro. NMR Biomed. 1993;6:157–162. doi: 10.1002/nbm.1940060209. [DOI] [PubMed] [Google Scholar]
- 195.Menon D.K., Sargentoni J., Taylor-Robinson S.D., Bell J.D., Cox I.J., Bryant D.J., Coutts G.A., Rolles K., Burroughs A.K., Morgan M.Y. Effect of functional grade and etiology on in vivo hepatic phosphorus-31 magnetic resonance spectroscopy in cirrhosis: biochemical basis of spectral appearances. Hepatology. 1995;21:417–427. [PubMed] [Google Scholar]
- 196.Taylor-Robinson S.D., Sargentoni J., Bell J.D. In vivo and in vitro hepatic 31P magnetic resonance spectroscopy and electron microscopy of the cirrhotic liver. Liver. 1997;17:198–209. doi: 10.1111/j.1600-0676.1997.tb00806.x. [DOI] [PubMed] [Google Scholar]
- 197.Changani K.K., Jalan R., Cox I.J., Ala-Korpela M., Bhakoo K., Taylor-Robinson S.D., Bell J.D. Evidence for altered hepatic gluconeogenesis in patients with cirrhosis using in vivo 31-phosphorus magnetic resonance spectroscopy. Gut. 2001;49:557–564. doi: 10.1136/gut.49.4.557. [DOI] [PMC free article] [PubMed] [Google Scholar]
- 198.Taylor-Robinson S.D., Sargentoni J., Bell J.D. In vivo and in vitro hepatic phosphorus-31 magnetic resonance spectroscopy and electron microscopy in chronic ductopenic rejection of human liver allografts. Gut. 1998;42:735–743. doi: 10.1136/gut.42.5.735. [DOI] [PMC free article] [PubMed] [Google Scholar]
- 199.Lim A.K., Patel N., Hamilton G., Mylvahan K., Kuo Y.T., Goldin R.D., Taylor-Robinson S.D. 31P MR spectroscopy in assessment of response to antiviral therapy for hepatitis C virus-related liver disease. AJR Am. J. Roentgenol. 2007;189:819–823. doi: 10.2214/AJR.07.2418. [DOI] [PubMed] [Google Scholar]
- 200.Solga S.F., Horska A., Hemker S., Crawford S., Diggs C., Diehl A.M., Brancati F.L., Clark J.M. Hepatic fat and adenosine triphosphate measurement in overweight and obese adults using 1H and 31P magnetic resonance spectroscopy. Liv. Int. 2008;28:675–681. doi: 10.1111/j.1478-3231.2008.01705.x. [DOI] [PMC free article] [PubMed] [Google Scholar]
- 201.Sevastianova K., Hakkarainen A., Kotronen A. Nonalcoholic fatty liver disease: detection of elevated nicotinamide adenine dinucleotide phosphate with in vivo 3.0-T 31P MR spectroscopy with proton decoupling. Radiology. 2010;256:466–473. doi: 10.1148/radiol.10091351. [DOI] [PubMed] [Google Scholar]
- 202.Schmid A.I., Szendroedi J., Chmelik M., Krssak M., Moser E., Roden M. Liver ATP synthesis is lower and relates to insulin sensitivity in patients with type 2 diabetes. Diabetes Care. 2011;34:448–453. doi: 10.2337/dc10-1076. [DOI] [PMC free article] [PubMed] [Google Scholar]
- 203.ter Voert E.G., Heijmen L., van Laarhoven H.W., Heerschap A. In vivo magnetic resonance spectroscopy of liver tumors and metastases. World J. Gastroenterol. 2011;17:5133–5149. doi: 10.3748/wjg.v17.i47.5133. [DOI] [PMC free article] [PubMed] [Google Scholar]
- 204.Wylezinska M., Cobbold J.F., Fitzpatrick J., McPhail M.J., Crossey M.M., Thomas H.C., Hajnal J.V., Vennart W., Cox I.J., Taylor-Robinson S.D. A comparison of single-voxel clinical in vivo hepatic 31P MR spectra acquired at 1.5 and 3.0 Tesla in health and diseased states. NMR Biomed. 2011;24:231–237. doi: 10.1002/nbm.1578. [DOI] [PubMed] [Google Scholar]
- 205.Traussnigg S., Kienbacher C., Gajdošík M., Valkovič L., Hofer H., Ferenci P., Wrba F., Trattnig S., Krššák M., Trauner M. Ultra-high-field Mr-spectroscopy in nafld as non-invasive in-vivo tool for monitoring changes in fat and energy metabolism with potential identification of nash and advanced fibrosis by saturation transfer technique. J. Hepatol. 2015;62:S739–S740. [Google Scholar]
- 206.van Wassenaer-van Hall H.N., van der Grond J., van Hattum J., Kooijman C., Hoogenraad T.U., Mali W.P. 31P magnetic resonance spectroscopy of the liver: correlation with standardized serum, clinical, and histological changes in diffuse liver disease. Hepatology. 1995;21:443–449. [PubMed] [Google Scholar]
- 207.Lim A.K., Patel N., Hamilton G., Hajnal J.V., Goldin R.D., Taylor-Robinson S.D. The relationship of in vivo 31P MR spectroscopy to histology in chronic hepatitis C. Hepatology. 2003;37:788–794. doi: 10.1053/jhep.2003.50149. [DOI] [PubMed] [Google Scholar]
- 208.Zhang C.Y., Zhang Q., Zhang H.M., Yang H.S. 3.0T 31P MR spectroscopy in assessment of response to antiviral therapy for chronic hepatitis C. World J. Gastroenterol. 2014;20:2107–2112. doi: 10.3748/wjg.v20.i8.2107. [DOI] [PMC free article] [PubMed] [Google Scholar]
- 209.Menon D.K., Harris M., Sargentoni J., Taylor-Robinson S.D., Cox I.J., Morgan M.Y. In vivo hepatic 31P magnetic resonance spectroscopy in chronic alcohol abusers. Gastroenterology. 1995;108:776–788. doi: 10.1016/0016-5085(95)90451-4. [DOI] [PubMed] [Google Scholar]
- 210.Corbin I.R., Ryner L.N., Singh H., Minuk G.Y. Quantitative hepatic phosphorus-31 magnetic resonance spectroscopy in compensated and decompensated cirrhosis. Am. J. Physiol. Gastrointest. Liv. Physiol. 2004;287:G379–G384. doi: 10.1152/ajpgi.00418.2003. [DOI] [PubMed] [Google Scholar]
- 211.Dezortova M., Taimr P., Skoch A., Spicak J., Hajek M. Etiology and functional status of liver cirrhosis by 31P MR spectroscopy. World J. Gastroenterol. 2005;11:6926–6931. doi: 10.3748/wjg.v11.i44.6926. [DOI] [PMC free article] [PubMed] [Google Scholar]
- 212.Taimr P., Dezortova M., Hajek M., Spicak J. Liver cirrhosis etiology by 31P MR spectroscopy. Gastroenterology. 2003;124:A755. doi: 10.3748/wjg.v11.i44.6926. [DOI] [PMC free article] [PubMed] [Google Scholar]
- 213.Noren B., Dahlqvist O., Lundberg P., Almer S., Kechagias S., Ekstedt M., Franzen L., Wirell S., Smedby O. Separation of advanced from mild fibrosis in diffuse liver disease using 31P magnetic resonance spectroscopy. Eur. J. Radiol. 2008;66:313–320. doi: 10.1016/j.ejrad.2007.06.004. [DOI] [PubMed] [Google Scholar]
- 214.Roden M. Mechanisms of Disease: hepatic steatosis in type 2 diabetes–pathogenesis and clinical relevance. Nat. Clin. Pract. Endocrinol. Metab. 2006;2:335–348. doi: 10.1038/ncpendmet0190. [DOI] [PubMed] [Google Scholar]
- 215.Brinkmann G., Melchert U.H., Dreher W., Brossmann J., Tressing H., Muhle C., Reuter M., Heller M. Application of the maximum entropy method for evaluating phosphorus-31-magnetic resonance spectra in patients with liver metastases. Invest Radiol. 1995;30:150–155. doi: 10.1097/00004424-199503000-00003. [DOI] [PubMed] [Google Scholar]
- 216.Kooby D.A., Zakian K.L., Challa S.N., Matei C., Petrowsky H., Yoo H.H., Koutcher J.A., Fong Y. Use of phosphorous-31 nuclear magnetic resonance spectroscopy to determine safe timing of chemotherapy after hepatic resection. Cancer Res. 2000;60:3800–3806. [PubMed] [Google Scholar]
- 217.Bierwagen A., Begovatz P., Nowotny P., Markgraf D., Nowotny B., Koliaki C., Giani G., Kluppelholz B., Lundbom J., Roden M. Characterization of the peak at 2.06 ppm in 31P magnetic resonance spectroscopy of human liver: phosphoenolpyruvate or phosphatidylcholine? NMR Biomed. 2015;28:898–905. doi: 10.1002/nbm.3323. [DOI] [PubMed] [Google Scholar]
- 218.Brown T.R., Kincaid B.M., Ugurbil K. NMR chemical shift imaging in three dimensions. Proc. Natl. Acad. Sci. U. S. A. 1982;79:3523–3526. doi: 10.1073/pnas.79.11.3523. [DOI] [PMC free article] [PubMed] [Google Scholar]
- 219.Ordidge R.J., Connelly A., Lohman J.A.B. Image-selected invivo spectroscopy (isis) - a new technique for spatially selective Nmr-spectroscopy. J. Magn. Reson. 1986;66:283–294. [Google Scholar]
- 220.Chmelík M., Just Kukurová I., Gruber S., Krššák M., Valkovič L., Trattnig S., Bogner W. Fully adiabatic 31P 2D-CSI with reduced chemical shift displacement error at 7 T–GOIA-1D-ISIS/2D-CSI. Magn. Reson. Med. 2013;69:1233–1244. doi: 10.1002/mrm.24363. [DOI] [PubMed] [Google Scholar]
- 221.Cox I.J. Development and applications of in vivo clinical magnetic resonance spectroscopy. Prog. Biophys. Mol. Biol. 1996;65:45–81. doi: 10.1016/s0079-6107(96)00006-5. [DOI] [PubMed] [Google Scholar]
- 222.Solga S.F., Horska A., Clark J.M., Diehl A.M. Hepatic 31P magnetic resonance spectroscopy: a hepatologist's user guide. Liv. Int. 2005;25:490–500. doi: 10.1111/j.1478-3231.2005.01131.x. [DOI] [PubMed] [Google Scholar]
- 223.Davidson B.R., Barnard M.L., Changani K.K., Taylor-Robinson S.D. Liver transplantation: current and potential applications of magnetic resonance spectroscopy. Liv. Transpl. Surg. 1997;3:481–493. doi: 10.1002/lt.500030502. [DOI] [PubMed] [Google Scholar]
- 224.Wolf R.F., Kamman R.L., Mooyaart E.L., Haagsma E.B., Bleichrodt R.P., Slooff M.J. 31P magnetic resonance spectroscopy of the isolated human donor liver–feasibility in routine clinical practice and preliminary findings. Transplantation. 1993;55:949–951. [PubMed] [Google Scholar]
- 225.Changani K.K., Fuller B.J., Bryant D.J., Bell J.D., Ala-Korpela M., Taylor-Robinson S.D., Moore D.P., Davidson B.R. Non-invasive assessment of ATP regeneration potential of the preserved donor liver. A 31P MRS study in pig liver. J. Hepatol. 1997;26:336–342. doi: 10.1016/s0168-8278(97)80050-5. [DOI] [PubMed] [Google Scholar]
- 226.Changani K.K., Fuller B.J., Bell J.D., Taylor-Robinson S.D., Moore D.P., Davidson B.R. Improved preservation solutions for organ storage: a dynamic study of hepatic metabolism. Transplantation. 1999;68:345–355. doi: 10.1097/00007890-199908150-00005. [DOI] [PubMed] [Google Scholar]
- 227.Mann D.V., Lam W.W., Hjelm N.M., So N.M., Yeung D.K., Metreweli C., Lau W.Y. Metabolic control patterns in acute phase and regenerating human liver determined in vivo by 31-phosphorus magnetic resonance spectroscopy. Ann. Surg. 2002;235:408–416. doi: 10.1097/00000658-200203000-00013. [DOI] [PMC free article] [PubMed] [Google Scholar]
- 228.Cortez-Pinto H., Chatham J., Chacko V.P., Arnold C., Rashid A., Diehl A.M. Alterations in liver ATP homeostasis in human nonalcoholic steatohepatitis: a pilot study. JAMA. 1999;282:1659–1664. doi: 10.1001/jama.282.17.1659. [DOI] [PubMed] [Google Scholar]
- 229.Nair S., Arnold P.C.V.C., Diehl A.M. Hepatic ATP reserve and efficiency of replenishing: comparison between obese and nonobese normal individuals. Am. J. Gastroenterol. 2003;98:466–470. doi: 10.1111/j.1572-0241.2003.07221.x. [DOI] [PubMed] [Google Scholar]
- 230.Szendroedi J., Chmelik M., Schmid A.I., Nowotny P., Brehm A., Krssak M., Moser E., Roden M. Abnormal hepatic energy homeostasis in type 2 diabetes. Hepatology. 2009;50:1079–1086. doi: 10.1002/hep.23093. [DOI] [PubMed] [Google Scholar]
- 231.Negendank W. Studies of human tumors by MRS: a review. NMR Biomed. 1992;5:303–324. doi: 10.1002/nbm.1940050518. [DOI] [PubMed] [Google Scholar]
- 232.Steen R.G. Response of solid tumors to chemotherapy monitored by in vivo 31P nuclear magnetic resonance spectroscopy: a review. Cancer Res. 1989;49:4075–4085. [PubMed] [Google Scholar]
- 233.Dixon R.M., Angus P.W., Rajagopalan B., Radda G.K. Abnormal phosphomonoester signals in 31P MR spectra from patients with hepatic lymphoma. A possible marker of liver infiltration and response to chemotherapy. Br. J. Cancer. 1991;63:953–958. doi: 10.1038/bjc.1991.208. [DOI] [PMC free article] [PubMed] [Google Scholar]
- 234.Wolf R.F., Haagsma E.B., Kamman R.L., Mooyaart E.L., Sluiter W.J., Sloof M.J. Noninvasive metabolic assessment of human donor livers: prognostic value of 31P-magnetic resonance spectroscopy for early graft function. Transplantation. 1997;64:147–152. doi: 10.1097/00007890-199707150-00025. [DOI] [PubMed] [Google Scholar]
- 235.Oberhaensli R.D., Taylor D.J., Collins J.E., Schwarz H., Rajagopalan B., Radda G.K., Leonard J.V., Herschkowitz N. Study of hereditary fructose intolerance by use of P-31 magnetic-resonance spectroscopy. Lancet. 1987;2:931–934. doi: 10.1016/s0140-6736(87)91419-x. [DOI] [PubMed] [Google Scholar]
- 236.Oberhaensli R.D., Galloway G.J., Taylor D.J., Bore P.J., Radda G.K. Assessment of human-liver metabolism by P-31 magnetic-resonance spectroscopy. Br. J. Radiol. 1986;59:695–699. doi: 10.1259/0007-1285-59-703-695. [DOI] [PubMed] [Google Scholar]
- 237.Terrier F., Vock P., Cotting J., Ladebeck R., Reichen J., Hentschel D. Effect of intravenous fructose on the P-31 Mr spectrum of the liver - dose-response in healthy-volunteers. Radiology. 1989;171:557–563. doi: 10.1148/radiology.171.2.2704824. [DOI] [PubMed] [Google Scholar]
- 238.Segebarth C., Grivegnee A.R., Longo R., Luyten P.R., Denhollander J.A. Invivo monitoring of fructose metabolism in the human liver by means of P-31 magnetic-resonance spectroscopy. Biochimie. 1991;73:105–108. doi: 10.1016/0300-9084(91)90082-c. [DOI] [PubMed] [Google Scholar]
- 239.Dufour J.F., Stoupis C., Lazeyras F., Vock P., Terrier F., Reichen J. Alterations in hepatic fructose metabolism in cirrhotic-patients demonstrated by dynamic P-31 spectroscopy. Hepatology. 1992;15:835–842. doi: 10.1002/hep.1840150515. [DOI] [PubMed] [Google Scholar]
- 240.Dixon R.M., Angus P.W., Rajagopalan B., Radda G.K. 31P magnetic resonance spectroscopy detects a functional abnormality in liver metabolism after acetaminophen poisoning. Hepatology. 1992;16:943–948. doi: 10.1002/hep.1840160415. [DOI] [PubMed] [Google Scholar]
- 241.Khan S.A., Cox I.J., Thillainayagam A.V., Bansi D.S., Thomas H.C., Taylor-Robinson S.D. Proton and phosphorus-31 nuclear magnetic resonance spectroscopy of human bile in hepatopancreaticobiliary cancer. Eur. J. Gastroenterol. Hepatol. 2005;17:733–738. doi: 10.1097/00042737-200507000-00007. [DOI] [PubMed] [Google Scholar]
- 242.Lieber C.S. New concepts of the pathogenesis of alcoholic liver disease lead to novel treatments. Curr. Gastroenterol. Rep. 2004;6:60–65. doi: 10.1007/s11894-004-0027-0. [DOI] [PubMed] [Google Scholar]
- 243.Song J., da Costa K.A., Fischer L.M., Kohlmeier M., Kwock L., Wang S., Zeisel S.H. Polymorphism of the PEMT gene and susceptibility to nonalcoholic fatty liver disease (NAFLD) FASEB J. 2005;19:1266–1271. doi: 10.1096/fj.04-3580com. [DOI] [PMC free article] [PubMed] [Google Scholar]
- 244.Trauner M., Fickert P., Wagner M. MDR3 (ABCB4) defects: a paradigm for the genetics of adult cholestatic syndromes. Semin. Liv. Dis. 2007;27:77–98. doi: 10.1055/s-2006-960172. [DOI] [PubMed] [Google Scholar]
- 245.Valkovič L., Gajdošík M., Traussnigg S. Application of localized 31P MRS saturation transfer at 7 T for measurement of ATP metabolism in the liver: reproducibility and initial clinical application in patients with non-alcoholic fatty liver disease. Eur. Radiol. 2014;24:1602–1609. doi: 10.1007/s00330-014-3141-x. [DOI] [PubMed] [Google Scholar]
- 246.Greenman R.L. Quantification of the 31P metabolite concentration in human skeletal muscle from RARE image intensity. Magn. Reson. Med. 2004;52:1036–1042. doi: 10.1002/mrm.20258. [DOI] [PubMed] [Google Scholar]
- 247.Chen W., Ackerman J.J. Spatially-localized NMR spectroscopy employing an inhomogeneous surface-spoiling magnetic field gradient. 2. Surface coil experiments with multicompartment phantom and rat in vivo. NMR Biomed. 1990;3:158–165. doi: 10.1002/nbm.1940030403. [DOI] [PubMed] [Google Scholar]
- 248.Schaller B., Clarke W.T., Neubauer S., Robson M.D., Rodgers C.T. Suppression of skeletal muscle signal using a crusher coil: a human cardiac 31P-MR spectroscopy study at 7 Tesla. Magn. Reson. Med. 2016;75:962–972. doi: 10.1002/mrm.25755. [DOI] [PMC free article] [PubMed] [Google Scholar]
- 249.Bashir A., Gropler R., Ackerman J. Absolute quantification of human liver phosphorus-containing metabolites in vivo using an inhomogeneous spoiling magnetic field gradient. PLoS One. 2015;10:e0143239. doi: 10.1371/journal.pone.0143239. [DOI] [PMC free article] [PubMed] [Google Scholar]
- 250.Ljungberg M., Starck G., Vikhoff-Baaz B., Alpsten M., Ekholm S., Forssell-Aronsson E. Extended ISIS sequences insensitive to T-1 smearing. Magn. Reson. Med. 2000;44:546–555. doi: 10.1002/1522-2594(200010)44:4<546::aid-mrm8>3.0.co;2-7. [DOI] [PubMed] [Google Scholar]
- 251.Meyerspeer M., Scheenen T., Schmid A.I., Mandl T., Unger E., Moser E. Semi-LASER localized dynamic 31P magnetic resonance spectroscopy in exercising muscle at ultra-high magnetic field. Magn. Reson. Med. 2011;65:1207–1215. doi: 10.1002/mrm.22730. [DOI] [PMC free article] [PubMed] [Google Scholar]
- 252.Walter G., Vandenborne K., McCully K.K., Leigh J.S. Noninvasive measurement of phosphocreatine recovery kinetics in single human muscles. Am. J. Physiol. 1997;272:C525–C534. doi: 10.1152/ajpcell.1997.272.2.C525. [DOI] [PubMed] [Google Scholar]
- 253.Bottomley P.A. Noninvasive study of high-energy phosphate metabolism in human heart by depth-resolved 31P NMR spectroscopy. Science. 1985;229:769–772. doi: 10.1126/science.4023711. [DOI] [PubMed] [Google Scholar]
- 254.Niess F., Fiedler G.B., Schmid A.I., Goluch S., Kriegl R., Wolzt M., Moser E., Meyerspeer M. Interleaved multivoxel 31P MR spectroscopy. Magn. Reson. Med. 2016 doi: 10.1002/mrm.26172. [DOI] [PMC free article] [PubMed] [Google Scholar]
- 255.Maudsley A.A., Hilal S.K., Perman W.H., Simon H.E. Spatially resolved high-resolution spectroscopy by 4-dimensional Nmr. J. Magn. Reson. 1983;51:147–152. [Google Scholar]
- 256.Pohmann R., von Kienlin M. Accurate phosphorus metabolite images of the human heart by 3D acquisition-weighted CSI. Magn. Reson. Med. 2001;45:817–826. doi: 10.1002/mrm.1110. [DOI] [PubMed] [Google Scholar]
- 257.Purvis L.A.B., Clarke W.T., Valkovič L., Levick C., Pavlides M., Barnes E., Cobbold J.F., Robson M.D., Rodgers C.T. Phosphodiester content measured in human liver by in vivo 31P magnetic resonance spectroscopy at 7T. Magn. Reson. Med. 2016 doi: 10.1002/mrm.26635. [DOI] [PMC free article] [PubMed] [Google Scholar]
- 258.Keevil S.F. Spatial localization in nuclear magnetic resonance spectroscopy. Phys. Med. Biol. 2006;51:R579–R636. doi: 10.1088/0031-9155/51/16/R01. [DOI] [PubMed] [Google Scholar]
- 259.Leij-Halfwerk S., Agteresch H.J., Sijens P.E., Dagnelie P.C. Adenosine triphosphate infusion increases liver energy status in advanced lung cancer patients: an in vivo 31P magnetic resonance spectroscopy study. Hepatology. 2002;35:421–424. doi: 10.1053/jhep.2002.31318. [DOI] [PubMed] [Google Scholar]
- 260.Slade J.M., Towse T.F., Delano M.C., Wiseman R.W., Meyer R.A. A gated 31P NMR method for the estimation of phosphocreatine recovery time and contractile ATP cost in human muscle. NMR Biomed. 2006;19:573–580. doi: 10.1002/nbm.1037. [DOI] [PubMed] [Google Scholar]
- 261.Valkovič L., Chmelík M., Meyerspeer M., Gagoski B., Rodgers C.T., Krššák M., Andronesi O.C., Trattnig S., Bogner W. Dynamic 31P–MRSI using spiral spectroscopic imaging can map mitochondrial capacity in muscles of the human calf during plantar flexion exercise at 7T. NMR Biomed. 2016;29:1825–1834. doi: 10.1002/nbm.3662. [DOI] [PMC free article] [PubMed] [Google Scholar]
- 262.Goelman G., Walter G., Leigh J.S. Hadamard spectroscopic imaging technique as applied to study human calf muscles. Magn. Reson. Med. 1992;25:349–354. doi: 10.1002/mrm.1910250214. [DOI] [PubMed] [Google Scholar]
- 263.Forbes S.C., Slade J.M., Francis R.M., Meyer R.A. Comparison of oxidative capacity among leg muscles in humans using gated P-31 2-D chemical shift imaging. NMR Biomed. 2009;22:1063–1071. doi: 10.1002/nbm.1413. [DOI] [PubMed] [Google Scholar]
- 264.Ernst T., Lee J.H., Ross B.D. Direct 31P imaging in human limb and brain. J. Comput. Assist. Tomogr. 1993;17:673–680. doi: 10.1097/00004728-199309000-00001. [DOI] [PubMed] [Google Scholar]
- 265.Parasoglou P., Xia D., Chang G., Regatte R.R. 3D-mapping of phosphocreatine concentration in the human calf muscle at 7T: comparison to 3T. Magn. Reson. Med. 2013;70:1619–1625. doi: 10.1002/mrm.24616. [DOI] [PMC free article] [PubMed] [Google Scholar]
- 266.Parasoglou P., Xia D., Regatte R.R. Spectrally selective 3D TSE imaging of phosphocreatine in the human calf muscle at 3 T. Magn. Reson. Med. 2013;69:812–817. doi: 10.1002/mrm.24288. [DOI] [PMC free article] [PubMed] [Google Scholar]
- 267.Greenman R.L., Smithline H.A. The feasibility of measuring phosphocreatine recovery kinetics in muscle using a single-shot (31)P RARE MRI sequence. Acad. Radiol. 2011;18:917–923. doi: 10.1016/j.acra.2011.02.014. [DOI] [PMC free article] [PubMed] [Google Scholar]
- 268.Greenman R.L., Wang X., Smithline H.A. Simultaneous acquisition of phosphocreatine and inorganic phosphate images for Pi:PCr ratio mapping using a RARE sequence with chemically selective interleaving. Magn. Reson. Imaging. 2011;29:1138–1144. doi: 10.1016/j.mri.2011.05.001. [DOI] [PMC free article] [PubMed] [Google Scholar]
- 269.Lu A., Atkinson I.C., Zhou X.J., Thulborn K.R. PCr/ATP ratio mapping of the human head by simultaneously imaging of multiple spectral peaks with interleaved excitations and flexible twisted projection imaging readout trajectories at 9.4 T. Magn. Reson. Med. 2013;69:538–544. doi: 10.1002/mrm.24281. [DOI] [PMC free article] [PubMed] [Google Scholar]
- 270.Schmid A.I., Meyerspeer M., Robinson S.D. Dynamic PCr and pH imaging of human calf muscles during exercise and recovery using 31P gradient-Echo MRI at 7 Tesla. Magn. Reson. Med. 2016;75:2324–2331. doi: 10.1002/mrm.25822. [DOI] [PubMed] [Google Scholar]
- 271.Steinseifer I.K., Wijnen J.P., Hamans B.C., Heerschap A., Scheenen T.W. Metabolic imaging of multiple x-nucleus resonances. Magn. Reson. Med. 2013;70:169–175. doi: 10.1002/mrm.24456. [DOI] [PubMed] [Google Scholar]
- 272.Parasoglou P., Xia D., Chang G., Convit A., Regatte R.R. Three-dimensional mapping of the creatine kinase enzyme reaction rate in muscles of the lower leg. NMR Biomed. 2013;26:1142–1151. doi: 10.1002/nbm.2928. [DOI] [PMC free article] [PubMed] [Google Scholar]
- 273.Parasoglou P., Xia D., Chang G., Regatte R.R. Three-dimensional saturation transfer 31P-MRI in muscles of the lower leg at 3.0 T. Sci. Rep. 2014;4:5219. doi: 10.1038/srep05219. [DOI] [PMC free article] [PubMed] [Google Scholar]
- 274.Parasoglou P., Xia D., Regatte R.R. Feasibility of mapping unidirectional Pi-to-ATP fluxes in muscles of the lower leg at 7.0 Tesla. Magn. Reson. Med. 2015;74:225–230. doi: 10.1002/mrm.25388. [DOI] [PubMed] [Google Scholar]
- 275.Saba L., editor. Magnetic Resonance Imaging Handbook: image Principles, Neck, and the Brain. CRC Press, (Taylor & Francis Group); 2016. [Google Scholar]