

Abstract
Acetylcholine receptor channels (AChRs) are proteins that switch between stable “closed” and “open” conformations. In patch clamp recordings, diliganded AChR gating appears to be a simple, two-state reaction. However, mutagenesis studies indicate that during gating dozens of residues across the protein move asynchronously and are organized into rigid body gating domains (“blocks”). Moreover, there is an upper limit to the apparent channel opening rate constant. These observations suggest that the gating reaction has a broad, corrugated transition state region, with the maximum opening rate reflecting, in part, the mean first-passage time across this ensemble. Simulations reveal that a flat, isotropic energy profile for the transition state can account for many of the essential features of AChR gating. With this mechanism, concerted, local structural transitions that occur on the broad transition state ensemble give rise to fractional measures of reaction progress (Φ values) determined by rate-equilibrium free energy relationship analysis. The results suggest that the coarse-grained AChR gating conformational change propagates through the protein with dynamics that are governed by the Brownian motion of individual gating blocks.
Keywords: allosteric, energy landscape, ion channel
Ion channels are dynamic membrane proteins that adopt multiple conformations that have different functional properties. Although a few high-resolution structures of ion channels in ion-conducting (open; O) and nonconducting (closed; C) conformations have been obtained (1–4), the underlying mechanism of the C⇄O gating conformational change is still uncertain. Ion channels are, in general, large, multimeric proteins, and it is a priori likely that they adopt brief, intermediate configurations (microstates) in their passage between the stable C and O conformations.
The acetylcholine (ACh) receptor channel (AChR) is a large (300 kDa) pentamer that mediates transmission at the vertebrate neuromuscular and other cholinergic synapses (5, 6). The C conformation has a low affinity for agonists and a nonconducting pore, and the O conformation has a high affinity for agonists and a conducting pore. The structure of the AChR extracellular domain is homologous to that of the ACh-binding protein (Protein Data Bank ID code I19B; ref. 7), and the structure of the AChR transmembrane domain has been obtained by EM crystallography (Protein Data Bank ID code 1OED; ref. 8). These two structures probably reflect the AChR in the O and C conformations, respectively.
Several experimental results serve to guide our consideration of the diliganded AChR gating mechanism. (i) The kinetic parameters for AChR gating have been estimated directly under a variety of experimental conditions. The opening rate constant (β) and closing rate constant (α) for wild-type mouse α2βε AChRs activated by the natural transmitter ACh at -100 mV and 24°C are 48,000 and 1,700 s-1, respectively (Θ ≡ β/α = 28) (9). Perturbations in the vicinity of the transmitter-binding sites mainly change β. For these perturbations, when Θ = 1, both gating rate constants are ≈2,000 s-1 (10, 11). (ii) Structural and mutagenesis studies indicate that many residues move during the C⇄O isomerization. If a local perturbation (e.g., a point mutation) alters the reaction equilibrium constant, then it is reasonable to conclude that the perturbed site experiences a change in its energetic environment between the C and O conformations, which, in turn, implies that the residue, the local environment, or both move during gating. By this criterion, dozens of residues in widespread regions of all of the subunits of the AChR move. (iii) The moving residues appear to be organized into discrete, structurally contiguous domains that move essentially as rigid bodies. This insight is derived from rate-equilibrium free-energy relationships (REFERs), the slopes of which (Φ values) are thought to indicate the extent to which a local site in the protein has progressed in the gating reaction at the transition state. REFER analyses of hundreds of residues indicate that the AChR is organized into domains (“blocks”) within which Φ values are indistinguishable (12). Uniform Φ values imply equivalent reaction progress and, hence, synchronous (rigid body) motion. So far, 10 such blocks have been identified (13). (iv) There is a spatial gradient in block Φ values that approximately follows the long axis of the protein, from ≈1 in the vicinity of the transmitter binding sites to ≈0 in the middle of the membrane domain of the δ-subunit (10). This pattern indicates that during channel-opening, residues near the transmitter-binding sites move in advance of those in the membrane domain. (v) With a time resolution of 25 μs, diliganded AChR gating appears essentially to be a two-state (C⇄O) reaction. This feature indicates that the microstates of the reaction are mostly too short-lived to be measured directly. Some analyses, however, show that both brief conducting (14, 15) and nonconducting (16) states are apparent during fully liganded AChR gating. (vi) The gating-equilibrium constant and the channel opening rate constant appear to have upper limits of ≈675 and ≈0.86 μs-1, respectively (33). One interpretation of this limiting rate constant is that it reflects channel-opening across an energy profile with no net barrier.
Together, these observations indicate that diliganded AChR gating is a complex, asynchronous reaction that requires the passage of the protein through many microstates. Here, I use simulations to probe the extent to which a one-dimensional, finite, flat, and isotropic free energy profile for the diliganded AChR-gating reaction transition state is able to account for the essential features of AChR gating.
Materials and Methods
The simulations and kinetic modeling were done by using qub software (www.qub.buffalo.edu). Idealized, single-channel current intervals were simulated with Scheme 1 by using a sampling rate of 100 kHz. After imposing a dead time of 25 μs (2.5 samples), the apparent interval durations were fitted by a two-state, C⇄O model to estimate the apparent opening and closing rate constants. In some experiments, current intervals were simulated at a sampling rate of 100 MHz with a dead time of 25 ns to examine the brief components of the O and C interval duration distributions.
Scheme 1.
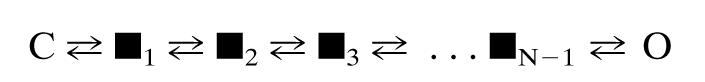
The end states, C and O, represent the protein with all gating blocks either resting or active, respectively. ▪ represents a microstate in which some blocks are resting and others are active. N is the number of gating blocks (Nstates - 1). All states shown represent fully liganded AChRs.
To estimate the apparent Φ values for Scheme 2 (see Fig. 4), the equilibrium energy of each microstate transition was changed, one-at-a-time, by ±3 kBT in increments of 1 kBT (where kB is Boltzmann's constant and T is the absolute temperature). The Φ value for these perturbations was 0.5, which means that a 1-kBT difference in equilibrium energy was manifest as a  -fold change in the forward and reverse rate constants.
Scheme 2.

The rate constants are in μs-1. The C states have a nonconducting pore but either CL or CH transmitter-binding sites.
Fig. 4.

Simulation of REFERs. (A) Starting with the intrinsic gating energy profile (Fig. 1), each microstate isomerization equilibrium constant was perturbed by ±3 kBT and the resulting apparent rate and equilibrium constants for the overall reaction were plotted in log–log format. Only the final O state was conducting. (Inset) The energy profiles are for the intrinsic reaction (thick line) and for the perturbation series of the second microstate transition (dashed lines). In all simulations, the apparent C and O interval durations were well fitted by a single exponential function. The numbers next to each REFER indicate the microstate transition (i.e., block isomerization) that was perturbed. The second block isomerization is shown as a filled circle throughout. (B) The first (Φ) and second (δΦ/δΔG0) derivatives of the REFERs shown in A. (Upper) Φ values span 0–1. (Bottom) The curvature of the REFER is maximal near the midpoint of the overall reaction. Concerted (blockwise) isomerizations that occur on a broad, corrugated transition-state region produce fractional apparent Φ values and negative (Hammond) curvatures for the overall reaction. For all simulations, the sampling interval was 10 μs, the dead time was 25 μs, and all interval duration distributions were well described by a single exponential.
Results and Discussion
Energy Profile and Kinetic Scheme. A rate constant (k) can be described as the product of an exponential term, which contains E‡ (the threshold activation energy) and a prefactor, A*:
 |
[1] |
The core motivation for the experiments described below was the estimate of ≈0.86 μs-1 for the maximum channel opening rate constant and the proposal that this limit might be equal to A* (33).
The energy profile that was used in the single-channel current simulations had a flat, corrugated transition state region flanked by two absorbing boundaries (Fig. 1). In physical terms, each microstate transition represents a two-state (“resting” or “active”) conformational switch of one gating block. This profile is codified by using Scheme 1.
Fig. 1.

Simulation of intrinsic gating. Intrinsic gating is defined as the condition of having equal apparent opening and closing rate constants (i.e., Θ = 1). In experiments with perturbations of the first gating block, intrinsic AChR gating is satisfied when the rate constant is ≈2,000 s-1. (Top Left) The simulated reaction scheme had two stable end states (C and O) plus five transient microstates (▪). With N = 6 and λ = 5 μs-1 (Scheme 1 and Eq. 2), the simulated apparent rate constant was ≈2,000 s-1 (long arrows). This rate constant was insensitive to the conductance class of the microstates. (Top Right) The corresponding free energy profile. (Middle) A simulated current trace. The sampling interval was 10 μs and the dead time was 25 μs. (Bottom) The apparent C and O dwell-time histograms and densities fitted by a two-state C⇄O model. The short-lived nonconducting components that are generated by the reaction scheme are not visible because they were too brief to be detected.
Scheme 1 is a subset of a larger, uncoupled reaction mechanism in which each of the gating blocks can independently adopt either a resting or an active conformation. Scheme 1 is an appropriate simplification of this general mechanism under the condition that the probability of a block being active is much greater when the adjoining block(s) adopts an active configuration. In Scheme 1, the blocks are rigid members of a linkage group, with the chain of block isomerizations (i.e., the channel-opening reaction) being triggered by the occupancy of the first block by a ligand.
In the simulations, the exit rates from the microstates had a single value, λ, and the microstates were distributed uniformly along a reaction coordinate of length L. From the diffusion equation,
 |
[2] |
L/N is the distance of a single hop between microstates, and D is the diffusion constant. For a diffusional process that starts near an absorbing boundary (e.g., after the first block isomerization), the mean first passage rate across the entire ensemble of microstates scales linearly with N (from equation 2.2.17 of ref. 17; see also ref. 18):
 |
[3] |
 |
[4] |
Our goal is to estimate λ and D from the experimentally determined values of A* (for the overall, C→O reaction) and N.
Intrinsic Gating. The first simulation was that of the intrinsic gating condition, i.e., where Θ = 1 and the rate constant is ≈2,000 s-1 (10, 11). Currents were simulated by using Scheme 1, and, after rejecting events shorter than an imposed dead time of 25 μs, the apparent interval durations were fitted by a two-state, C⇄O model to obtain the apparent opening and closing rate constants, βapp and αapp. The rate constants for exiting C and O were each reduced by a factor of 403 (e6) relative to λ so that the end states were isoenergetic (Θ = 1) and were separated by an average energy barrier of ≈6 kBT (33).
Fig. 1 shows a simulation with N = 6 and λ = 5 μs-1 (A* = 0.83 μs-1 from Eq. 4). The apparent O and C interval duration distributions were each well described by a single exponential with an apparent rate constant of ≈2,000 s-1. As predicted by Eq. 4, βapp scaled inversely with N and was equal to 2,000 s-1 as long as the condition λ/N ≈ 0.83 μs-1 was satisfied (data not shown). With small values of N, the time spent in the microstate ensemble is negligible; hence, the apparent opening and closing rate constants were the same regardless of whether these intermediates were classified as conducting or nonconducting.
A range can be set for N, and hence λ, from the number of gating blocks determined by Φ value analysis. So far, four blocks have been identified in the extracellular domain (two in each α-subunit) (12) and six more in the membrane domain (13, 19). Some of these blocks appear to move synchronously (11, 13). This (incomplete) map suggests that only a few block isomerizations are required to link the affinity change of the transmitter-binding sites with the conductance change of the pore. A reasonable range for N is between 3 and 10. Accordingly, λ would be between 2.6 μs-1 and 8.6 μs-1, making the microstate lifetime (τblock) between 390 ns and 116 ns. If n = 4, then λ = 3.44 μs-1 and τblock = 290 ns.
Speed-Limit Gating. The next simulation pertained to diliganded gating at the speed limit, i.e., with no net opening activation barrier (Fig. 2A). In the first of these simulations (n = 6 nonconducting microstates and λ = 5 μs-1) the exit rate constant from C was set equal to λ, and the dead time was 25 ns. With this energy profile, the apparent C interval durations were not monoexponential and decayed according to a power law (20). As predicted by Eq. 4, when all N microstates were nonconducting, the inverse of the mean C interval duration (A*) was equal to ≈0.83 μs-1.
Fig. 2.

Simulations of speed-limit gating. Speed-limit gating is defined as the condition in which there is no net activation barrier. In experiments with αD97 mutants, speed-limit gating occurs when the burst duration reached an asymptote (≈7.0 ms). This estimate may correspond to an apparent opening rate constant of ≈0.86 μs-1 (≈1.2-μs mean first passage time across the transition state ensemble). (A) The mean first passage time simulated by using a scheme with all transition states being nonconducting and with N = 6 and λ = 5 μs-1 is 1.25 μs. (Lower Right) The corresponding C interval duration histogram and density. The sampling interval was 10 ns and the dead time was 25 ns. (B) Incorporating ligand dissociation (50,000 s-1) from the first nonconducting state results in bursts that have a mean duration (τb) that is modestly greater than the experimentally determined asymptote. The brief gaps in the current trace are also apparent in experimental records and reflect occasional, long-lived sojourns along the transition-state ensemble.
Experimental data suggest that the apparent gating equilibrium constant (Θ) reaches a maximum value of ≈675 (33). One can rationalize the existence of an upper limit for this apparent equilibrium constant while at the same time allowing the energy difference between the end states (C and O) to be arbitrary. As the energy of C approaches that of the nonconducting microstates, these, too, will contribute to the apparent overall reaction equilibrium constant. That is, the nonconducting states that belong to the transition state ensemble are functionally closed, and it is occupancy in the entire aggregate of nonconducting states that determines the apparent equilibrium constant.
The second “barrierless” simulation mimicked the experimental parameter from which the speed limit was derived, namely the burst duration, τb (Fig. 2B). For the fast-opening AChR constructs, the experimental asymptote of this value (i.e., at the speed limit) was ≈7 ms. Bursts were simulated by incorporating a transmitter dissociation step (50,000 s-1; ref. 21 and references therein) from one or more of the nonconducting states of Scheme 1. When this dissociation step was only from the initial nonconducting state, τb = 8.4 ms, which is somewhat greater than the experimental result. With the addition of 50,000 s-1 dissociation steps from the subsequent nonconducting states, τb shrunk to 4.5, 3.1, 2.4, and 1.9 ms, which are all significantly shorter than the experimental value. These simulations suggest that fast agonist dissociation may occur mainly from only one of the nonconducting microstates, with the rest having a dissociation rate constant that is much smaller.
In these simulations, brief gaps were apparent (Fig. 2B) that represent occasional sojourns in the aggregate of (nonconducting) conformational microstates that were long enough to be detected by using a sampling interval of 10 μs. These events may correspond to the very brief gaps that are apparent in some experimental records (16). Under typical experimental conditions, these events would also be expected to generate excess open channel noise, as is present in AChRs (22).
The results so far indicate that Scheme 2 approximates some of the essential experimental results: a small number (N) of rigid-body-gating domains, approximately two-state behavior (with a dead time of 25 μs) for the overall reaction, an intrinsic gating rate constant of 2,000 s-1, and a τb asymptote of ≈7 ms. Only a speed limit for channel-opening has been measured; therefore, we have no information about the number of conducting conformations that might populate the transition state ensemble. Such states would be expected to set the maximum apparent rate constant for channel closing. In Scheme 2, all of the change from low-affinity (CL) to high-affinity (CH) takes place with the first block isomerization, which represents the movement of the transmitter-binding site. The CH states are nonconducting but have a high affinity for the agonist.
Physiological Gating. The apparent gating parameters for wild-type mouse α2βε AChRs activated by the natural transmitter ACh at -100 mV and 24°C are β = 48,000 s-1, α = 1,700 s-1 (Θ = 28), and τb = 1.2 ms. These experimental results could be reproduced by assuming that agonists influence only the equilibrium constant of the CL⇄CH transition (the isomerization of the first gating block). Currents elicited by ACh were simulated by using a modified version of Scheme 2 in which the forward exit rate constant from CL was increased from 0.012 μs-1 to 0.35 μs-1 (Fig. 3A). Accordingly, the equilibrium constant of the first step was 0.07 and that of the overall reaction was 28. Simulations with a 25-μs dead time show βapp = 49,800 s-1, αapp = 2,100 s-1, and τb = 1.6 ms, which are all in reasonably good agreement with the experimental values. Although in this simulation the first block transition occurred after an average delay of only ≈2.9 μs, an average of ≈7 exits from A2CL were required before arriving at the stable end-state, O. This result illustrates the possibility that ligands (agonists, inverse agonists, allosteric modulators) might act solely by altering the equilibrium constant of a single block transition.
Fig. 3.

Simulations of physiological gating. (A) Activation by the natural transmitter ACh. The rate constants of the stable C state (C) reflect dissociation (left arrow, 50,000 s-1) and the activation of the first gating block (right arrow, 350,000 s-1). The rate constants that are apparent in the simulations (long arrows) are close to the experimentally observed values (48,000 s-1 and 1,700 s-1, respectively). (Lower Left) The example currents. The sampling interval was 10 μs, and the dead time was 25 μs. (Bottom) Histograms of C, O, and burst durations. The simulated burst duration (τb) is close to the experimentally observed value (1.2 ms). (B) Desensitization. (Upper) The reaction scheme shown in A was modified by adding a long-lived state connected to the first, high-affinity/nonconducting intermediate of the transition state ensemble (see Scheme 2) by a rate constant of 10,000 s-1. (Lower) The simulated currents resemble experimentally observed clusters of openings. In principle, desensitization could arise from a process operating on one or more of the microstates of the gating reaction.
Upon continuous exposure to agonists AChRs enter “desensitized” states that are characterized by having a high affinity for agonists (like O) but no ionic conductance (like C) (23). The CH states speculated to populate the transition state ensemble have similar functional properties and would therefore be expected to resemble the desensitized AChR structure, at least at the transmitter binding site and the pore. This observation raises the possibility that “trapping” one or more of the CH intermediate states into a stable conformation (by some unspecified mechanism) could lead to long-lasting desensitization. Fig. 3B shows a simulation in which such a trapped state was added to the first CH state in Scheme 2, with an entry rate constant of 10,000 s-1. In these simulations, the CH state was trapped into the long-lived desensitized state only once every ≈1,000 sojourns, so that the apparent desensitization rate constant was only ≈10 s-1. These results demonstrate that the slow kinetics of desensitization in AChRs (15) could, in principle, be generated by a rapid process that operates on a fleeting microstate that is occupied with a low probability. Such bifurcation points (valley-ridge inflections) along reaction energy profiles have been identified in organic chemistry reactions (24).
Φ Values. The final set of simulations was designed to probe the overall REFER that would be apparent after perturbation of the equilibrium constant of each microstate isomerization (Fig. 4). We used Scheme 2 (N = 6, λ = 5 μs-1) and applied a ±3 kBT bias (in increments of 1 kBT) to each of the block equilibria, one at a time, which had the effect of changing the overall (apparent) equilibrium constant by ≈250-fold. The REFER analyses, which were generated from a plot of log (βapp) vs. log (βapp/αapp), show that there is a gradient in Φ values that spans the range 0–1.
In the field of protein-folding, fractional Φ values are thought to reflect intermediate structures (between native and denatured) within a single species rather than an average over parallel pathways in which the end-state interactions are either fully formed or broken (25). It is likely that a similar situation holds for AChR gating, with fractional Φ values reflecting a single structure that is intermediate between stable C and O (19). In Scheme 1, fractional Φ values indeed represent fractional structures but only when these structures are viewed at the level of the whole protein. That is, at the reaction end points, all of the gating blocks are in their resting or active conformations, but, in the transition state region, some blocks are resting and others are active. However, at the level of an individual block (or residue), the structural isomerizations are effectively two-state, with all of the residues within each block completely adopting either a fully resting or fully active conformation. The simulations suggest that such local and concerted structural events occurring on a broad, corrugated transition state ensemble can yield fractional Φ values. Although the forces that pertain in a denatured-to-native folding event vs. a native-to-native conformational change are likely to be quite different, the fractional Φ values observed as a consequence of a blockwise gating mechanism raise the possibility that folding, too, might be a blockwise process.
The REFER plots were linear for perturbations adjacent to the absorbing boundaries but were curved for the intermediate microstate transitions (a Hammond effect). The curvature was maximal for perturbations that were positioned near the middle of the overall reaction (Fig. 4 B Lower). The extents of curvature in the REFERs are larger than those that have been observed experimentally for this region of the reaction and this range of equilibrium constant (10, 13), which suggests that the energy profile for the AChR gating transition state is not completely flat and isotropic.
Gating As Diffusion of a “Defect.” Lauger (26) was the first to suggest that the mechanism of ion-channel gating might be described as the diffusion of energy (i.e., a conformational defect) through the protein, and several other groups have developed this idea (27–30). In the AChR, the distance between the transmitter-binding sites and the gate (L in Eq. 2) is ≈5 nm (3). A speed limit of ≈0.86 μs-1 implies that the molecular motions that occur during channel-opening over this expanse of the protein happen in ≈1.2 μs. That is, the gating conformational event linking the stable C and O states propagates at an average velocity of ≈4.3 nm/μs. Although the nature and timing of the AChR gating molecular movements are not known in detail, this suggests that agonists experience the high-affinity environment of the transmitter-binding sites hundreds of nanoseconds before ions start to move rapidly through the channel. It has been shown that the step increase in conductance in AChRs occurs in <2 μs (31).
We can estimate an apparent, one-dimensional, average, internal diffusion constant, Dint, for AChR gating by rearranging Eq. 3:
 |
[5] |
With A* = 0.86 μs-1, L = 5 × 10⁻⁷ cm and N = 4, which yields a characteristic microstate hop distance of 12.5 Å, approximately the diameter of a gating block in the extracellular domain (11), Dint = 2.7 × 10⁻⁸ cm2·s-1, for AChR gating. As a point of reference, this value is ≈44 times smaller than the diffusion constant of ribonuclease in water, an object that is significantly larger than a typical gating block. Note, however, that the use of a square barrier energy profile ignores entropy and attributes all of A* to friction; hence, this estimate of Dint for AChRs should be taken as a lower limit.
These experiments and simulations demonstrate that a simple reaction mechanism characterized by Brownian motion provides a reasonably good, first-order approximation of AChR gating. AChR gating, could it be visualized, would appear as a coarse-grained, staggering sequence of back-and-forth motions of a small number of rigid-body domains rather than as a continuous, smooth transition joining the stable C and O states (Movie 1, which is published as supporting information on the PNAS web site). I speculate that the dynamics of AChR gating is governed by the Brownian motion of its discrete, moving parts.
Undoubtedly, the energy profile for AChR gating is more complex than the one explored here. The transition state ensemble is likely to contain conducting and nonconducting microstates. The energy profile is probably biased, nonisotropic, and even malleable (32). Further computational and kinetic analyses may reveal more precisely the number of gating blocks and the extent of curvature of the REFERs and may lead to a unique energy profile for the AChR gating machine.
Supplementary Material
Acknowledgments
I thank S. Chakrapani, F. Sachs, O. Andersen, and F. Qin for comments and suggestions and G. Lema for assembling Movie 1.
This paper was submitted directly (Track II) to the PNAS office.
Abbreviations: O, open; C, closed; ACh, acetylcholine; AChR, ACh receptor channel; CL, low-affinity C; CH, high-affinity C; REFER, rate-equilibrium free-energy relationship.
References
- 1.Doyle, D. A., Morais Cabral, J., Pfuetzner, R. A., Kuo, A., Gulbis, J. M., Cohen, S. L., Chait, B. T. & MacKinnon, R. (1998) Science 280, 69-77. [DOI] [PubMed] [Google Scholar]
- 2.Jiang, Y., Lee, A., Chen, J., Cadene, M., Chait, B. T. & MacKinnon, R. (2002) Nature 417, 523-526. [DOI] [PubMed] [Google Scholar]
- 3.Miyazawa, A., Fujiyoshi, Y. & Unwin, N. (2003) Nature 424, 949-955. [DOI] [PubMed] [Google Scholar]
- 4.Liu, Y. S., Sompornpisut, P. & Perozo, E. (2001) Nat. Struct. Biol. 8, 883-887. [DOI] [PubMed] [Google Scholar]
- 5.Karlin, A. (2002) Nat. Rev. Neurosci. 3, 102-114. [DOI] [PubMed] [Google Scholar]
- 6.Unwin, N. (2000) Philos. Trans. R Soc. London B 355, 1813-1829. [DOI] [PMC free article] [PubMed] [Google Scholar]
- 7.Brejc, K., van Dijk, W. J., Klaassen, R. V., Schuurmans, M., van Der Oost, J., Smit, A. B. & Sixma, T. K. (2001) Nature 411, 269-276. [DOI] [PubMed] [Google Scholar]
- 8.Miyazawa, A., Fujiyoshi, Y. & Unwin, N. (2003) Nature 423, 949-955. [DOI] [PubMed] [Google Scholar]
- 9.Wang, H. L., Auerbach, A., Bren, N., Ohno, K., Engel, A. G. & Sine, S. M. (1997) J. Gen. Physiol. 109, 757-766. [DOI] [PMC free article] [PubMed] [Google Scholar]
- 10.Grosman, C., Zhou, M. & Auerbach, A. (2000) Nature 403, 773-776. [DOI] [PubMed] [Google Scholar]
- 11.Chakrapani, S., Bailey, T. D. & Auerbach, A. (2003) J. Gen. Physiol. 122, 521-539. [DOI] [PMC free article] [PubMed] [Google Scholar]
- 12.Chakrapani, S., Bailey, T. D. & Auerbach, A. (2004) J. Gen. Physiol. 123, 341-356. [DOI] [PMC free article] [PubMed] [Google Scholar]
- 13.Mitra, A., Bailey, T. D. & Auerbach, A. L. (2004) Structure (Cambridge, MA, U.S.) 12, 1909-1918. [DOI] [PubMed] [Google Scholar]
- 14.Hatton, C. J., Shelley, C., Brydson, M., Beeson, D. & Colquhoun, D. (2003) J Physiol. (London) 547, 729-760. [DOI] [PMC free article] [PubMed] [Google Scholar]
- 15.Elenes, S. & Auerbach, A. (2002) J. Physiol. (London) 541, 367-383. [DOI] [PMC free article] [PubMed] [Google Scholar]
- 16.Parzefall, F., Wilhelm, R., Heckmann, M. & Dudel, J. (1998) J. Physiol. (London) 512, 181-188. [DOI] [PMC free article] [PubMed] [Google Scholar]
- 17.Redner, S. (2001) A Guide to First Passage Processes (Cambridge Univ. Press, Cambridge, U.K.).
- 18.Farkas, Z. & Fulop, T. (2001) J. Phys. A Math. Gen. 34, 3191-3198. [Google Scholar]
- 19.Cymes, G. D., Grosman, C. & Auerbach, A. (2002) Biochemistry 41, 5548-5555. [DOI] [PMC free article] [PubMed] [Google Scholar]
- 20.Millhauser, G. L., Salpeter, E. E. & Oswald, R. E. (1988) Proc. Natl. Acad. Sci. USA 85, 1503-1507. [DOI] [PMC free article] [PubMed] [Google Scholar]
- 21.Grosman, C. & Auerbach, A. (2001) Proc. Natl. Acad. Sci. USA 98, 14102-14107. [DOI] [PMC free article] [PubMed] [Google Scholar]
- 22.Sigworth, F. J. (1985) in Biophys. J. 47, 709-720. [DOI] [PMC free article] [PubMed] [Google Scholar]
- 23.Auerbach, A. & Akk, G. (1998) J. Gen. Physiol. 112, 181-197. [DOI] [PMC free article] [PubMed] [Google Scholar]
- 24.Singleton, D. A., Hang, C., Szymanski, M. J. & Greenwald, E. E. (2003) J. Am. Chem. Soc. 125, 1176-1177. [DOI] [PubMed] [Google Scholar]
- 25.Oliveberg, M. (2001) Curr. Opin. Struct. Biol. 11, 94-100. [DOI] [PubMed] [Google Scholar]
- 26.Lauger, P. (1988) Biophys. J. 53, 877-884. [DOI] [PMC free article] [PubMed] [Google Scholar]
- 27.Millhauser, G. L., Salpeter, E. E. & Oswald, R. E. (1988) Biophys. J. 54, 1165-1168. [DOI] [PMC free article] [PubMed] [Google Scholar]
- 28.Liebovitch, L. S., Fischbarg, J., Koniarek, J. P., Todorova, I. & Wang, M. (1987) in Biochim. Biophys. Acta 896, 173-180. [DOI] [PubMed] [Google Scholar]
- 29.Goychuk, I. & Hanggi, P. (2002) Proc. Natl. Acad. Sci. USA 99, 3552-3556. [DOI] [PMC free article] [PubMed] [Google Scholar]
- 30.Condat, C. A. & Jackle, J. (1989) Biophys. J. 55, 915-925. [DOI] [PMC free article] [PubMed] [Google Scholar]
- 31.Maconochie, D. J., Fletcher, G. H. & Steinbach, J. H. (1995) Biophys. J. 68, 483-490. [DOI] [PMC free article] [PubMed] [Google Scholar]
- 32.Grosman, C. (2003) Biochemistry 42, 14977-14987. [DOI] [PMC free article] [PubMed] [Google Scholar]
- 33.Chakrapani, S. & Auerbach, A. (2005) Proc. Natl. Acad. Sci. USA 102, 87-92. [DOI] [PMC free article] [PubMed] [Google Scholar]
Associated Data
This section collects any data citations, data availability statements, or supplementary materials included in this article.