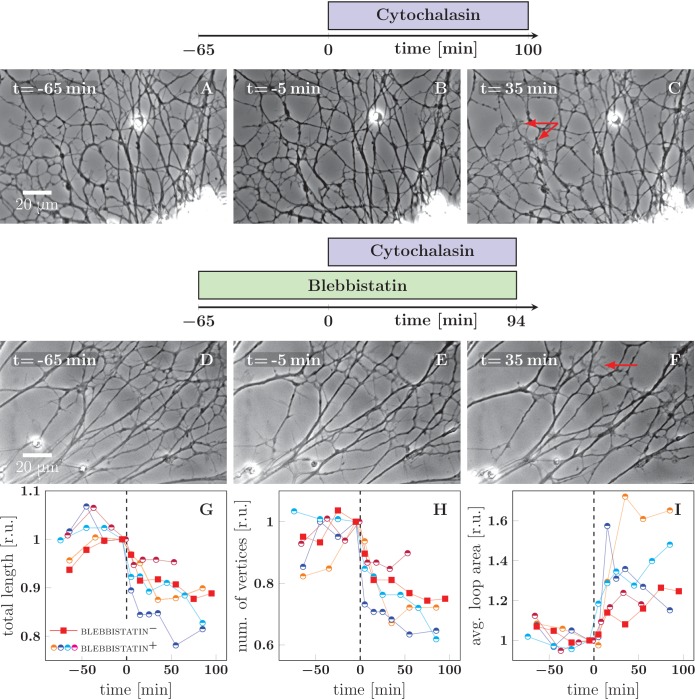
Figure 6. Cytochalasin-induced fasciculation of axon shafts.
The schemes indicate the protocol of drug addition for the experiments that are shown on the frames below the schemes. (A–C) Cytochalasin was added to the culture at =0 min. While there is little visible change between −65 and −1 min, the network exhibits coarsening between 0 and 35 min. The full recording is provided as Figure 6—source data 2. (D–F) The culture was pretreated with blebbistatin before =−65 min. Little change is visible between −65 and −1 min. After cytochalasin addition at =0 min, the culture exhibits coarsening. The full recording is provided as Figure 6—source data 3. The red arrows in frames C and F indicate prominent lamellipodia, which appear after the addition of cytochalasin. (G–I) The network statistics for the experiment of panel (A–C) (red squares), panel (D–F) (blue half-circles), and three other experiments with protocol equivalent to D–F, shown as Figure 6—source data 4 (orange half-circles), Figure 6—source data 5 (purple half-circles) and Figure 6—source data 6 (cyan half-circles). (G) Total length of the axon network in the field. (H) Total number of vertices of the axon network in the field. (I) Average area of cordless closed loop in the axonal network. The networks were manually segmented and analyzed as indicated in Materials and methods. In (G–I), the data was aligned by the time of cytochalasin addition marked =0 min and normalized by the value of the last measured timepoint before the drug was added. A sharp decrease of total length and of the number of vertices, as well as increase of average loop area, is seen within 30 min after =0 min, indicating coarsening of the network triggered by cytochalasin addition. Segmentation data and frames are available in Figure 6—source data 8 (please consult Materials and methods), source code used to generate the network statistics and input data is in Figure 6—source data 1, the data points plotted in panels G–I are in Figure 6—source data 7.
DOI: http://dx.doi.org/10.7554/eLife.19907.019

