Abstract
To evaluate variations in the use of adjuvant endocrine therapy (AET) by race and geography, this research examined their influence on initiation and adherence to AET in female Medicare enrollees with breast cancer, diagnosed between 2007 and 2011.
Using SEER (Surveillance, Epidemiology, and End Results Program)-Medicare data from 2007 to 2001, logistic regressions with random intercept for county of residence were used to predict AET initiation during 1st year and AET adherence assessed by the medication possession ratio (MPR) during year after initiation in a sample of fee-for-service medicare beneficiaries. Part D enrollment was required for the examination of adherence. Independent variables examined were race (black, white, or other) and geographical indicators (area deprivation, non-metropolitan status, and physician shortage).
Overall, 23% of patients did not initiate AET within 1 year and 26% of the initiation sample was not adherent to AET, with average follow-up time among initiators of 141 days and an average MPR of 0.84. Significant heterogeneity (P < .01) was found between SEER sites, with initiation rates as low as 69% for Washington and as high as 81% for New Jersey; MPR adherence varied from 77% in New Jersey to 68% in Utah.
Blacks had lower initiation, enrollees not in Medicaid had lower adherence, lower area deprivation counties had lower initiation, earlier SEER-Medicare years had both later initiation and nonadherence, and significant (P < .05) variations between SEER sites remained after accounting for area deprivation index, metropolitan status, and physician shortage. Subgroup analysis showed particular pockets of lower initiation for blacks with stage III tumors, on chemotherapy and lower adherence for blacks in youngest age group, with stage III tumors, tamoxifen use and blacks/others in oldest age group.
Black women and women living in states with more rurality in the United States were less likely to receive guideline-recommended AET, which necessitates future efforts to alleviate these disparities to improve AET use and ultimately pursue more survival gains through optimizing adjuvant treatment use among cancer survivors.
Keywords: adjuvant hormone therapy, disparities, geography, race
1. Introduction
For women with hormone-receptor positive breast cancer, adjuvant endocrine therapy (AET) is a critical part of postcancer treatment and is recommended to prevent recurrence.[1] For hormone-receptor positive women, use of tamoxifen is associated with reduced mortality and cancer recurrence.[2,3] Additionally, newer AET treatments, like aromatase inhibitors (AIs), are also effective at reducing breast cancer mortality.[4] Given the benefits of AET, disparities in utilization of AET are of concern because they may result in disparities in breast cancer recurrence and mortality.
Despite the benefits, marked racial disparities in AET use have been documented. For example, black, Latina, and Chinese women with early stage breast cancer are less likely to initiate or receive AET than their non-Latina white counterparts,[5–7] mirroring disparities in cancer treatment more broadly.[8] However, these patterns have been shown to vary with drug under consideration (tamoxifen or aromatase inhibitors) or geographic setting, with some studies showing that Latina, black, and Asian American women are more likely to initiate AET than non-Latina white women[9,10] and others showing no racial differences in receipt of AET.[11] Finally, black and Latina women are less likely to discontinue AET and are more likely to be adherent to AET regimens than non-Latina white women.[12]
Considerably less attention has been paid to geographic disparities in access to and utilization of AET. No disparities in adherence to AET by state or health professional shortage area (HPSA) designation have been shown among some Appalachian states.[13] However, geographic disparities have been documented when examining other cancer care. In the United States, 40% of health referral regions do not have a gynecologic oncologist and 36% of counties are more than 50 miles from a gynecologic oncologist,[14] suggesting considerable geographic barriers to accessing cancer care. Also, among stage III colorectal cancer patients, rurality is associated with lower likelihood of receiving chemotherapy.[15] Thus, overall evidence suggests that patients in geographically isolated regions have poorer access to cancer care.
Given the importance of access to and utilization of AET, the present study examined if racial and geographic disparities exist in AET use. We explored if these factors impacted AET initiation and adherence following a breast cancer diagnosis among women enrolled in the Medicare Part D drug benefit program from 2007 to 2011.
2. Methods
2.1. Study design and population
All study procedures received approval from the University of Virginia's Institutional Review Board and by the Center for Medicaid and Medicare Services, Information Management System. Data for this study come from linked Surveillance, Epidemiology and End Results (SEER) and Medicare data (i.e., SEER-Medicare). The SEER-Medicare linked database is a multisite database which merges clinical, demographic, and treatment characteristics from various site registries with Medicare medical claims and Medicare Part D pharmacy claims. Figure 1 shows how the study sample was derived. From a total of 166,619 breast cancer cases diagnosed from 2007 to 2011, beneficiaries were required to be continuously enrolled in fee for service coverage in Medicare Parts A and B and Part D Medicare prescription drug benefit program 1 year pre- and postdiagnosis (N = 34,257). Only first ever diagnosed tumor cases were included (N = 31.247); resulting cases were required to have pathological confirmation, be American Joint Committee on Cancer stage I–III, be estrogen receptor positive (ER+) and/or progesterone receptor positive (PR+) and have a nonautopsy source. Synchronous cases or cases with second tumors within 1 year from diagnosis were excluded. For the final sample of 18,054, we verified cases that did not have AET in the year before diagnosis and were at least 18 years old at time of diagnosis. AET use was measured using the Part D pharmacy claims and included use of tamoxifen and Aromatase Inhibitors (i.e., anastrozole, letrozole, and exemestanes), consistent with previous studies.[13,16]
Figure 1.
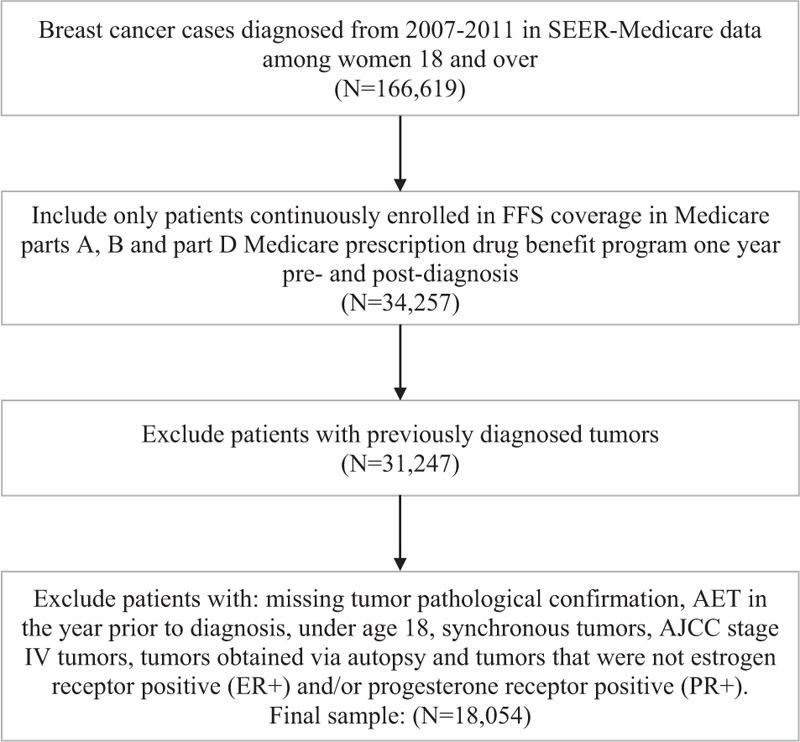
Derivation of study population.
2.2. Variables
The 2 study outcomes consisted of initiation of AET during the year after diagnosis, and adherence to treatment among the beneficiaries with 1 year Part D enrollment follow-up after timely initiation (n = 13,716). Adherence was assessed by the medication possession ratio (MPR).[17] A calendar version was used where MPR was calculated as the supply of medication during the year divided by the number of days during year (365).[18] A conventional cutoff of 0.80 for MPR was used to categorize adherence (MPR ≥ 0.8) and nonadherence (MPR < 0.8), truncated to the range of 0 to 1.
We had 2 main independent variables: race and metropolitan status, while also considering the impact of other potential demographic, geographic, clinical, and treatment predictors of AET use. Race categories were: white, black, and other. Metropolitan status of patient residence was based on 2013 US Department of Agriculture classification scheme distinguishing metropolitan counties by population size of metro area compared to non-metropolitan counties by degree of urbanization and adjacency to a metro area.[19]
The following variables were extracted for analysis from the SEER cancer registry databases: age at diagnosis, year at diagnosis, marital status (single/other vs married), clinical tumor characteristics including stage, lymph node status (positive, negative). Treatment variables included receipt of radiation, type of primary course surgery [none, breast conserving surgery (BCS), mastectomy], and chemotherapy. Receipt of chemotherapy during the year from diagnosis was created by searching Healthcare Common Procedure Coding System and International Classification of Diseases-9 codes in physician and outpatient claims.
A geographical marker of area deprivation, the area deprivation index (ADI), at the county level was measured with a publically available score.[20] The score is derived from an index of 17 different markers of socioeconomic status.[21] Sample ADI index had a high correlation with socioeconomic indicators from the area resource file for the midpoint year (2009), such as percent of people in poverty (ρ = 0.59) and median household income (ρ = −0.84). For this study, the ADI score was categorized into sample based quartiles, with lowest quartile corresponding to lowest deprivation.
Primary Care Physician shortage at county of residence was assessed by using a 2010 Health Professional Shortage Area (HPSA) variable available from an Area Resource File from the Health Resources and Services Administration, based on geographic area criteria provided.[22] An area is flagged as indicating shortage based on several factors, including primary care provider (PCP) supply ratio, and lack of accessibility to contiguous areas.
Patient level socioeconomic status was included in the form of an indicator for dual status, or whether the enrollee was entitled to some form of Medicaid benefit. Duals included all enrollees with indication for Qualified Beneficiary, Specified Low-Income Beneficiary, Qualifying Individual, among others. A patient was considered dual if the dual status indicator was flagged within a year from diagnosis.
The Charlson comorbidity index was calculated from available SAS macros,[23] which include rule-out rules requiring unique physician and outpatient claims separated by at least 30 days.[24] Claims were searched during a 1 year time window starting from diagnosis in physician, outpatient, and hospital claims, as described elsewhere.[25] The index was categorized into three levels, with patients having a score of zero having the lowest level compared to patients with a score of one and a score of 2 or greater.
2.3. Statistical methods
Bivariate associations were calculated to determine if each variable in this study was associated with either AET initiation or adherence (Table 1). The relationship between predictors and outcomes was assessed using a logistic regression with random intercepts, where lack of initiation and low adherence were analyzed as binary variables whose log odds was expressed as a function of the predictors plus a random error term unique to county (Table 2). Race/ethnicity, metropolitan residence, and all other variables (with the exception of AET initiation in adherence models) were included in the same models in order to calculate the independent effects of race/ethnicity and geography. Because they were rare outcomes,[26] lack of initiation and nonadherence were examined in order to make the odds ratio interpretation a better approximation of relative risk. Subgroup analyses were performed by investigating significant interactions added to the model between race, metropolitan status, and study covariates (Tables 3 and 4). These models also accounted for all other variables. Due to low missing data rates (0.1%), observations with missing data were dropped from the regression sample. Marginally standardized probabilities[27] were calculated. The predictions were based on a best linear unbiased predictor, which incorporates the contribution from the random effects in addition to the fixed effects when estimating the probabilities. The SAS 9.4 procedure “GLIMMIX” was used to estimate parameters. Finally, cumulative incidence functions were plotted for each racial/ethnic group to better visualize adherence as a function of time since diagnoses (Fig. 2). This was done using SAS/STAT 14.1 procedure “LIFETEST.” Competing events accounted for were: end of Part D enrollment, death, or subsequent cancer diagnosis.
Table 1.
Medicare beneficiary sample characteristics.
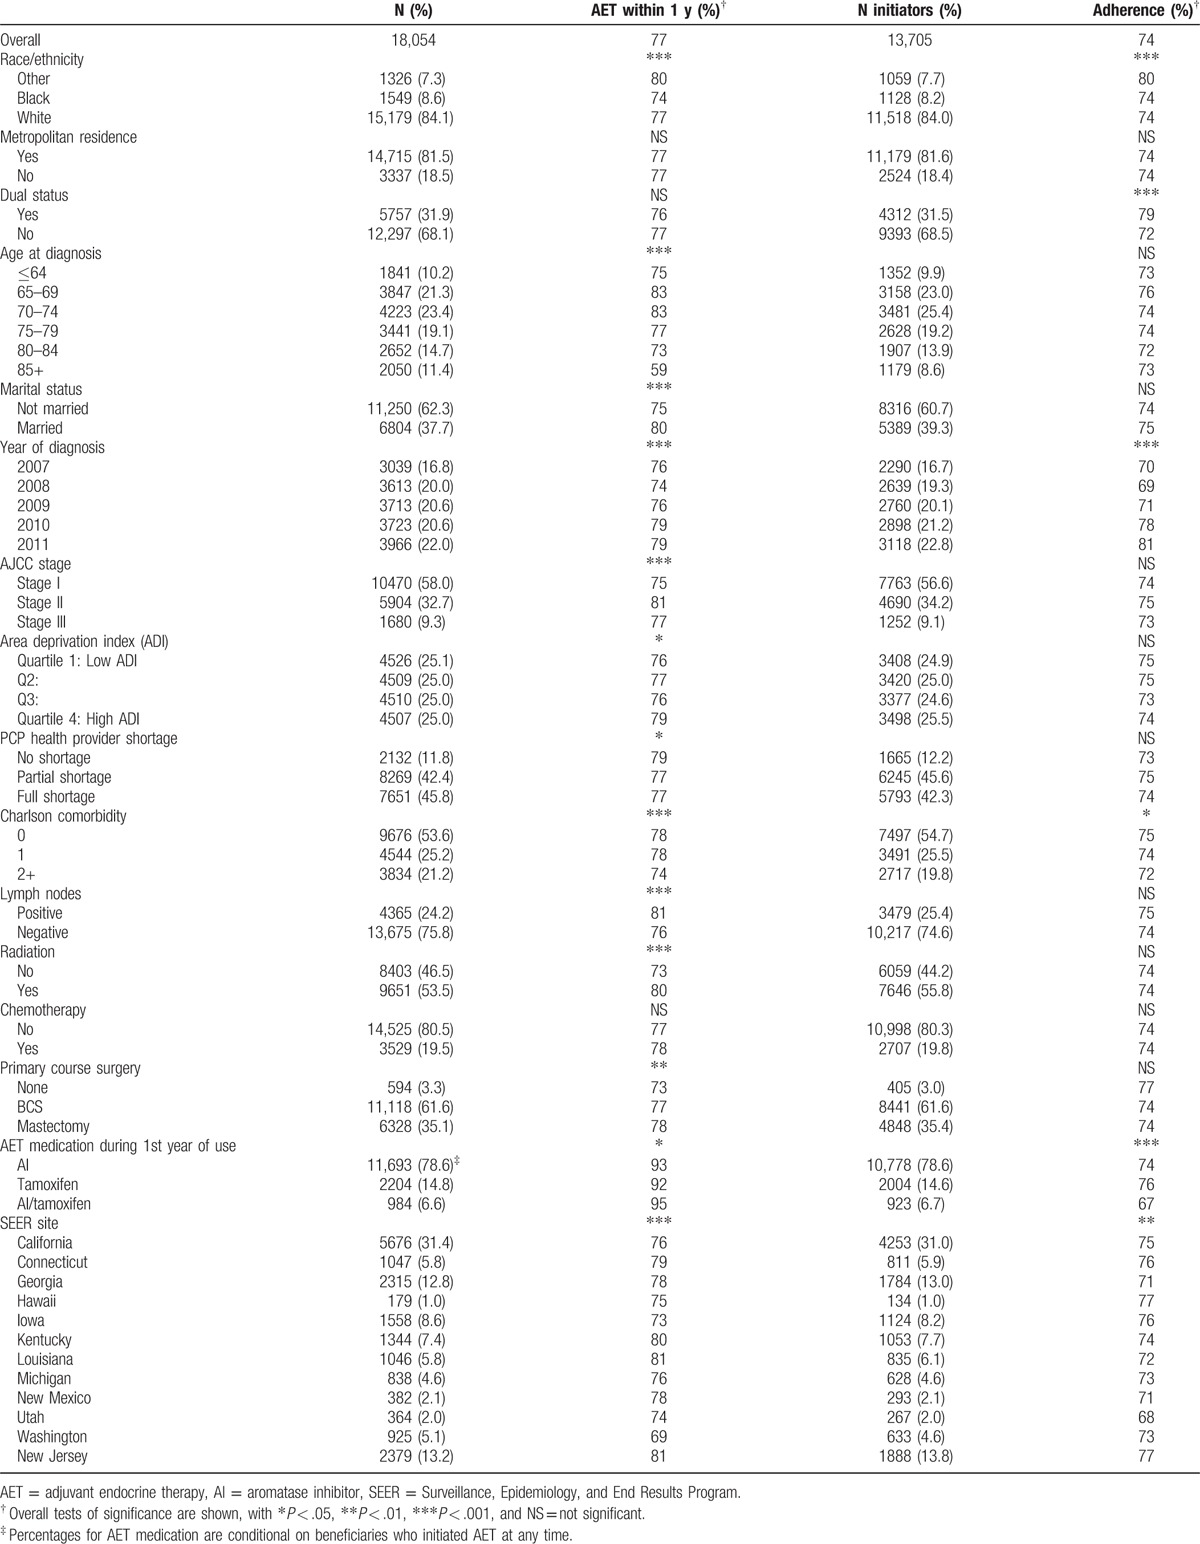
Table 2.
Odds ratios and marginal probabilities from logistic regression with random intercept.
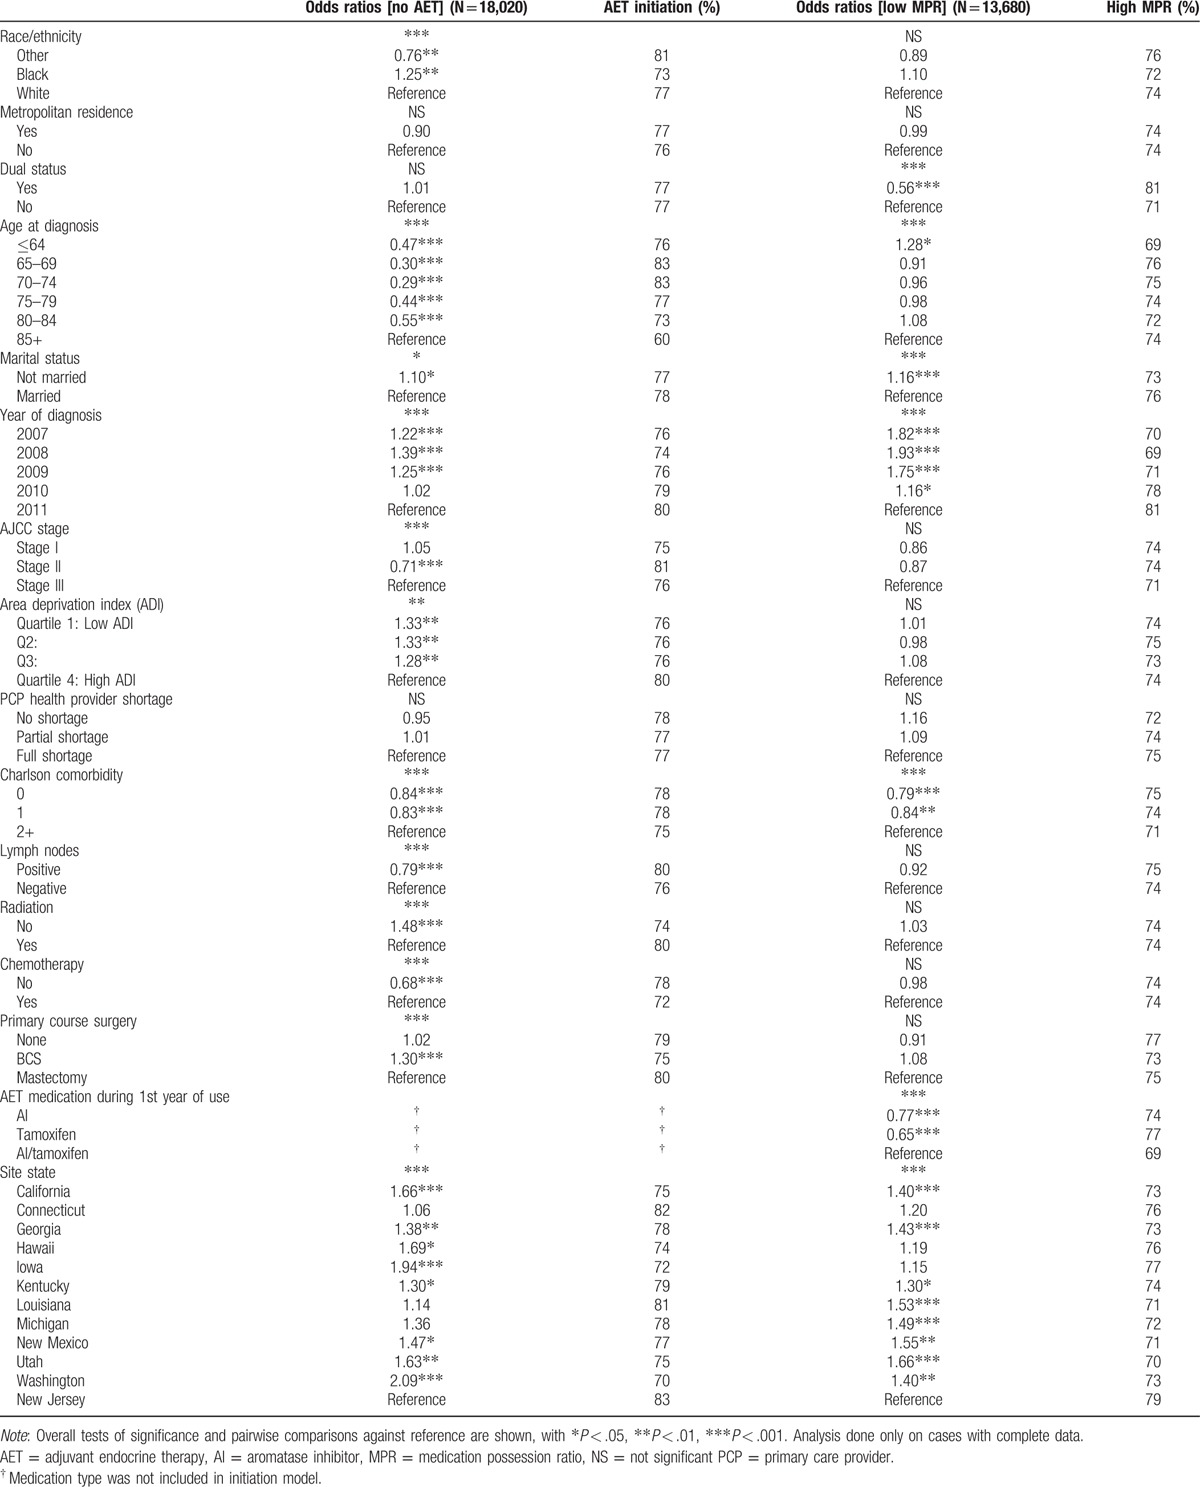
Table 3.
Subgroup comparisons for AET initiation.

Table 4.
Subgroup comparisons for MPR adherence.
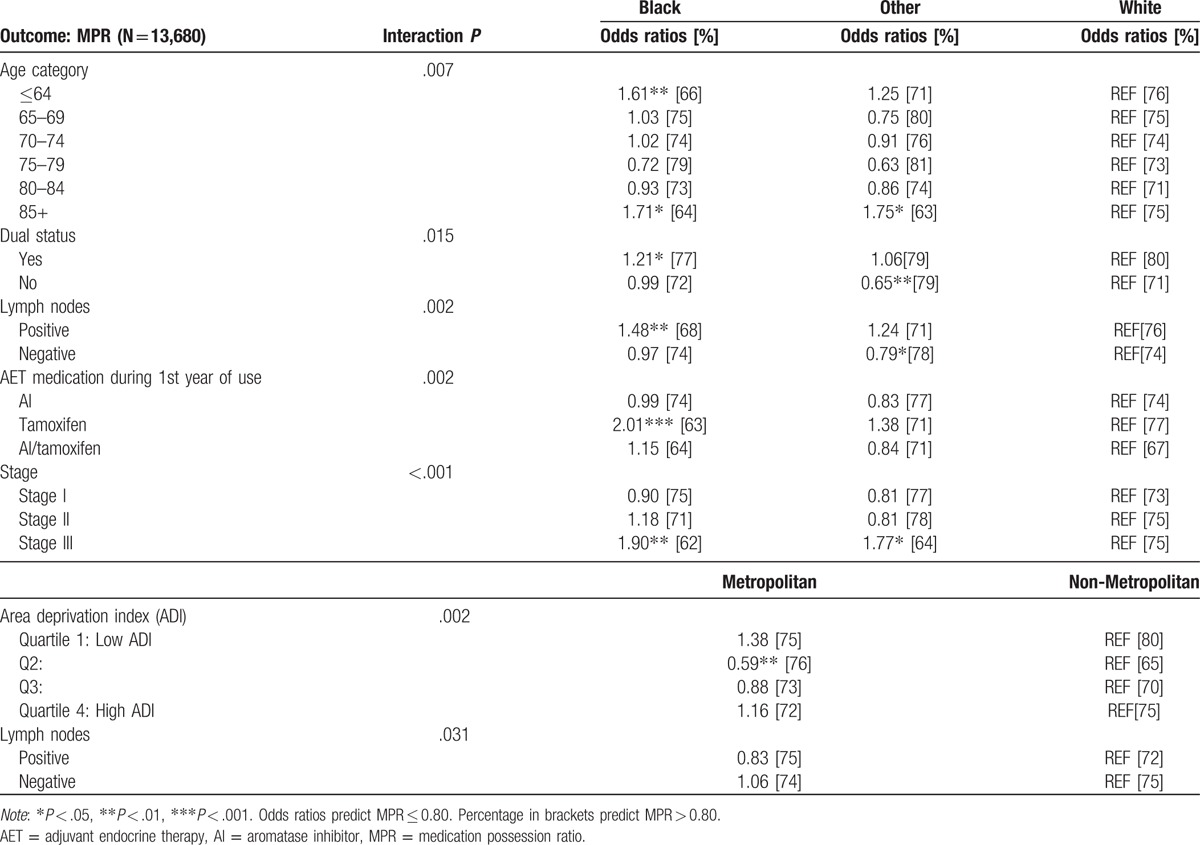
Figure 2.
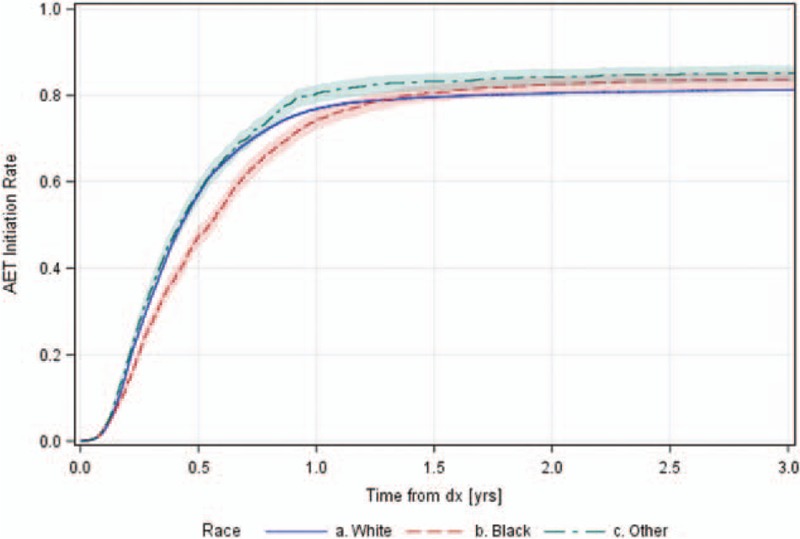
Cumulative adjuvant endocrine therapy (AET) initiation by patient race.
3. Results
Table 1 shows the distribution of sample characteristics over the 18,054 cases and 13,705 subset of AET initiators. Most frequent characteristics in sample included being white (84%), metropolitan residence (81%), no Medicaid enrollment (68%), residence in full shortage or partial PCP shortage county (46%, 42%), not married (62%), no comorbidities (54%), lymph node-negative (76%), receipt of radiation (53.5%), no chemotherapy (81%), and BCS as primary course of care (62%). The mean age was 73.5. Most patients on AET therapy had AIs only during first year (78.6%).
Overall, 23% of patients did not initiate AET within 1 year and 26% of the initiation sample was not adherent to AET, with average follow-up time among initiators of 141 days and an average MPR of 0.84. By conducting overall tests of association followed by pairwise comparisons, significant differences were found in initiation by race/ethnicity, with blacks having lower initiation rates than whites (74% vs 77%, P = .023), and other races having the highest initiation rate (80% vs 77%, P < .01). Additionally, other races had significantly higher adherence (80%, P < .001) compared to blacks and whites (74%, 74%).
Figure 2 shows cumulative incidence functions for AET initiation from diagnosis to 3 years for each race, taking loss to follow-up due to drop-out, 2nd tumor, or death into account. Before 1 year, blacks have a consistently lower probability of initiating AET. After 1 year, initiation rate plateaus close to 80%, with blacks and others having an eventual higher rate of AET initiation when compared to whites, though comparisons are not statistically significant based on the 95% confidence band overlap.
Comparisons by metropolitan residence were not significant for either initiation or adherence. Lower initiation was significantly associated, at P < .05, with older age group of 85+ versus younger age (59% vs 79%), not being married (75% vs 80%), earlier year of diagnosis (76–79%, Ptrend < .001), stage I, III (75%, 77%) versus stage II (81%), lower ADI quartiles versus highest (76% vs 79%), full/partial HPSA shortage versus none (77% vs 79%), highest comorbidity category versus other (74% vs 78%), lymph node-negative status (76% vs 81%), no radiation treatment (73% vs 80%), and not having a surgery (73% vs 77%). Lower MPR rates were found in those not having Medicaid enrollment (72% vs 79%), earlier year of diagnosis (70–81%, Ptrend < .001), and highest Charlson index category versus lower categories (72% vs 74%, 75%). Significant heterogeneity (P < .01) was found between SEER sites, with initiation rates as low as 69% for Washington and as high as 81% for New Jersey; MPR adherence varied from 77% in New Jersey to 68% in Utah.
Table 2 displays odds ratios and marginal probabilities from the random intercept logistic regression models predicting failure to initiate and low MPR. The variance of the random effect for the model predicting initiation was 0.05, with a test of hypothesis for variance equal to zero being rejected with P < .001, suggesting the presence of additional unseen county level predictors. Variance for the model predicting MPR use was set to zero by the estimation procedure in proc GLIMMIX, suggesting no residual geographic variation at county level was detected after accounting for the geographical level covariates in the analysis (metropolitan, ADI, HPSA, site). Consequently, the model for MPR adherence omitted any random component.
After covariate control, lower initiation odds at P < .05 were detected between black versus white (OR = 1.25), and other versus white (OR = 0.76). Different odds of initiation were found for the younger age groups versus those 85+ (ORs = 0.29–0.55), not married status versus married (OR = 1.10), earlier years of diagnosis 2007 to 2009 versus 2011 (ORs = 1.22, 1.39, 1.25), stage II versus III (OR = 0.71), lower ADI quartiles Q1 to Q3 versus highest quartile (ORs = 1.33, 1.33, 1.28), highest Charlson index category versus other categories (ORs = 0.84, 0.83), having positive lymph nodes (OR = 0.79) lack of radiation treatment (OR = 1.48), presence of chemotherapy treatment (OR = 0.68), and getting BCS versus mastectomy (OR = 1.30). Significant site differences were found (P < .001) between the highest initiation site (New Jersey) and most other sites.
Nonadherence to AET (P < .05) was associated with dual eligibility status (OR = 0.56), youngest age group (≤64) versus oldest (85+, OR = 1.28), not being married (OR = 1.16), 2007 to 2010 years of diagnosis versus 2011 (ORs = 1.82–1.16; 70–78% vs 81), and highest Charlson index versus other (ORs = 0.79, 0.84). Significant site differences were found (P < .001) between the highest initiation site (New Jersey) and most other sites.
Tables 3 and 4 display the subgroup comparisons. When predicting AET initiation, covariates which interacted with race included stage, chemotherapy, and lymph node status (all P < .001); covariates which interacted with metropolitan status included radiation and chemotherapy treatment (P = .037 and P < .001). Variation in odds ratios by strata coincide with different marginal probability profiles between reference category and the comparison category for both race and metropolitan status. Particularly, lower initiation rates compared to other group average were found for blacks with stage III (68%), blacks with chemotherapy (68%), and non-metropolitan cases without chemotherapy (74%). When predicting adherence, covariates which interacted with race included age (P = .007), dual status (P = .015), lymph nodes (P = .002), type of medication (P = .002), and stage (P < .001); covariates which interacted with metropolitan status were ADI (P = .002) and lymph node status (P = .031). Lowest adherence was predicted in the youngest cohort (≤64) of blacks (66%), oldest age cohort (85+) of blacks and other race (64% and 63%), blacks with positive lymph nodes (68%), blacks and white nonduals (72% and 71%), blacks and other race with stage III (62%, 64%) and blacks on tamoxifen (63%). Lastly, low adherence rates were predicted in non-metropolitan Q2 ADI (65%).
4. Discussion
The results of this study showed that Black women were less likely to receive AET within 1 year after diagnosis compared to whites and others. This mirrors significant racial disparities observed throughout the breast cancer trajectory. Black women have the highest breast cancer mortality rates in the United States, and this disparity has persisted over time.[28] This discrepancy may be due to several reasons. For example, Black women have a higher likelihood of receiving a late-stage diagnosis relative to white women,[28] tend to be younger at the time of diagnosis, increasing the likelihood of more aggressive tumors,[29] and had inferior utilization of breast cancer treatment. Other potential factors contributing to racial/ethnic disparities include greater perceived barriers, inadequate knowledge and misbeliefs about screening, treatment, and follow-up care.[30] Furthermore, black women are less likely to receive definitive therapy for breast cancer as compared to white women.[31] These racial disparities have not dissipated over time.[32] Interestingly, after 1 year postdiagnosis, racial disparities in AET initiation are no longer observed between Black and white women, potentially reflecting a selection effect as a result of the more aggressive disease seen among Black women. That is, Black women who survive a year past diagnoses may differ sharply from their peers who do not.
In contrast to the observed racial disparities in initiating AET, this study did not find expected differences in initiation or adherence of AET by geographical markers for underserved areas (i.e., high ADI, rural status, and health provider shortage), although regional differences by SEER site (e.g., New Jersey is less rural than Utah) persisted after adjusting for covariates including the above geographical indicators. Findings are counter to the narrative that geographic disparities in AET initiation may be attributable to regional economic factors and low access to care. In fact, regions with the highest deprivation had higher initiation. However, prior findings in Medicare populations linking geographical factors to initiation did not yield enough statistical evidence to make these attributions.[33] Other explanations for geographic differences in initiation include regional differences in best treatment practices and remain areas of future study.
Although no overall difference in adherence to AET in blacks and whites were found, subgroup analysis detected significantly lower adherence in various subgroups, particularly black patients who were youngest aged (≤64), oldest aged (85+), used tamoxifen and were stage III, compared to whites. Main effect analyses may thus hide effect heterogeneity and lack of adherence in particular minority subgroups. Earlier work has shown no significant racial differences in adherence rates,[34] though it is not clear to what extent the effect was investigated in the mentioned subgroups. Studies conducted in the past to assess adherence to AET in patients with breast cancer have shown mixed results,[35] which could perhaps be a symptom of effect heterogeneity in the association between race and AET adherence. Recognition of differences between specific subgroups may be important, as recognizing the variations in health care received could assist policy makers in developing strategies or recommendations targeted at particular populations.
The nonadherence to AET rate in our study was found to be 26%, which was comparable to the nonadherence rates assessed in other studies using claims data, which ranged from 20% to 30%.[36–39] Nonadherence to breast cancer treatments have shown to increase morbidity and mortality, which could be one of the factors contributing to racial disparities.[32] However, little evidence is available about adherence to AET in different racial groups,[32] allowing our study to expand this knowledge base.
No significant differences between geographical indicators of underserved areas and AET were observed, although site differences remained after covariate adjustment. Unaccounted regional differences could be attributable to individual variables not controlled for in this study, including functional status, depressive symptoms, and lack of social support.[40] Other important omitted variables may include: access to transportation, access to medications (proximity of nearest pharmacy, pharmacy density in the area, medication stock, etc.).[41] Significant differences in AET adherence at a geographical level have been observed previously in other regions such as Appalachia, with socioeconomic factors and metropolitan residence not being predictive of adherence.[42]
This study is not without limitations. Use of prescription Part D claims for estimation of adherence may not reflect accurate patient's medication taking behaviors. Furthermore, findings of this study may not be generalizable to patients enrolled in insurance programs other than Medicare. Hence, these findings should be interpreted with caution. Furthermore, future work should attempt to utilize longer follow-up periods, if possible.
Despite these limitations, our study aimed to understand one of the critical gaps in the healthcare system. Disparities lead to significantly higher expenditures. Health inequities were estimated to contribute $1.2 trillion in lost wages and productivity between 2003 and 2006.[43] Efforts are needed to improve quality of care across the US healthcare system, with particular attention on minority populations. Future research is warranted to understand disparities across different population groups, and to evaluate outcomes over longer period.
Footnotes
Abbreviations: ADI = area deprivation index, AET = adjuvant endocrine therapy, HPSA = health professional shortage area, MPR = medication possession ratio, SEER = Surveillance, Epidemiology, and End Results Program.
Funding: The present study was supported by resources of the University of Virginia Cancer Center Population Sciences Program.
The authors have no conflicts of interest to disclose.
References
- [1].Rao RD, Cobleigh MA. Adjuvant endocrine therapy for breast cancer. Oncology 2012;26:541–7. [PubMed] [Google Scholar]
- [2].Early Breast Cancer Trialists’ Collaborative Group. Relevance of breast cancer hormone receptors and other factors to the efficacy of adjuvant tamoxifen: patient-level meta-analysis of randomised trials. Lancet 2011;378:771–84. [DOI] [PMC free article] [PubMed] [Google Scholar]
- [3].Powles TJ, Ashley S, Tidy A, et al. Twenty-year follow-up of the Royal Marsden randomized, double-blinded tamoxifen breast cancer prevention trial. J Natl Cancer Inst 2007;99:283–90. [DOI] [PubMed] [Google Scholar]
- [4].Coombes RC, Hall E, Gibson LJ, et al. A randomized trial of exemestane after two to three years of tamoxifen therapy in postmenopausal women with primary breast cancer. N Engl J Med 2004;350:1081–92. [DOI] [PubMed] [Google Scholar]
- [5].Reeder-Hayes KE, Meyer AM, Dusetzina SB, et al. Racial disparities in initiation of adjuvant endocrine therapy of early breast cancer. Breast Cancer Res Treat 2014;145:743–51. [DOI] [PMC free article] [PubMed] [Google Scholar]
- [6].Lund MJ, Brawley OP, Ward KC, et al. Parity and disparity in first course treatment of invasive breast cancer. Breast Cancer Res Treat 2008;109:545–57. [DOI] [PubMed] [Google Scholar]
- [7].Livaudais JC, Hershman DL, Habel L, et al. Racial/ethnic differences in initiation of adjuvant hormonal therapy among women with hormone receptor-positive breast cancer. Breast Cancer Res Treat 2012;131:607–17. [DOI] [PMC free article] [PubMed] [Google Scholar]
- [8].Shavers VL, Brown ML. Racial and ethnic disparities in the receipt of cancer treatment. J Natl Cancer Inst 2002;94:334–57. [DOI] [PubMed] [Google Scholar]
- [9].Friese CR, Pini TM, Li Y, et al. Adjuvant endocrine therapy initiation and persistence in a diverse sample of patients with breast cancer. Breast Cancer Res Treat 2013;138:931–9. [DOI] [PMC free article] [PubMed] [Google Scholar]
- [10].Farias AJ, Du XL. Ethnic differences in initiation and timing of adjuvant endocrine therapy among older women with hormone receptor-positive breast cancer enrolled in Medicare Part D. Med Oncol 2016;33:1–4. [DOI] [PMC free article] [PubMed] [Google Scholar]
- [11].Felder TM, Do DP, Lu ZK, et al. Racial differences in receipt of adjuvant hormonal therapy among Medicaid enrollees in South Carolina diagnosed with breast cancer. Breast Cancer Res Treat 2016;157:193–200. [DOI] [PMC free article] [PubMed] [Google Scholar]
- [12].Hershman DL, Shao T, Kushi LH, et al. Early discontinuation and non-adherence to adjuvant hormonal therapy are associated with increased mortality in women with breast cancer. Breast Cancer Res Treat 2011;126:529–37. [DOI] [PMC free article] [PubMed] [Google Scholar]
- [13].Tan X, Marshall VD, Anderson RT, et al. Adjuvant therapy use among Appalachian breast cancer survivors. Medicine (Baltimore) 2015;94:e1071. [DOI] [PMC free article] [PubMed] [Google Scholar]
- [14].Shalowitz DI, Vinograd AM, Giuntoli RL., II Geographic access to gynecologic cancer care in the United States. Gynecol Oncol 2015;138:115–20. [DOI] [PubMed] [Google Scholar]
- [15].Chow CJ, Al-Refaie WB, Abraham A, et al. Does patient rurality predict quality colon cancer care?: a population-based study. Dis Colon Rectum 2015;58:415–22. [DOI] [PMC free article] [PubMed] [Google Scholar]
- [16].Leslie SR, Gwadry-Sridhar F, Thiebaud P, et al. Calculating medication compliance, adherence and persistence in administrative pharmacy claims databases. Pharm Progr 2008;1:13–9. [Google Scholar]
- [17].Ayres LR, Baldoni Ade O, Borges AP, et al. Adherence and discontinuation of oral hormonal therapy in patients with hormone receptor positive breast cancer. Int J Clin Pharm 2014;36:45–54. [DOI] [PubMed] [Google Scholar]
- [18].Fairman KA. Evaluating medication adherence: which measure is right for your program? J Manag Care Pharm 2000;6:499–506. [Google Scholar]
- [19].United States Department of Agriculture Economic Research Service. Rural-Urban Continuum Codes. 2013. Available at: http://www.ers.usda.gov/data-products/rural-urban-continuum-codes.aspx. Accessed October 20, 2016. [Google Scholar]
- [20].HIPxChange. Area Deprivation Index. 2016. Available at: https://www.hipxchange.org/ADI. Accessed October 20, 2016. [Google Scholar]
- [21].Singh GK. Area deprivation and widening inequalities in US mortality, 1969–1998. Am J Public Health 2003;93:1137–43. [DOI] [PMC free article] [PubMed] [Google Scholar]
- [22].Administration HRS. Primary Medical Care HPSA Designation Overview. 2016. Available at: http://bhpr.hrsa.gov/shortage/hpsas/designationcriteria/primarycarehpsaoverview.html. Accessed October 20, 2016. [Google Scholar]
- [23].National Cancer Institute. SEER-Medicare: Calculation of Comorbidity Weights. 2017. Available at: https://healthcaredelivery.cancer.gov/seermedicare/considerations/calculation.html. Accessed April 7, 2017. [Google Scholar]
- [24].Deyo RA, Cherkin DC, Ciol MA. Adapting a clinical comorbidity index for use with ICD-9-CM administrative databases. J Clin Epidemiol 1992;45:613–9. [DOI] [PubMed] [Google Scholar]
- [25].Klabunde CN, Potosky AL, Legler JM, et al. Development of a comorbidity index using physician claims data. J Clin Epidemiol 2000;53:1258–67. [DOI] [PubMed] [Google Scholar]
- [26].Schmidt CO, Kohlmann T. When to use the odds ratio or the relative risk? Int J Public Health 2008;53:165–7. [DOI] [PubMed] [Google Scholar]
- [27].Muller CJ, MacLehose RF. Estimating predicted probabilities from logistic regression: different methods correspond to different target populations. Int J Epidemiol 2014;43:962–70. [DOI] [PMC free article] [PubMed] [Google Scholar]
- [28].Centers for Disease Control and Prevention. Vital signs: racial disparities in breast cancer severity—United States, 2005–2009. MMWR Morb Mortal Wkly Rep 2012;61:922–6. [PubMed] [Google Scholar]
- [29].American Cancer Society. What Are the Risk Factors for Breast Cancer? 2016. Available at: http://www.cancer.org/cancer/breastcancer/detailedguide/breast-cancer-risk-factors. Accessed October 04, 2016. [Google Scholar]
- [30].Paskett ED, Tatum C, Rushing J, et al. Racial differences in knowledge, attitudes, and cancer screening practices among a triracial rural population. Cancer 2004;101:2650–9. [DOI] [PMC free article] [PubMed] [Google Scholar]
- [31].Freedman RA, He Y, Winer EP, et al. Trends in racial and age disparities in definitive local therapy of early-stage breast cancer. J Clin Oncol 2009;27:713–9. [DOI] [PubMed] [Google Scholar]
- [32].Wheeler SB, Reeder-Hayes KE, Carey LA. Disparities in breast cancer treatment and outcomes: biological, social, and health system determinants and opportunities for research. Oncologist 2013;18:986–93. [DOI] [PMC free article] [PubMed] [Google Scholar]
- [33].Wang X, Du XL. Socio-demographic and geographic variations in the utilization of hormone therapy in older women with breast cancer after Medicare Part-D coverage. Med Oncol 2015;32:154. [DOI] [PubMed] [Google Scholar]
- [34].Bhatta SS, Hou N, Moton ZN, et al. Factors associated with compliance to adjuvant hormone therapy in Black and White women with breast cancer. Springerplus 2013;2:356. [DOI] [PMC free article] [PubMed] [Google Scholar]
- [35].Roberts MC, Wheeler SB, Reeder-Hayes K. Racial/ethnic and socioeconomic disparities in endocrine therapy adherence in breast cancer: a systematic review. Am J Public Health 2015;105:e4–15. [DOI] [PMC free article] [PubMed] [Google Scholar]
- [36].Riley GF, Warren JL, Harlan LC, et al. Endocrine therapy use among elderly hormone receptor-positive breast cancer patients enrolled in Medicare Part D. Medicare Medicaid Res Rev 2011;1:E1–26. [DOI] [PMC free article] [PubMed] [Google Scholar]
- [37].Nekhlyudov L, Li L, Ross-Degnan D, et al. Five-year patterns of adjuvant hormonal therapy use, persistence, and adherence among insured women with early-stage breast cancer. Breast Cancer Res Treat 2011;130:681–9. [DOI] [PubMed] [Google Scholar]
- [38].Partridge AH, Wang PS, Winer EP, et al. Nonadherence to adjuvant tamoxifen therapy in women with primary breast cancer. J Clin Oncol 2003;21:602–6. [DOI] [PubMed] [Google Scholar]
- [39].Partridge AH, LaFountain A, Mayer E, et al. Adherence to initial adjuvant anastrozole therapy among women with early-stage breast cancer. J Clin Oncol 2008;26:556–62. [DOI] [PubMed] [Google Scholar]
- [40].Bender CM, Gentry AL, Brufsky AM, et al. Influence of patient and treatment factors on adherence to adjuvant endocrine therapy in breast cancer. Oncol Nurs Forum 2014;41:274–85. [DOI] [PMC free article] [PubMed] [Google Scholar]
- [41].Amstislavski P, Matthews A, Sheffield S, et al. Medication deserts: survey of neighborhood disparities in availability of prescription medications. Int J Health Geogr 2012;11:48. [DOI] [PMC free article] [PubMed] [Google Scholar]
- [42].Tan X, Camacho F, Marshall VD, et al. Geographic disparities in adherence to adjuvant endocrine therapy in Appalachian women with breast cancer. Res Social Adm Pharm 2016;13:796–810. [DOI] [PMC free article] [PubMed] [Google Scholar]
- [43].Osborn D, Hinkle L, Hanlon C, et al. Reducing racial and ethnic disparities through health care reform: state experience. 2011. Available at: http://www.nashp.org/sites/default/files/Disparities_and_HCR_IB.pdf. Accessed June 1, 2017. [Google Scholar]


