

Abstract
Background:
Acute myocardial infarction (AMI) is one of the leading causes of mortality and morbidity worldwide. Recently, several studies have revealed the diagnostic value of circulating microRNAs (miRNAs) for AMI detection. However, the diagnostic capacity of miRNAs for AMI is still controversial due to the inconsistent results among studies.
Methods:
A systematic literature search was conducted to retrieve relevant articles in PubMed and other databases up to February 2017. The pooled sensitivity, specificity, positive likelihood ratio (PLR), negative likelihood ratio (NLR), diagnostic odds ratio (DOR), and area under the curve (AUC) were used to assess the overall test performance of miRNAs. Subgroup analysis was conducted to explore the potential sources of heterogeneity. We evaluated the publication bias by the Deeks’ funnel plot asymmetry test and all statistical analyses were performed using Meta-disc 1.4 and Stata software.
Results:
A total of 26 articles comprising 1973 AMI patients and 1236 healthy controls were included in this meta-analysis. The overall pooled diagnostic data was as follows: the pooled sensitivity of 0.76 (95% confidence interval [CI]: 0.75–0.78), the pooled specificity of 0.82 (95% CI: 0.81–0.84), the pooled PLR of 4.68 (95% CI: 3.92–5.59), the pooled NLR of 0.28 (95% CI: 0.25–0.32), and the pooled DOR of 18.66 (95% CI: 14.11–24.68). The AUC value was 0.8661 in the overall summary receiver operator characteristic curve. Subgroup analysis indicated that miRNA-499 had better diagnostic accuracy over other miRNAs.
Conclusion:
MiRNAs may serve as promising diagnostic biomarkers in the early diagnosis of AMI. Further studies were needed to evaluate the diagnostic value of miRNAs for AMI before clinical application.
Keywords: acute myocardial infarction, diagnosis, meta-analysis, miRNAs
1. Introduction
Acute myocardial infarction (AMI), which includes ST-elevation myocardial infarction (STEMI) and non-STEMI (NSTEMI), is one of the leading causes of morbidity and mortality worldwide. A rapid diagnosis of AMI is essential for proper management of patients with clinical symptoms. Within 3 hours after the onset of chest pain, a timely revascularization treatment is recommended to repair the ischemic myocardium, which would ultimately reduce the mortality and improve prognosis of AMI.[1] Thus, an early and accurate diagnosis of AMI is warranted.
To date, clinical symptoms, electrocardiogram (ECG), and specific cardiac biomarkers are the main methods for the clinical diagnosis of AMI. In clinical practice, biomarkers, preferably troponin (cTn) I and T, are very critical in the diagnosis of AMI as patients with NSTEMI cannot be diagnosed on the basis of clinical symptoms and ECG alone. The cTn is considered the “gold standard” for the early diagnosis of AMI. Yet, the level of cTn not only increases in some cases of ischemic heart injury, but also in other serious diseases, such as heart failure, chronic kidney disease, neuromuscular disorders, severe sepsis, and septic shock.[2–4] Another weakness of cTn is its time restrain, because cTn can only be detected 3 to 6 hours after the onset of clinical symptoms of cardiac ischemia.[5] Therefore, in order to improve the determination of AMI, it is urgent to seek novel potential biomarkers for early diagnosis of AMI.
In recent years, the discovery of microRNAs (miRNAs) has provided a new method for the diagnosis of cardiovascular diseases. Since miRNAs were discovered in the 1990s, more than 2000 human miRNAs have been cloned and sequenced. Circulating miRNAs are short, endogenous, and noncoding ribonucleic Acids (19–25 nucleotides) that regulate genes expression posttranscriptionally.[6] MiRNAs have been shown to participate in various physiological and pathological processes, such as cell death, stress response, metabolism, cell differentiation, and proliferation.[6–8] And they have been demonstrated to be stable in the extracellular fluid and recommended as biomarkers for various diseases. Compared to cTn, miRNAs could be detected in the circulation at an earlier time point after AMI, appearing to be highly promising biomarkers for early diagnosis of AMI.[9] Several studies have reported the diagnostic value of miRNAs in AMI patients. However, the results among studies were inconsistent, which may be caused by specimen types, region, age, sample size, sampling time, severity of AMI, and so on. Considering the different regions may affect the results and most of the studies about miRNAs for AMI diagnosis were carried out in Asian populations up to now, the aim of this study is to summarize the existed insights into the potential use of miRNAs as biomarkers in AMI detection among Asian populations and evaluate the specificity and sensitivity of miRNAs so as to assess the feasibility of diagnosing AMI.
2. Methods
2.1. Publication search
A systematic literature search was conducted to obtain relevant studies for this meta-analysis. We searched the following databases for studies published up to February 2017 without language restriction: PubMed, Cochrane Library, Medline, Embase, CNKI, and Wanfang. The search keywords were “acute myocardial infarction,” “AMI,” “acute coronary syndrome,” “ACS” or “heart infarction” combined with “microRNA,” or “miRNA”. Meanwhile, we searched the reference lists in order to avoid omitting relevant studies that had not been obtained from the databases. As this is a systematic review and meta-analysis, the ethical approval and patient written informed consent are not required.
2.2. Inclusion and exclusion criteria
All eligible studies in this meta-analysis were required to satisfy the following criteria: researches were related with miRNAs and AMI; studies were human and case–control studies; studies contained sufficient data to assess the diagnosis value of miRNAs in AMI detection. Exclusion criteria were based on the following: studies without usable or sufficient data; case reports, reviews, letters, editorials, and conference abstracts.
2.3. Data extraction and quality assessment
Two reviewers independently extracted data and information from the eligible studies, including first author, the year of publication, the country of origin, the number of cases and controls, AMI definition, time of blood sampling for diagnosis, and data needed for meta-analysis (sensitivity, specificity, true positives, false positives, true negatives, and false negatives). The quality of eligible studies was assessed by the Quality Assessment of Diagnostic Accuracy Studies-2 (QUADAS-2) score system, which has been demonstrated to be an effective tool for evaluating the quality of diagnostic accuracy studies.[10] The QUADAS-2 tool, including 4 key domains (patient selection, the index test, the reference standard, and flow and timing), evaluates risk of bias and concerns about applicability as “yes (low risk/high concern),” “no (high risk/low concern),” or “unclear (unclear risk/unclear concern)” with a maximum score of 7.
2.4. Statistical analysis
All statistical analyses were performed using Meta-disc 1.4 (XI Cochrane Colloquium, Barcelona, Spain) and Stata (12.0 Stata Corp, College Station, TX) software. We calculated the pooled sensitivity, specificity, positive likelihood ratio (PLR), negative likelihood ratio (NLR), diagnostic odds ratio (DOR), generated the bivariate summary receiver operator characteristic (SROC) curve, and calculated the area under the curve (AUC) to assess the overall diagnostic accuracy of miRNAs in distinguishing AMI patients from controls. In this meta-analysis, Spearman correlation coefficient was used to assess the heterogeneity caused by threshold effect. If P value of Spearman correlation coefficient was less than .05, it indicated the existence of heterogeneity from threshold effect. In addition, chi-square and I2 test were performed to analyze the heterogeneity from nonthreshold effect. If P < .1 or I2 > 50%, it indicated that heterogeneity existed from nonthreshold effect and a random effects model would be used, otherwise a fixed effects model would be applied (P > .1 or I2 < 50%). Subgroup analysis was performed to explore the potential source of heterogeneity. In addition, we evaluated the publication bias of the selected studies using the Deeks’ funnel plot asymmetry test.
3. Results
3.1. Data selection and study characteristics
In the initial search, totally 408 articles were retrieved from databases and other sources, of which 292 duplicates were excluded. After reading the titles and abstracts, 55 were removed, including 18 reviews or letters and 37 irrelevant articles. After carefully reviewing full texts, 35 were excluded from analysis due to the lack of sufficient data. Eventually, 26 eligible publications were included in our meta-analysis. The flow diagram of the selected studies is summarized in Fig. 1.
Figure 1.
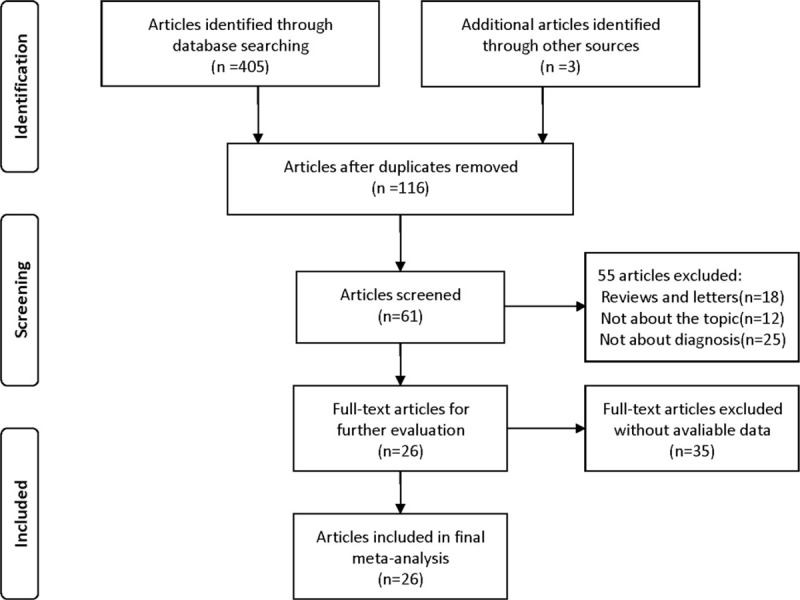
Flowchart of the selection process of studies included in this meta-analysis.
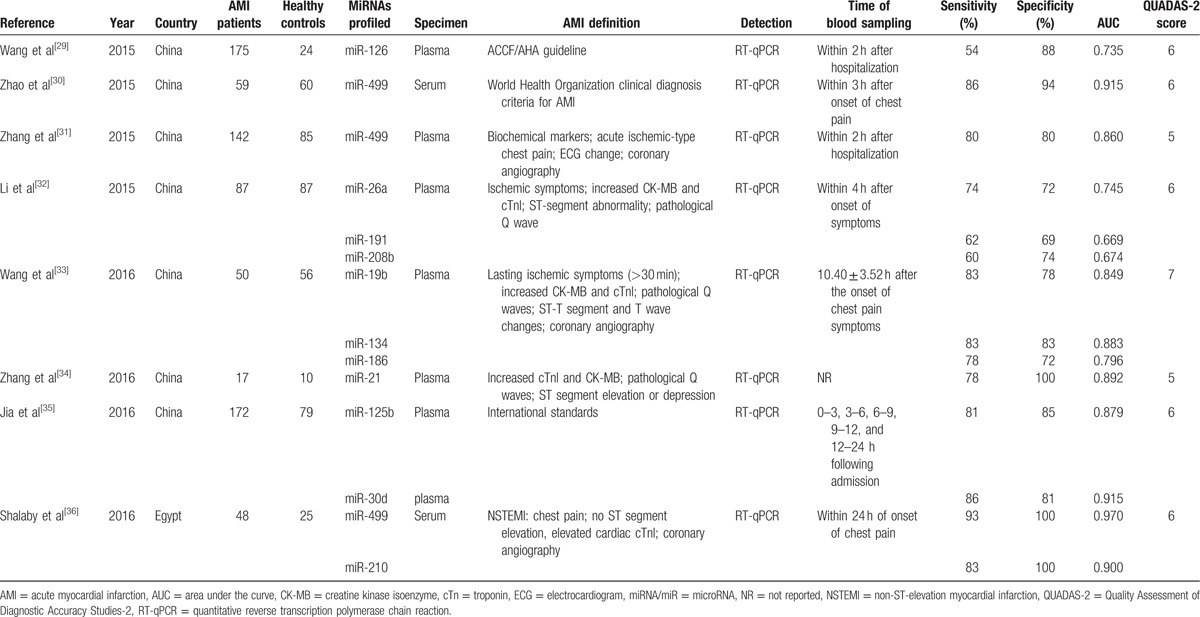
The characteristics of the studies included in our meta-analysis were shown in Table 1 . The 26 articles comprised 1973 AMI patients and 1236 healthy controls. Among the included studies, 10 focused on miRNA-499,[11,13,18–20,22,26,30,31,36] 9 on miRNA-1,[12–14,16,19–22,26] 5 on miRNA-133,[14,15,20,22,23] 3 on miRNA-208a,[13,19,26] 3 on miRNA-208b,[20,22,32] 3 on miRNA-134,[19,24,33] and 20 on other 17 types of miRNAs. A total of 23 types of miRNAs were involved. A total of 5 studies used serum samples, whereas the rest used plasma. Quantitative reverse transcription polymerase chain reaction was used to detect the expression levels of miRNAs in all studies. The quality of included studies was assessed by QUADAS-2 and most studies had moderately high scores. The risk of bias and applicability concerns graph for included studies were presented in Fig. 2.
Table 1.
Characteristics of the 26 studies included in our meta-analysis.
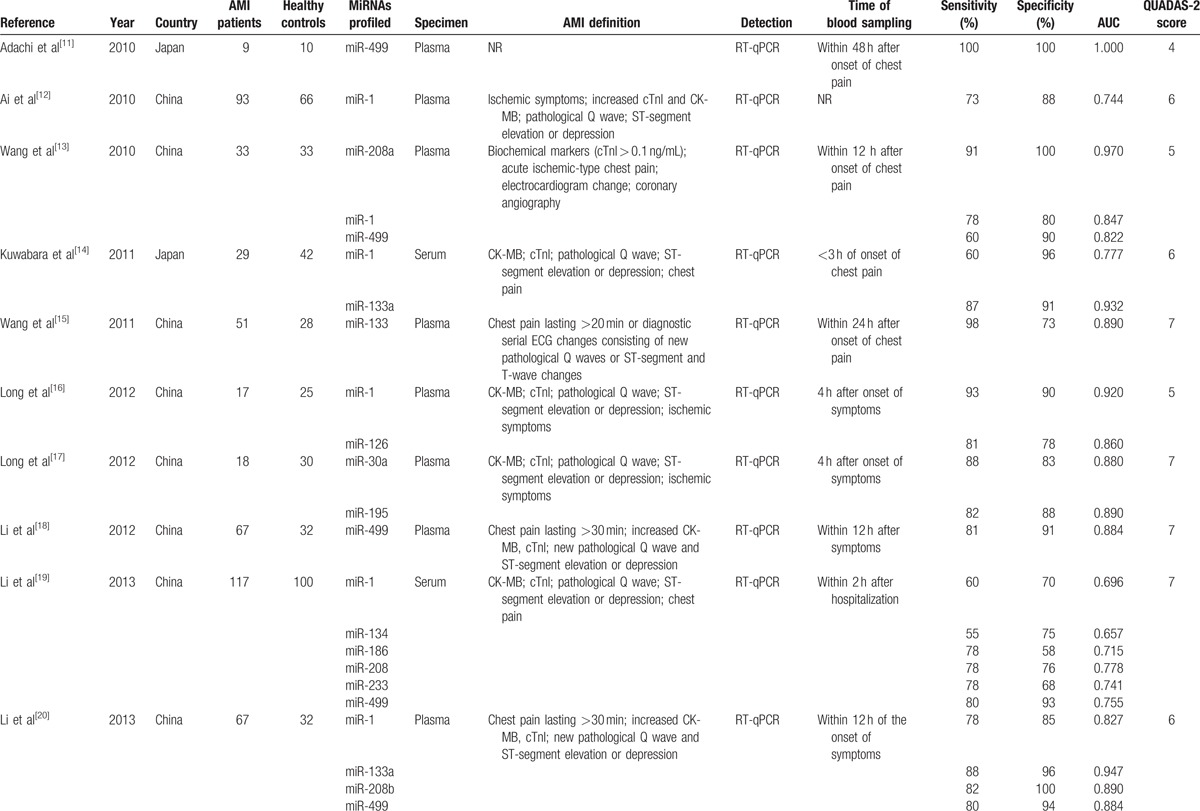
Figure 2.
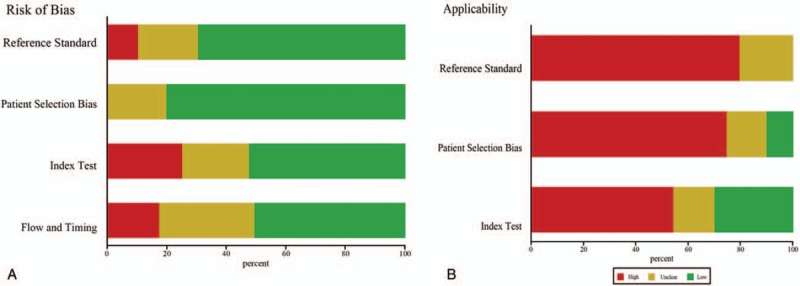
Bar graphs of the quality assessment of studies included using the Quality Assessment of Diagnostic Accuracy Studies 2 score system. (A) Risk of bias. (B) Applicability.
Table 1 (Continued).
Characteristics of the 26 studies included in our meta-analysis.
3.2. Pooled diagnostic accuracy of miRNAs in AMI
The pooled diagnostic accuracy of miRNAs in AMI diagnosis was conducted. The P value of Spearman correlation coefficient in the pooled analysis was less than 0.05. I2 value was 77.9% for sensitivity and 77.3% for specificity, and P values of chi-square test were all less than 0.1, which suggested significant heterogeneity between studies. Thus, a random-effects model was applied to calculate the pooled diagnostic parameters for this study.
Forest plots of the sensitivity, specificity, DOR, and SROC curve with AUC for miRNAs in AMI detection in this meta-analysis were plotted. The overall pooled diagnostic data were as follows: the pooled sensitivity (Fig. 3A) of 0.76 (95% confidence interval [CI]: 0.75–0.78), the pooled specificity (Fig. 3B) of 0.82 (95% CI: 0.81–0.84), the pooled PLR of 4.68 (95% CI: 3.92–5.59), the pooled NLR of 0.28 (95% CI: 0.25–0.32), and the pooled DOR (Fig. 3C) of 18.66 (95% CI: 14.11–24.68). The corresponding SROC curve was shown in Fig. 3D and the AUC value was 0.8661 in the overall SROC curve, which suggested a relatively high accuracy for diagnosing AMI based on miRNAs assays. In addition, the Deeks’ test (Fig. 3E) was performed for DOR to evaluate the potential of publication bias in this meta-analysis. The P value was 0.07 for Deeks’ test on publications of multiple miRNAs, which suggested a low possibility of publication bias.
Figure 3.
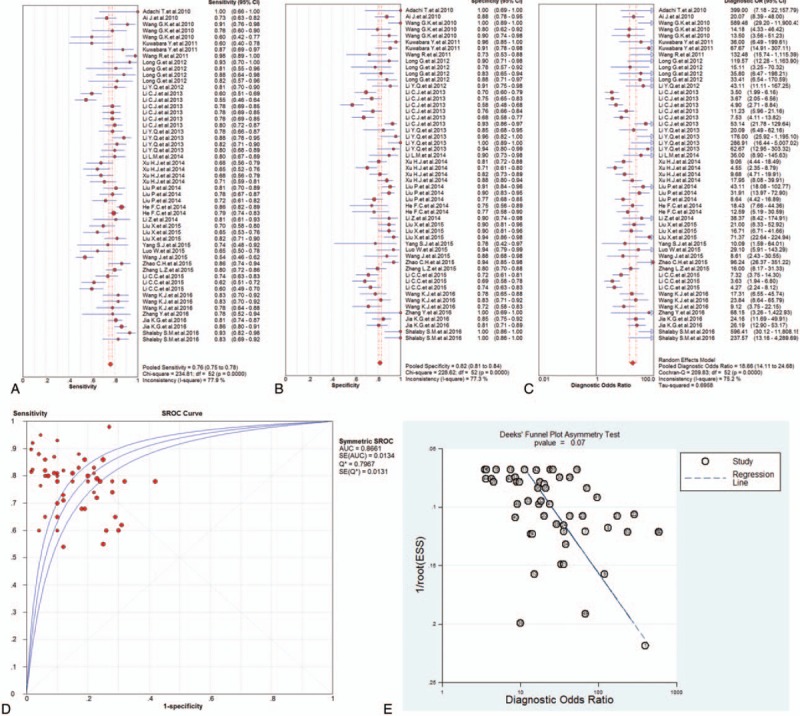
The sensitivity, specificity, diagnostic odds ratio (DOR), summary receiver operator characteristic (SROC) curve with area under the curve (AUC), and funnel graph of the total microRNAs in the diagnosis of acute myocardial infarction. (A) Sensitivity. (B) Specificity. (C) DOR. (D) SROC curve with AUC. (E) Funnel graph. AMI = acute myocardial infarction, AUC = area under the curve, DOR = diagnostic odds ratio, SROC = summary receiver operator characteristic.
3.3. Subgroup analysis
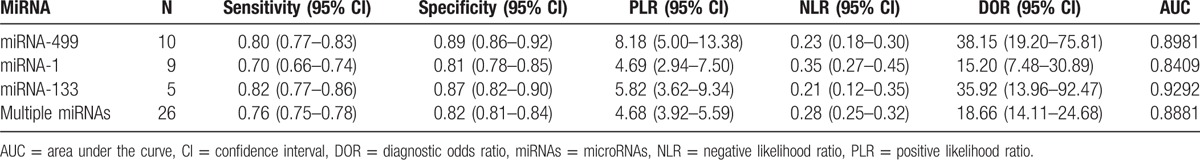
In order to explore the potential sources of heterogeneity, we conducted subgroup analysis based on miRNA profiling. The comparison of diagnostic value of miRNAs was shown in Table 2.
Table 1 (Continued).
Characteristics of the 26 studies included in our meta-analysis.
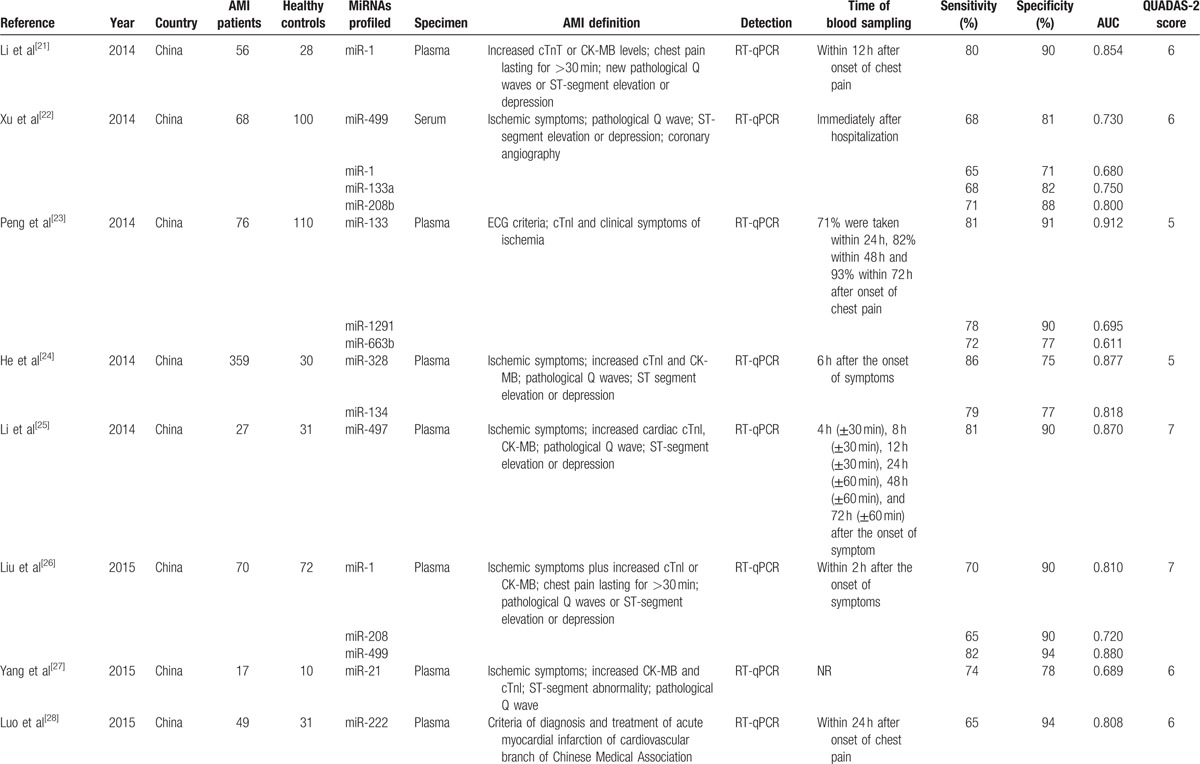
Table 2.
Comparison of diagnostic value of miRNAs.
3.3.1. miRNA-499
Ten studies discussed the diagnostic value of miRNA-499 in AMI detection, and forest plots of the sensitivity, specificity, DOR, and SROC curve with AUC for miRNA-499 in the diagnosis of AMI in this meta-analysis were plotted. Due to the heterogeneity (all I2 > 50%), a random effects model was used for the meta-analysis. The pooled sensitivity (Fig. 4A), specificity (Fig. 4B), and DOR (Fig. 4C) with their 95% CI and the AUC value (Fig. 4D) of miRNA-499 in the 10 studies were 0.80 (95% CI: 0.77–0.83; P = .0037), 0.89 (95% CI: 0.86–0.92; P = .0018), 38.15 (95% CI: 19.20–75.81; P = .0007), and 0.8961, respectively. In addition, the Deeks’ test (Fig. 4E) was performed to evaluate publication bias of miRNA-499, which suggested a low possible publication bias.
Figure 4.
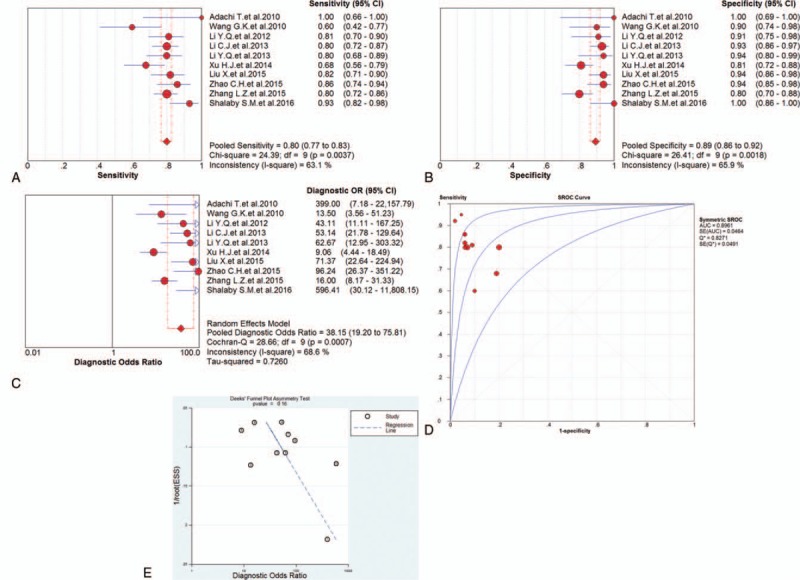
The sensitivity, specificity, diagnostic odds ratio (DOR), summary receiver operator characteristic (SROC) curve with area under the curve (AUC), and funnel graph of microRNA-499 in the diagnosis of acute myocardial infarction. (A) Sensitivity. (B) Specificity. (C) DOR. (D) SROC curve with AUC. (E) Funnel graph. AMI = acute myocardial infarction, AUC = area under the curve, DOR = diagnostic odds ratio, SROC = summary receiver operator characteristic.
3.3.2. miRNA-1
Nine studies focused on the diagnostic value of miRNA-1 for AMI. Forest plots of the sensitivity, specificity, DOR, and SROC curve with AUC for miRNA-1 in the diagnosis of AMI in this meta-analysis were plotted. Due to the heterogeneity (all I2 > 50%), a random effects model was applied for the meta-analysis. The pooled sensitivity (Fig. 5A), specificity (Fig. 5B), and DOR (Fig. 5C) with their 95% CI and the AUC value (Fig. 5D) of the miRNA-1 in the 9 studies were 0.70 (95% CI: 0.66–0.74; P = .0130), 0.81 (95% CI: 0.78–0.85; P = .0001), 15.20 (95% CI: 7.48–30.89; P = .0000), and 0.8409, respectively. In addition, the Deeks’ test (Fig. 5E) was performed to evaluate publication bias of miRNA-1, which suggested a low possible publication bias.
Figure 5.
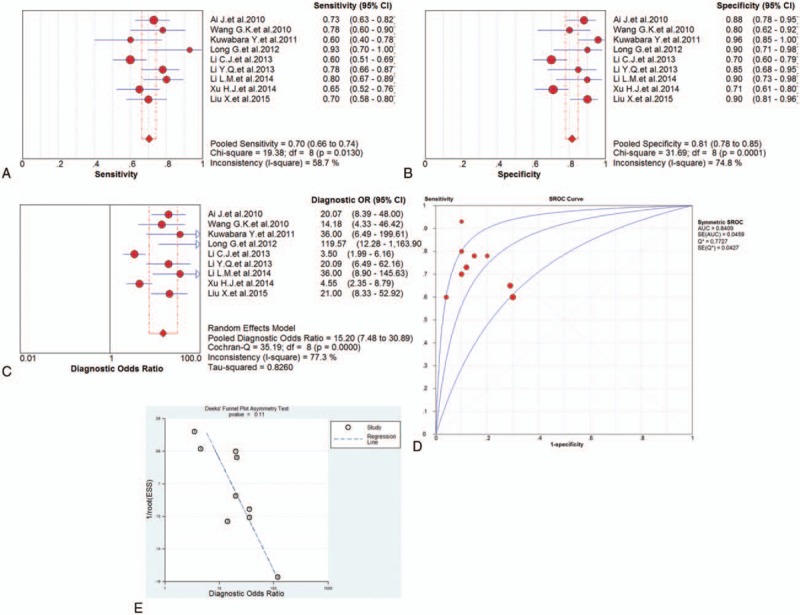
The sensitivity, specificity, diagnostic odds ratio (DOR), summary receiver operator characteristic (SROC) curve with area under the curve (AUC), and funnel graph of the microRNA-1 in the diagnosis of acute myocardial infarction. (A) Sensitivity. (B) Specificity. (C) DOR. (D) SROC curve with AUC. (E) Funnel graph. AMI = acute myocardial infarction, AUC = area under the curve, DOR = diagnostic odds ratio, SROC = summary receiver operator characteristic.
3.3.3. miRNA-133
Five studies investigated the diagnostic value of miRNA-133 for AMI and forest plots of the sensitivity, specificity, DOR, and SROC curve with AUC for miRNA-133 in the diagnosis of AMI in this meta-analysis were plotted. Due to the heterogeneity (all I2 > 50%), a random effects model was applied for the meta-analysis. The pooled sensitivity (Fig. 6A), specificity (Fig. 6B), and DOR (Fig. 6C) with their 95% CI and the AUC value (Fig. 6D) of miRNA-133 in the 5 studies were 0.82 (95% CI: 0.77–0.86; P = .0002), 0.87 (95% CI: 0.82–0.90; P = .0692), 35.92 (95% CI: 13.96–92.47; P = .0121), and 0.9292, respectively. In addition, the Deeks’ test (Fig. 6E) was performed to evaluate publication bias of miRNA-133, which suggested a low possible publication bias.
Figure 6.
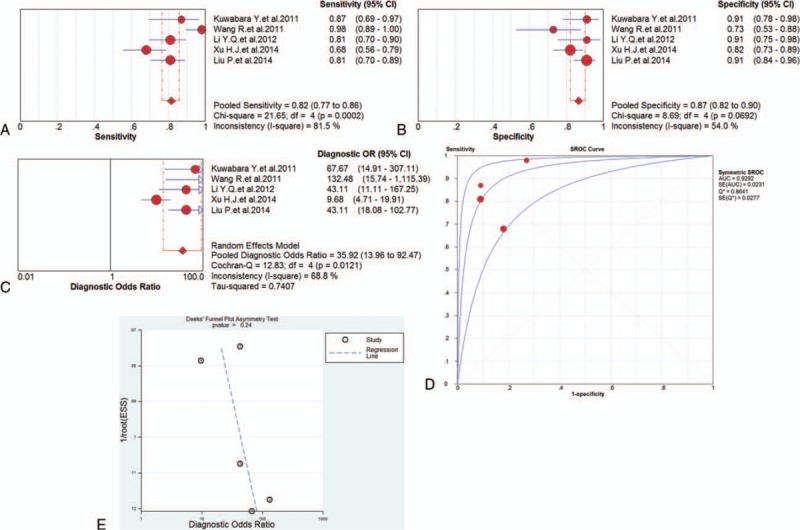
The sensitivity, specificity, diagnostic odds ratio (DOR), summary receiver operator characteristic (SROC) curve with area under the curve (AUC), and funnel graph of the microRNA-133 in the diagnosis of acute myocardial infarction. (A) Sensitivity. (B) Specificity. (C) DOR. (D) SROC curve with AUC. (E) Funnel graph. AMI = acute myocardial infarction, AUC = area under the curve, DOR = diagnostic odds ratio, SROC = summary receiver operator characteristic.
4. Discussion
In this meta-analysis, we evaluated the diagnostic value of miRNAs as biomarkers of AMI. The results described above showed that miRNAs are promising biomarkers for the diagnosis of AMI with good accuracy. In addition, we conducted subgroup analysis based on miRNA profiling in order to reduce the effects from heterogeneity. Three miRNAs that had been studied most frequently were chosen for subgroup analysis: miRNA-499, miRNA-1, and miRNA-133. The comparison of diagnostic value between each single miRNA and multiple miRNAs showed that miRNA-499 had better diagnostic accuracy over other miRNAs.
AMI is a common clinical cardiovascular disease. Early detection, diagnosis, and treatment are significant for the prognosis of AMI patients. There are plenty of biomarkers available for clinical diagnosis of AMI, including creatine kinase, creatine kinase isoenzyme, cTn, and myoglobin. The cTn is recognized as the most reliable biomarker, but it cannot rule in or rule out AMI at an early stage. Therefore, it is necessary to seek more sensitive and specific novel biomarkers for the diagnosis of AMI.
Preferably, a biomarker in the AMI detection should meet the following characteristics: First, the biomarkers should be easily accessible by the minimally invasive and painful methods, such as blood and urine. Second, it should be specifically present and abundantly expressed in the heart, which makes it specific to the disease. Third, its expression level in the circulatory system should be very low or undetectable under normal conditions and the expression level of biomarkers should closely correlate with the severity of AMI. Finally, if the AMI occurs, the biomarker should release from the damaged heart to the blood circulation in a very short time and has a relative long half-life in order to facilitate detection. Currently, miRNAs have been studied as a promising scientific tool for the early detection of AMI, which satisfy all the above characteristics. Some miRNAs are specific to heart or muscle tissue and considered to be the best candidates for the diagnosis of AMI. It has been demonstrated that circulating miRNAs can resist freeze–thaw cycles, boiling, high and low potential of hydrogen, and they can still remain stable in the extracellular fluid despite the presence of ribonucleases.[37] When necrosis occurs during AMI, cTn releases into the serum. However, the release of miRNAs can be affected by any form of cellular stress, such as hypoxia, lactic acidosis, or cell edema, which occurs earlier than necrosis in AMI. In summary, miRNAs may be potential biomarkers for the detection of AMI at an earlier time compared with cTn.
After our subgroup analysis, the most significant correlation was found between miRNA-499 and AMI. MiRNA-499 not only has high sensitivity and specificity, but also shows superiority in other aspects. MiRNA-499 is a member of the miRNAs family encoded by myosin gene and located in an intron of the Myh7b gene discovered recently. It has been demonstrated to be specially expressed in myocardium and skeletal muscle in mammals.[38] In addition, miRNA-499 has been studied that it can induce structural and functional differentiation of cardiac stem cells into cardiomyocytes, thereby promoting the recovery of cardiac function after injury.[39] Several studies have demonstrated that miRNA-499 and cTn have certain correlation, indicating that miRNA-499 can be used as a diagnostic biomarker for AMI. Studies also have shown that the level of miRNA-499 could be detected within a few hours of the onset of AMI symptoms and the peak fold change reached 3 × 10⁵, which made detection of miRNA-499 relatively easy.[40] Therefore, evaluating the level of miRNA-499 would be helpful in the early diagnosis of AMI.
Despite this meta-analysis had an encouraging result of miRNAs for AMI detection, there were still some limitations that needed to be considered before making a clinical conclusion. First, most of the sample size is limited, so the clinical application of miRNAs for AMI detection still needs long-term and follow-up studies for further validation. Second, some studies may be missed during the selection process and some were excluded due to insufficient data. And the diagnostic superiority of miRNAs assessment was unclear due to the missing data of posterior probability analyses. So, more researches and analyses are needed. Third, the methods used in the study lack uniform standard, which certainly would affect the results.
5. Conclusion
The current meta-analysis suggested that miRNAs hold great potential in the early diagnosis of AMI in Asian populations. However, the clinical application of miRNAs for AMI early detection still needs large-scale studies for further validation. Due to the different diagnostic values of miRNAs, the combination of 2 or 3 miRNAs may be a better way to diagnose AMI more accurately. It is essential to explore the most effective combination of multiple miRNAs to improve the diagnostic accuracy.
Footnotes
Abbreviations: AMI = acute myocardial infarction, AUC = area under the curve, CI = confidence interval, cTn = troponin, DOR = diagnostic odds ratio, ECG = electrocardiogram, miRNA = microRNA, NLR = negative likelihood ratio, NSTEMI = non-ST elevated myocardial infarction, PLR = positive likelihood ratio, QUADAS-2 = Quality Assessment of Diagnostic Accuracy Studies-2, SROC = summary receiver operator characteristic, STEMI = ST-elevation myocardial infarction.
Funding/support: The present study was supported by grants from the Key Project of the Scientific and Technological Department of Henan (nos.152102410067 and 162102310142).
The authors have no conflicts of interest to disclose.
References
- [1].Shibata T, Kawakami S, Noguchi T, et al. Prevalence, clinical features, and prognosis of acute myocardial infarction attributable to coronary artery embolism. Circulation 2015;132:241–50. [DOI] [PubMed] [Google Scholar]
- [2].Abbas NA, John RI, Webb MC, et al. Cardiac troponins and renal function in nondialysis patients with chronic kidney disease. Clin Chem 2005;51:2059–66. [DOI] [PubMed] [Google Scholar]
- [3].Finsterer J, Stollberger C, Krugluger W. Cardiac and noncardiac, particularly neuromuscular, disease with troponin-T positivity. Neth J Med 2007;65:289–95. [PubMed] [Google Scholar]
- [4].Rosjo H, Varpula M, Hagve TA, et al. Circulating high sensitivity troponin T in severe sepsis and septic shock: distribution, associated factors, and relation to outcome. Intensive Care Med 2011;37:77–85. [DOI] [PMC free article] [PubMed] [Google Scholar]
- [5].Agewall S, Giannitsis E, Jernberg T, et al. Troponin elevation in coronary vs. non-coronary disease. Eur Heart J 2011;32:404–11. [DOI] [PubMed] [Google Scholar]
- [6].Bartel DP. MicroRNAs: genomics, biogenesis, mechanism, and function. Cell 2004;116:281–97. [DOI] [PubMed] [Google Scholar]
- [7].Ambros V. The functions of animal microRNAs. Nature 2004;431:350–5. [DOI] [PubMed] [Google Scholar]
- [8].Plasterk RH. Micro RNAs in animal development. Cell 2006;124:877–81. [DOI] [PubMed] [Google Scholar]
- [9].Freund Y, Chenevier-Gobeaux C, Bonnet P, et al. High-sensitivity versus conventional troponin in the emergency department for the diagnosis of acute myocardial infarction. Crit Care 2011;15:R147. [DOI] [PMC free article] [PubMed] [Google Scholar]
- [10].Whiting PF, Rutjes AW, Westwood ME, et al. QUADAS-2: a revised tool for the quality assessment of diagnostic accuracy studies. Ann Intern Med 2011;155:529–36. [DOI] [PubMed] [Google Scholar]
- [11].Adachi T, Nakanishi M, Otsuka Y, et al. Plasma microRNA 499 as a biomarker of acute myocardial infarction. Clin Chem 2010;56:1183–5. [DOI] [PubMed] [Google Scholar]
- [12].Ai J, Zhang R, Li Y, et al. Circulating microRNA-1 as a potential novel biomarker for acute myocardial infarction. Biochem Biophys Res Commun 2010;391:73–7. [DOI] [PubMed] [Google Scholar]
- [13].Wang GK, Zhu JQ, Zhang JT, et al. Circulating microRNA: a novel potential biomarker for early diagnosis of acute myocardial infarction in humans. Eur Heart J 2010;31:659–66. [DOI] [PubMed] [Google Scholar]
- [14].Kuwabara Y, Ono K, Horie T, et al. Increased microRNA-1 and microRNA-133a levels in serum of patients with cardiovascular disease indicate myocardial damage. Circ Cardiovasc Genet 2011;4:446–54. [DOI] [PubMed] [Google Scholar]
- [15].Wang R, Li N, Zhang Y, et al. Circulating microRNAs are promising novel biomarkers of acute myocardial infarction. Intern Med 2011;50:1789–95. [DOI] [PubMed] [Google Scholar]
- [16].Long G, Wang F, Duan Q, et al. Human circulating microRNA-1 and microRNA-126 as potential novel indicators for acute myocardial infarction. Int J Biol Sci 2012;8:811–8. [DOI] [PMC free article] [PubMed] [Google Scholar]
- [17].Long G, Wang F, Duan Q, et al. Circulating miR-30a, miR-195 and let-7b associated with acute myocardial infarction. PLoS One 2012;7:e50926. [DOI] [PMC free article] [PubMed] [Google Scholar]
- [18].Li YQ, Li X, Hu CL, et al. Comparing diagnostic values of circulating microRNA-499 and cardiac troponin T in patients with acute myocardial infarction. J Sun Yat-Sen Univ (med sci) 2012;33:787–91. [Google Scholar]
- [19].Li C, Fang Z, Jiang T, et al. Serum microRNAs profile from genome-wide serves as a fingerprint for diagnosis of acute myocardial infarction and angina pectoris. BMC Med Genomics 2013;6:16. [DOI] [PMC free article] [PubMed] [Google Scholar]
- [20].Li YQ, Zhang MF, Wen HY, et al. Comparing the diagnostic values of circulating microRNAs and cardiac troponin T in patients with acute myocardial infarction. Clinics 2013;68:75–80. [DOI] [PMC free article] [PubMed] [Google Scholar]
- [21].Li LM, Cai WB, Ye Q, et al. Comparison of plasma microRNA-1 and cardiac troponin T in early diagnosis of patients with acute myocardial infarction. World J Emerg Med 2014;5:182–6. [DOI] [PMC free article] [PubMed] [Google Scholar]
- [22].Xu HJ, Gu M, Yu ZL, et al. Circulating miRNA detection in the diagnosis of acute coronary syndrome. J Jiangsu Univ 2014;24:59–62. [Google Scholar]
- [23].Peng L, Chun-guang Q, Bei-fang L, et al. Clinical impact of circulating miR-133, miR-1291 and miR-663b in plasma of patients with acute myocardial infarction. Diagn Pathol 2014;9:89. [DOI] [PMC free article] [PubMed] [Google Scholar]
- [24].He F, Lv P, Zhao X, et al. Predictive value of circulating miR-328 and miR-134 for acute myocardial infarction. Mol Cell Biochem 2014;394:137–44. [DOI] [PubMed] [Google Scholar]
- [25].Li Z, Lu J, Luo Y, et al. High association between human circulating microRNA-497 and acute myocardial infarction. ScientificWorldJournal 2014;2014:931845. [DOI] [PMC free article] [PubMed] [Google Scholar]
- [26].Liu X, Fan Z, Zhao T, et al. Plasma miR-1, miR-208, miR-499 as potential predictive biomarkers for acute myocardial infarction: an independent study of Han population. Exp Gerontol 2015;72:230–8. [DOI] [PubMed] [Google Scholar]
- [27].Yang SJ, Zhang Y, Liu Y. Research on expression of miRNA-21 in the peripheral blood of coronary heart disease and its clinical significance. Chin J Appl Physiol 2015;31:127–31. [PubMed] [Google Scholar]
- [28].Luo W, Xiong H, Han L, et al. Association of plasma miR-222 expression level with acute myocardial infarction. Chin J Lab Diagn 2015;19:1664–6. [Google Scholar]
- [29].Wang J, Han X, Jia K, et al. Circulating microRNA-126: a potential role in diagnosis and prognosis of acute myocardial infarction. Chin J Clin 2015;9:409–14. [Google Scholar]
- [30].Zhao CH, Cheng GC, He RL, et al. Analysis and clinical significance of microRNA-499 expression levels in serum of patients with acute myocardial infarction. Genet Mol Res 2015;14:4027–34. [DOI] [PubMed] [Google Scholar]
- [31].Zhang LZ, Chen X, Ye XH, et al. Relativity between plasma miR-499 and the early diagnosis in acute myocardial infarction. J Clin Care 2015;31:395–8. [Google Scholar]
- [32].Li C, Chen X, Huang J, et al. Clinical impact of circulating miR-26a, miR-191, and miR-208b in plasma of patients with acute myocardial infarction. Eur J Med Res 2015;20:58. [DOI] [PMC free article] [PubMed] [Google Scholar]
- [33].Wang KJ, Zhao X, Liu YZ, et al. Circulating MiR-19b-3p, MiR-134-5p and MiR-186-5p are promising novel biomarkers for early diagnosis of acute myocardial infarction. Cell Physiol Biochem 2016;38:1015–29. [DOI] [PubMed] [Google Scholar]
- [34].Zhang Y, Liu YJ, Liu T, et al. Plasma microRNA-21 is a potential diagnostic biomarker of acute myocardial infarction. Eur Rev Med Pharmacol Sci 2016;20:323–9. [PubMed] [Google Scholar]
- [35].Jia K, Shi P, Han X, et al. Diagnostic value of miR-30d-5p and miR-125b-5p in acute myocardial infarction. Mol Med Rep 2016;14:184–94. [DOI] [PMC free article] [PubMed] [Google Scholar]
- [36].Shalaby SM, El-Shal AS, Shoukry A, et al. Serum miRNA-499 and miRNA-210: a potential role in early diagnosis of acute coronary syndrome. IUBMB Life 2016;68:673–82. [DOI] [PubMed] [Google Scholar]
- [37].Mitchell PS, Parkin RK, Kroh EM, et al. Circulating microRNAs as stable blood-based markers for cancer detection. Proc Natl Acad Sci U S A 2008;105:10513–8. [DOI] [PMC free article] [PubMed] [Google Scholar]
- [38].Rossi AC, Mammucari C, Argentini C, et al. Two novel/ancient myosins in mammalian skeletal muscles: MYH14/7b and MYH15 are expressed in extraocular muscles and muscle spindles. J Physiol 2010;588:353–64. [DOI] [PMC free article] [PubMed] [Google Scholar]
- [39].Hosoda T, Zheng H, Cabral-da-Silva M, et al. Human cardiac stem cell differentiation is regulated by a mircrine mechanism. Circulation 2011;123:1287–96. [DOI] [PMC free article] [PubMed] [Google Scholar] [Retracted]
- [40].Devaux Y, Vausort M, Goretti E, et al. Use of circulating microRNAs to diagnose acute myocardial infarction. Clin Chem 2012;58:559–67. [DOI] [PubMed] [Google Scholar]