Supplemental Digital Content is available in the text
Keywords: erythrocyte membrane phospholipid, fatty acid composition, gastrointestinal tumor, octadeca-carbon fatty acids, platelet membrane phospholipid
Abstract
Fatty acid (FA) composition is closely associated with tumorigenesis and neoplasm metastasis. This study was designed to investigate the differences of phospholipid FA (PLFA) composition in erythrocyte and platelet cell membranes in both gastrointestinal (GI) tumor patients and healthy controls.
In this prospective study, 50 GI tumor patients and 33 healthy volunteers were recruited between the years 2013 and 2015. Blood samples were collected from healthy volunteers and patients, and FA composition was assessed using gas chromatography-mass spectrometer (GC-MS), and data were analyzed by multifactor regression analysis.
Compared with healthy controls, the percentages of C18:0 (stearic acid, SA), C22:6 (docosahexaenoic acid, DHA), and n-3 polyunsaturated FAs (n-3 PUFA) were significantly increased, while C18:1 (oleic acid, OA), C18:2 (linoleic acid, LA), and monounsaturated FAs (MUFA) decreased in erythrocyte membranes of GI tumor patients. Also, patient's platelets revealed higher levels of C20:4 (arachidonic acid, AA) and DHA, and lower levels of OA and MUFA.
Our study displayed a remarkable change in the FA composition of erythrocyte and platelet membranes in GI tumor patients as compared with healthy controls. The octadeca-carbon FAs (SA, OA, and LA) in erythrocyte membranes could serve as a potential indicator for GI tumor detection.
1. Introduction
Gastrointestinal (GI) cancers represent a number of malignancies affecting multiple organs of the digestive tract, including esophagus, gall bladder, liver, pancreas, stomach, small intestine, large intestine, colon, rectum, and anus. Such tumors result in a large number of cancer-related mortalities annually worldwide. In particular, gastric cancer (GC) and colorectal cancer (CRC) are the second and fourth leading cause of cancer-related deaths, respectively.[1]
Although a high-fat diet has long been associated with an increased risk of developing certain types of tumors, morbidity does not show any relation with gross dietary fat intake, as assessed by epidemiological investigations. However, a close association between the intake of different types of FA and tumorigenesis has been observed.[2–6] Studies analyzing the relationship between FA and GI tumors have shown that high content of OA, α-linolenic acid (ALA), and dihomo-γ-linolenic acid (DHLA) in the plasma may increase the risk of GC.[7] Furthermore, DHA found in erythrocyte membranes has shown a negative correlation with GC risk.[8] In contrast, DHA in the plasma has shown positive correlation with tumorogenesis and development of CRC,[9] while ALA found in subcutaneous adipose tissues has displayed a negative correlation with CRC risk.[10] In addition, tumor tissues display decreased LA and increased DHLA levels, compared with surrounding normal tissues.[11] Furthermore, some additional studies have reported that administration of PUFAs (polyunsaturated fatty acids) and n-3 PUFA prevented the occurrence of gastric and CRC, while SFA and n-6 PUFA promoted development of such malignancies.[12–15] However, such findings are not consistent across all studies[16–20] and thus emphasize the need for further exploration of the possible link between fatty acids (FAs) and GI tumors.
Therefore, in the present study, we have examined the differences in the FA composition of erythrocyte and platelet membranes from GI tumor patients and healthy controls, in order to identify any correlation between FAs and the presence of GI tumors. Overall, this study may aid in the diagnosis and therapy of GI tumor patients.
2. Methods
2.1. Research subjects
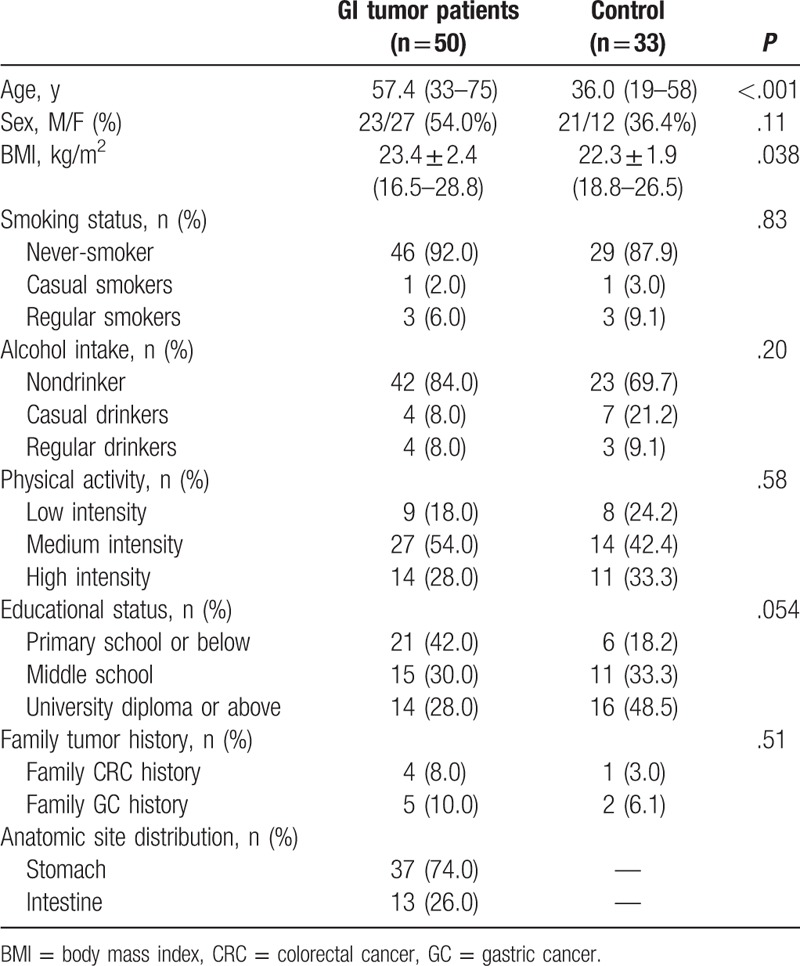
The study was approved by the Ethics committee of Chinese PLA General Hospital and Peking Union Medical College Hospital. All procedures involving human participants were in accordance with the ethical standards of the institutional and national research committee and 1964 Helsinki declaration with all amendments. The informed consent forms were signed by all the subjects. Between June 2013 to March 2014, we recruited 50 GI tumor patients (GC, 37; CRC, 13) undergoing elective ablation of stomach, small intestine, and colorectal carcinomas. The following inclusion criteria was used: age, 18 to 75 years; body weight, 45 to 75 kg; nutritional risk screening (NRS) 2002 score of ≥3; hemoglobin (Hb) level of ≥80 g/L; alanine aminotransferase, total bilirubin, direct bilirubin levels ≤1.5 times of upper limits, normal creatinine level; no metabolic, infectious or psychiatric diseases such as pyrexia, hyperthyroidism, hypothyroidism; no chemoradiotherapy or parenteral nutrition support 3 weeks before surgery. Subjects falling into any of the following criteria were excluded: intraoperative hemorrhage >1000 mL; intraoperative or postoperative transfusion of blood or blood products; patients with serious organ function impairment such as congestive heart failure, symptomatic coronary heart disease, or arrhythmia not responding to drug treatment; patients with a history of serious cerebrovascular disease; participants in another research trial carried out concurrently; patients considered not suitable for the study by researchers; and pregnant or lactating women. In addition, 33 healthy volunteers, recruited between November 2014 and July 2015, were also included in the study as a control group. The inclusion criteria for healthy volunteers was as follows: no history of tumors or metabolic disorders; no serious diseases or any measurable clinical manifestations; no allergies or surgical history; normal results in a physical examination including vital signs, electrocardiogram, blood test, hepatic and renal functions as well as serum lipid levels; and having a normal diet and sleep pattern. The characteristics of patients and healthy control subjects are summarized in Table 1.
Table 1.
Characteristics of healthy controls and GI tumor patients.

2.2. Blood collection, processing, and measurement
The blood (5 mL) was drawn from a vein after overnight fasting, and stored at 4°C to be processed within 4 hours. FAs extraction and detection were performed using previously described methods.[21,22] Briefly, the collected samples were first centrifuged at room temperature, and the supernatants were collected. Next, an equal volume of HEP buffer (140 mM NaCl, 2.7 mM KCl, 3.8 mM HEPES, 5 mM ethylenebis (oxyethylenenitrilo) tetraacetic acid, pH 7.4) was added to the supernatant along with 1 μM prostaglandin E1. After subsequent centrifugation and washing, platelets were collected. The bottom layer of blood samples was processed using a human peripheral blood leukocyte separation kit and erythrocyte separation kit to purify leukocytes and erythrocytes, which were then preserved at −80°C. Membrane phospholipids from the blood cells were extracted using a chloroform-methanol (3:1, vol/vol) solution. PLFAs were then methyl esterified using methylbenzene and methyl alcohol agents. FAs were separated by GC-MS using a Trace 1300 gas chromatograph (Thermo Fisher Scientific, Waltham, MA) with a SP-2560 capillary column (100 m × 0.25 mm × 0.2 μm) as the chromatographic column. A Trace ISQ mass spectrometer was used for FA identification. The gaseous phase temperature programming procedures were used as follows: Helium as the carrier gas, and the initial temperature was set at 140°C for 5 minutes, with the temperature increasing to 150°C at 10°C/min rate, and then to 190°C at 3°C/min rate, and then to 220°C for 1 minute at 2°C/min rate, and then to 240°C for 15minutes at 4°C/min rate. Finally, the injection temperature was set to 250°C.
2.3. Statistical analysis
FA composition was represented as a percentage, and the values of total SFAs (saturated FA) including C8:0, C10:0, C12:0, C14:0, C16:0, C18:0, C20:0, C22:0, C24:0, MUFAs (monounsaturated FAs) including C14:1(n-5), C16:1(n-7), C18:1(n-9), C20:1(n-9), C22:1(n-9), C24:1(n-9); n-6 PUFAs including C18:2(n-6), C18:3(n-6), C20:2(n-6), C20:3(n-6), C20:4(n-6), C22:2(n-6). n-3 PUFAs including C18:3(n-3), C20:3(n-3), C20:5(n-3), C22:5(n-3), C22:6(n-3), along with the ratio of n-6 to n-3 PUFA (n-6/n-3), were calculated. The differences in the FA composition between the blood cell membranes of tumor patients and healthy volunteers were analyzed using a regression model, where FA percentage was the dependent variable, while gender, age, body mass index (BMI), and tumor were independent variables. In addition, multiple-factor analysis was carried out on each of the variable to determine its influence on FA composition. All statistical analyses were performed using SAS9.1 statistical software (SAS Institute Inc., Cary, NC, USA) and a P value of <.05 represented statistically significant difference.
3. Results
3.1. Comparison of GI tumor patient characteristics with healthy controls
GC and CRC patients displayed a high morbidity and mortality and share similar potential tumor markers and therapeutic targets. In western countries, the synchronization incidence of both tumor types is as high as 35.8%.[23] However, previous studies have shown some differences in FA composition between GC and CRC patients, and this could be attributed to the comparison of different sample types including racial differences and varying detection methods. However, in this study, we have undertaken for the first time, the direct comparison of FAs composition in erythrocyte and platelet membranes of GC and CRC patients using GC-MS in Chinese Han population. Our results indicated that there was no significant difference in the FA composition of erythrocyte membranes from tumor patients. Furthermore, there was also no difference in platelets composition (Supplementary Table 1). Thus, we combined GC and CRC patients into 1 group labeled as GI tumor group for further analysis. The basic characteristics of GI tumor patients and healthy controls are summarized in Table 1. Upon analysis, we observed significant differences in age and BMI among both groups. Patients in the tumor group were older in age and had a higher BMI. These 2 characteristics were analyzed by multiple-factor analysis, comparing the FA composition of erythrocyte and platelet membranes in GI tumor patients and healthy controls.
3.2. Comparison of the fatty acid profiles of erythrocyte membranes in healthy controls and GI tumor patients
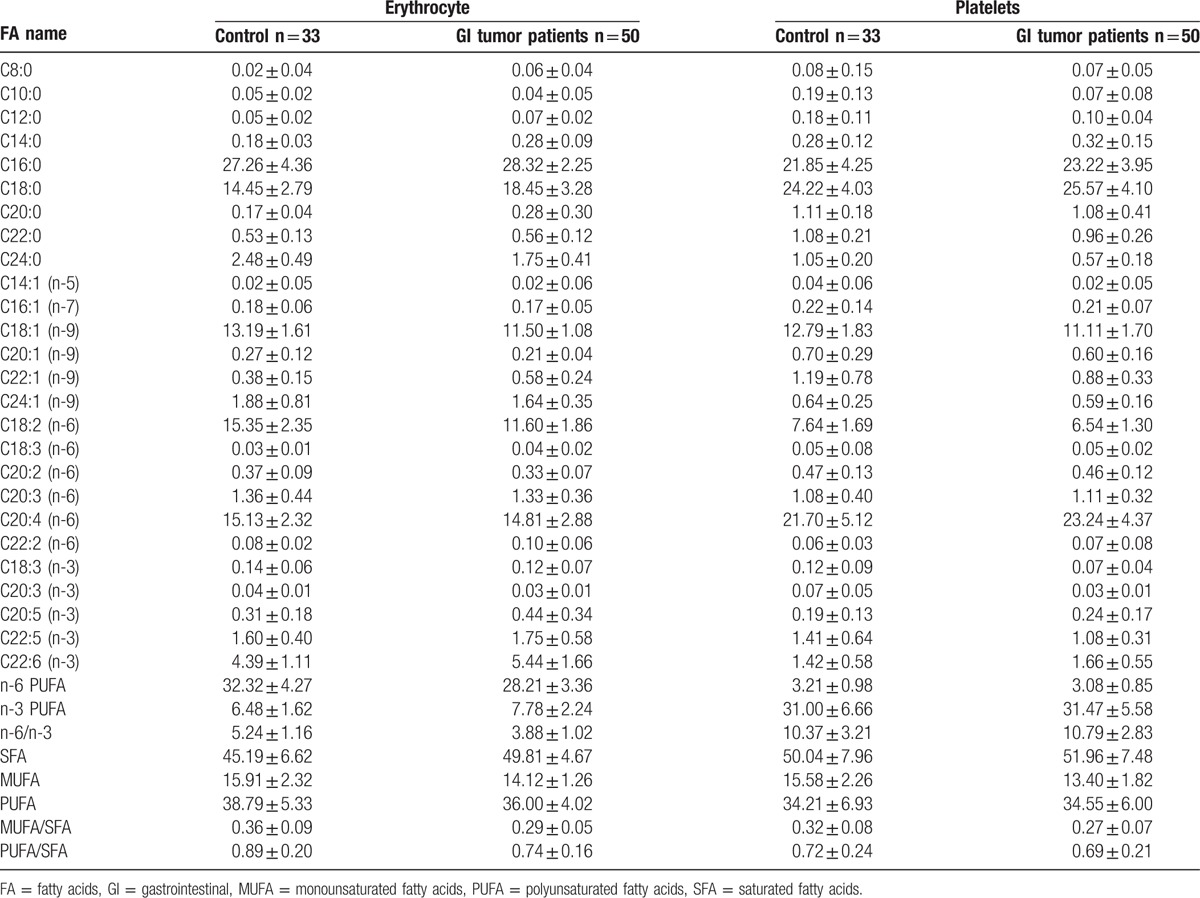
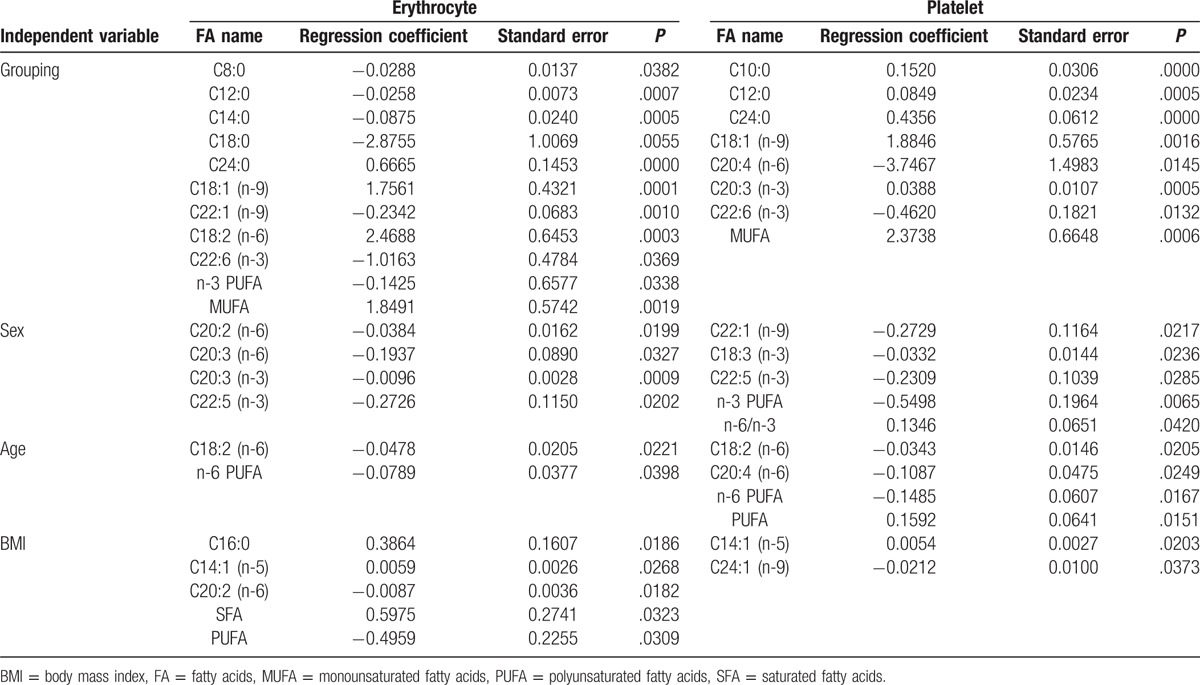
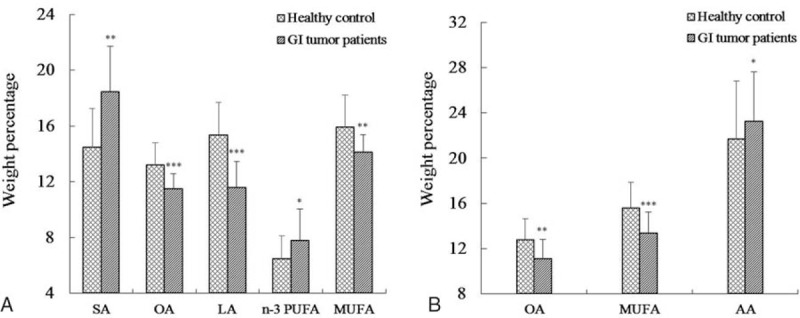
The levels of FAs in erythrocyte membranes of 50 patients and 33 healthy controls are summarized in Table 2. Both groups displayed high quantities of SFA, followed by PUFA and MUFA. In addition, individual FAs such as C16:0, stearic acid (SA), oleic acid (OA), linoleic acid (LA), arachidonic acid (AA), and docosahexaenoic acid (DHA) were relatively abundant. Multiple-factor analysis indicated that differences due to grouping alone (tumor group vs control group) were linked to ten FAs, including C8:0, C12:0, C14:0, SA, C24:0, OA, C22:1, DHA, MUFA, and n-3 PUFA (Table 3). Age and grouping both affected LA content; however, grouping had a more significant effect than age, as analyzed by regression coefficient (2.4688 vs −0.0478) analysis. This indicated that differences in LA levels may be due to grouping alone. Overall, we observed significant differences in 11 FAs between tumor and healthy control groups, with the tumor group demonstrating higher levels of C8:0, C12:0, C14:0, SA, C22:1, DHA, and n-3 PUFA, and lower levels of C24:0, OA, LA, and MUFA. Moreover, on the basis of the proportion of FAs in erythrocytes and the differences between 2 groups, changes in octadeca-carbon FAs levels were most obvious (Fig. 1A).
Table 2.
Fatty acid composition (mean percentage) of erythrocyte and platelet membranes of GI tumor patients and healthy controls.

Table 3.
Multiple-factor analysis of erythrocyte and platelet of GI tumor patients and healthy controls.

Figure 1.

Fatty acid composition of erythrocytes (A) and platelets (B) in healthy controls and GI tumor patients. GI = gastrointestinal, LA = linoleic acid, MUFA = monounsaturated fatty acids, OA = oleic acid, PUFA = polyunsaturated fatty acids, SFA = saturated fatty acids. ∗P < .05; ∗∗P < .01; ∗∗∗P < .001, versus healthy controls.
3.3. Comparison of the fatty acid profiles of platelet membranes in healthy controls and GI tumor patients
The composition of FAs in platelet membranes has been summarized in Table 2. SFA was abundantly found in platelets, followed by PUFA and MUFA. Individual FAs involving C16:0, SA, OA, LA, and AA were also abundant. In addition, grouping demonstrated differences in 7 FAs, including C10:0, C12:0, C24:0, OA, C20:3 (n-3), DHA, and MUFA, as assessed by multiple-factor analysis (Table 3). Furthermore, the difference in AA content maybe due to grouping alone, as the effect of grouping on AA was much larger than age (correlation coefficient, −3.7467 vs −0.1087). In summary, GI tumor patients showed lower levels of C10:0, C12:0, C24:0, OA, C20:3 (n-3), MUFA, and higher levels of AA and DHA FAs in the platelet membranes, than healthy controls (Fig. 1B).
4. Discussion
Our results indicated the differences in the FAs composition of erythrocyte membranes from GI tumor patients and healthy controls, especially 18-carbon FAs (an increase in SA and decreases in OA and LA contents). These differences were consistent with previously published studies analyzing other solid tumors, especially a reduction in LA levels. Compared with healthy individuals, erythrocyte membranes of lung cancer patients demonstrated lower levels of LA, along with plasma from liver and pancreatic cancer patients displaying similar profiles. In addition, liver, breast, and colon cancer tissues also displayed significantly lower levels of LA in comparison to surrounding normal tissues. In contrast, the plasma from hematological tumor patients, such as multiple myeloma, displayed markedly elevated levels of LA.[24–27] Moreover, our study showed a significant increase in the levels of SA FAs, while a decrease in OA levels in erythrocyte membranes of GI tumor patients. Surprisingly, our findings were somewhat contradictory to the results observed in various other cancers. For example, non-small cell lung cancer patients showed higher levels of OA and SA in the erythrocyte membranes than healthy subjects. In contrast, myeloma patients displayed lower levels of OA and SA in the erythrocyte membranes.[28] Further, levels of SA FA significantly decreased, while OA levels increased in the erythrocyte membranes of patients with gallbladder primary carcinoma. Thus, we can say that typically there is always a change in the levels of octadeca-carbon FAs in multiple tumors, but GI tumors showed an opposing trend.
In addition, a variety of studies involving multiple tumor types have consistently demonstrated higher levels of SFA in erythrocyte membranes.[8,24,28–30] Indeed, there is a positive correlation between CRC risk and SFA levels. However, PUFA levels show a negative correlation with such cancers.[28] Consistent with these reports, our study also showed a significant increase in SFA levels and a remarkable decrease in PUFA levels in erythrocyte membranes from GI tumor patients. The decrease in PUFA content suggests that lipid peroxidation of PUFA may occur in erythrocyte membranes, and can trigger cellular fluidity and reduce the permeability of cell membranes.
PUFA consists of n-3 PUFA and n-6 PUFA, and both of these compete for the same metabolic enzymes, but have different physiological functions. The detailed examination of previously published studies regarding n-3 PUFA in GI tumor patients indicated inconsistent results. For example, some studies have reported increased levels of n-3 PUFA in GC and CRC patients, and indicated a positive correlation with tumorigenesis.[7,8] In contrast, a select few studies have demonstrated a negative correlation of n-3 PUFA with tumor development, with decreased levels in tumor patients.[8,31] Similar results were also observed with n-6 PUFA in GI tumors, with levels decreasing in erythrocyte membranes.[8,28,29] However, we observed a significant increase in n-3 PUFA levels and a decrease in n-6 PUFA. To explain these results, we hypothesized that excessive dietary intake of n-6 PUFA may increase incidence of tumor, whereas n-3 PUFA could have an opposite effect on tumorigenesis. Patients with tumor increasingly utilize n-6 PUFA, and thus, its levels decrease, while n-3 PUFA levels remain high in parallel.
Furthermore, despite our observation of lower levels of LA (a precursor of FA AA) in the erythrocyte membranes of tumor patients in comparison to the control group, we did not observe any overall differences between AA levels of patients and healthy controls. The tentative explanation may be that lower level of LA upregulate Δ6D enzymatic activity, which in turn increased the in vivo synthesis of AA. Moreover, with respect to the changes in AA content, previous studies to date have not drawn any consensus in patients with tumors.[24,26,29,31,32]
Moreover, our study also investigated for the first time the FA profiles of platelets in GI tumor patients. We observed higher levels of AA FA in the platelets of GI tumor patients, than healthy controls. In parallel, we also observed changes in OA, DHA, and MUFA levels in platelets. The previous studies have demonstrated that lipid changes in platelets may play a role in platelet activation and increase thrombotic risk. Further, changes in AA and other FA profiles may be associated with platelet function in GI tumor progression and warrant further investigation.
Our results also indicated that the majority of FA profiles were significantly different between erythrocytes and platelets, expect for some such as C8:0, C10:0, C14:1(n-5), C22:2(n-6), C20:3(n-3); however, their content levels were extremely low. The total content of SFA and PUFA was approximately the same, with only a modest difference in MUFA levels.
On the basis of our results, we concluded that there were significant differences in the FA composition of both erythrocyte and platelet membranes between GI tumor patients and healthy controls. The octadeca-carbon FAs (SA, OA, and LA) in erythrocyte membranes may serve as indicators for GI tumor detection. However, further studies exploring the effects of n-3 PUFA and AA on GI tumors are warranted. In particular, our future studies would be designed to compare the FA composition of tumor and nontumor cells, with an aim to specifically explore the role of FAs from octadeca-carbon species in GI tumorigenesis.
Supplementary Material
Footnotes
Abbreviations: AA = arachidonic acid, ALA = α-linolenic acid, ANOVA = analysis of variance, BMI = body mass index, CRC = colorectal cancer, DHA = docosahexaenoic acid, DHLA = dihomo-γ-linolenic acid, DPA = docosapentaenoic acid, ECG = electrocardiogram, EPA = eicosapentaenoic acid, FA = fatty acid, GC = gastric cancer, GC-MS = gas-chromatography-mass spectrometry, GI = gastrointestinal, GLA = γ-linolenic acid, LA = linoleic acid, MUFA = monounsaturated fatty acids, NRS = nutritional risk screening, OA = oleic acid, PA = palmitic acid, PLFA = phospholipid fatty acid, PN = parenteral nutritional, PUFA = polyunsaturated fatty acids, SA = stearic acid, SFA = saturated fatty acids.
The authors declare that they have no conflict of interest.
Supplemental Digital Content is available for this article.
References
- [1].Ferlay J, Soerjomataram I, Dikshit R, et al. Cancer incidence and mortality worldwide: sources, methods and major patterns in GLOBOCAN 2012. Int J Cancer 2015;136:E359–86. [DOI] [PubMed] [Google Scholar]
- [2].Khandekar MJ, Cohen P, Spiegelman BM. Molecular mechanisms of cancer development in obesity. Nat Rev Cancer 2011;11:886–95. [DOI] [PubMed] [Google Scholar]
- [3].Nieman KM, Romero IL, Van Houten B, et al. Adipose tissue and adipocytes support tumorigenesis and metastasis. Biochim Biophys Acta 2013;1831:1533–41. [DOI] [PMC free article] [PubMed] [Google Scholar]
- [4].Comba A, Maestri DM, Berra MA, et al. Effect of omega-3 and omega-9 fatty acid rich oils on lipoxygenases and cyclooxygenases enzymes and on the growth of a mammary adenocarcinoma model. Lipids Health Dis 2010;9:112. [DOI] [PMC free article] [PubMed] [Google Scholar]
- [5].Berquin IM, Edwards IJ, Kridel SJ, et al. Polyunsaturated fatty acid metabolism in prostate cancer. Cancer Metastasis Rev 2011;30:295–309. [DOI] [PMC free article] [PubMed] [Google Scholar]
- [6].Lu X, Yu H, Ma Q, et al. Linoleic acid suppresses colorectal cancer cell growth by inducing oxidant stress and mitochondrial dysfunction. Lipids Health Dis 2010;9:106. [DOI] [PMC free article] [PubMed] [Google Scholar]
- [7].Chajes V, Jenab M, Romieu I, et al. Plasma phospholipid fatty acid concentrations and risk of gastric adenocarcinomas in the European Prospective Investigation into Cancer and Nutrition (EPIC-EURGAST). Am J Clin Nutr 2011;94:1304–13. [DOI] [PubMed] [Google Scholar]
- [8].Zhang P, Wen X, Gu F, et al. Role of serum polyunsaturated fatty acids in the development of colorectal cancer. Int J Clin Exp Med 2015;8:15900–9. [PMC free article] [PubMed] [Google Scholar]
- [9].Kuriki K, Wakai K, Matsuo K, et al. Gastric cancer risk and erythrocyte composition of docosahexaenoic acid with anti-inflammatory effects. Cancer Epidemiol Biomarkers Prev 2007;16:2406–15. [DOI] [PubMed] [Google Scholar]
- [10].Cottet V, Vaysse C, Scherrer ML, et al. Fatty acid composition of adipose tissue and colorectal cancer: a case-control study. Am J Clin Nutr 2015;101:192–201. [DOI] [PubMed] [Google Scholar]
- [11].Yang K, Li H, Dong J, et al. Expression profile of polyunsaturated fatty acids in colorectal cancer. World J Gastroenterol 2015;21:2405–12. [DOI] [PMC free article] [PubMed] [Google Scholar]
- [12].Larsson SC, Kumlin M, Ingelman-Sundberg M, et al. Dietary long-chain n-3 fatty acids for the prevention of cancer: a review of potential mechanisms. Am J Clin Nutr 2004;79:935–45. [DOI] [PubMed] [Google Scholar]
- [13].Cockbain AJ, Toogood GJ, Hull MA. Omega-3 polyunsaturated fatty acids for the treatment and prevention of colorectal cancer. Gut 2012;61:135–49. [DOI] [PubMed] [Google Scholar]
- [14].Wu MH, Tsai YT, Hua KT, et al. Eicosapentaenoic acid and docosahexaenoic acid inhibit macrophage-induced gastric cancer cell migration by attenuating the expression of matrix metalloproteinase 10. J Nutr Biochem 2012;23:1434–9. [DOI] [PubMed] [Google Scholar]
- [15].Shimakura S, Boland CR. Eicosanoid production by the human gastric cancer cell line AGS and its relation to cell growth. Cancer Res 1992;52:1744–9. [PubMed] [Google Scholar]
- [16].Song M, Chan AT, Fuchs CS, et al. Dietary intake of fish, omega-3 and omega-6 fatty acids and risk of colorectal cancer: a prospective study in U.S. men and women. Int J Cancer 2014;135:2413–23. [DOI] [PMC free article] [PubMed] [Google Scholar]
- [17].Norat T, Bingham S, Ferrari P, et al. Meat, fish, and colorectal cancer risk: the European Prospective Investigation into cancer and nutrition. J Natl Cancer Inst 2005;97:906–16. [DOI] [PMC free article] [PubMed] [Google Scholar]
- [18].Chao A, Thun MJ, Connell CJ, et al. Meat consumption and risk of colorectal cancer. JAMA 2005;293:172–82. [DOI] [PubMed] [Google Scholar]
- [19].Kato I, Akhmedkhanov A, Koenig K, et al. Prospective study of diet and female colorectal cancer: the New York University Women's Health Study. Nutr Cancer 1997;28:276–81. [DOI] [PubMed] [Google Scholar]
- [20].Dai J, Shen J, Pan W, et al. Effects of polyunsaturated fatty acids on the growth of gastric cancer cells in vitro. Lipids Health Dis 2013;12:71. [DOI] [PMC free article] [PubMed] [Google Scholar]
- [21].Folch J, Lees M, Sloane Stanley GH. A simple method for the isolation and purification of total lipides from animal tissues. J Biol Chem 1957;226:497–509. [PubMed] [Google Scholar]
- [22].Liu Z, Weng R, Feng Y, et al. Fatty acid profiling of blood cell membranes by gas chromatography with mass spectrometry. J Sep Sci 2016;39:3964–72. [DOI] [PubMed] [Google Scholar]
- [23].Park WS, Kim HJ, Lee GK, et al. Anti-adhesive functions of CD43 expressed on colon carcinoma cells through the modulation of integrins. Exp Mol Pathol 2012;92:82–9. [DOI] [PubMed] [Google Scholar]
- [24].de Castro J, Hernandez-Hernandez A, Rodriguez MC, et al. Comparison of changes in erythrocyte and platelet fatty acid composition and protein oxidation in advanced non-small cell lung cancer. Cancer Invest 2006;24:339–45. [DOI] [PubMed] [Google Scholar]
- [25].Jurczyszyn A, Czepiel J, Gdula-Argasinska J, et al. Plasma fatty acid profile in multiple myeloma patients. Leuk Res 2015;39:400–5. [DOI] [PubMed] [Google Scholar]
- [26].Qiu JF, Zhang KL, Zhang XJ, et al. Abnormalities in plasma phospholipid fatty acid profiles of patients with hepatocellular carcinoma. Lipids 2015;50:977–85. [DOI] [PubMed] [Google Scholar]
- [27].Macasek J, Vecka M, Zak A, et al. Plasma fatty acid composition in patients with pancreatic cancer: correlations to clinical parameters. Nutr Cancer 2012;64:946–55. [DOI] [PubMed] [Google Scholar]
- [28].Kuriki K, Wakai K, Hirose K, et al. Risk of colorectal cancer is linked to erythrocyte compositions of fatty acids as biomarkers for dietary intakes of fish, fat, and fatty acids. Cancer Epidemiol Biomarkers Prev 2006;15:1791–8. [DOI] [PubMed] [Google Scholar]
- [29].Kuriki K, Hirose K, Wakai K, et al. Breast cancer risk and erythrocyte compositions of n-3 highly unsaturated fatty acids in Japanese. Int J Cancer 2007;121:377–85. [DOI] [PubMed] [Google Scholar]
- [30].Jurczyszyn A, Czepiel J, Gdula-Argasinska J, et al. Erythrocyte membrane fatty acids in multiple myeloma patients. Leuk Res 2014;38:1260–5. [DOI] [PubMed] [Google Scholar]
- [31].Mohammadzadeh F, Mosayebi G, Montazeri V, et al. Fatty acid composition of tissue cultured breast carcinoma and the effect of stearoyl-CoA desaturase 1 inhibition. J Breast Cancer 2014;17:136–42. [DOI] [PMC free article] [PubMed] [Google Scholar]
- [32].Azordegan N, Fraser V, Le K, et al. Carcinogenesis alters fatty acid profile in breast tissue. Mol Cell Biochem 2013;374:223–32. [DOI] [PubMed] [Google Scholar]
Associated Data
This section collects any data citations, data availability statements, or supplementary materials included in this article.


