Abstract
The beating heart undergoes cyclic mechanical and electrical activity during systole and diastole. The interaction between mechanical stimulation and propagation of the depolarization wavefront is important for understanding not just normal sinus rhythm, but also mechanically-induced cardiac arrhythmia. The present study presents a new platform to study mechanoelectrical coupling in a three-dimensional in vitro model of the myocardium. Cardiomyocytes and cardiac fibroblasts are seeded within extracellular matrix proteins and form constructs constrained by microfabricated tissue gauges that provide in situ measurement of contractile function. The microcantilever of an atomic force microscope is indented into the construct at varying magnitudes and frequencies to cause a coordinated contraction. The results indicate that changes in indentation depth and frequency do not significantly affect the magnitude of contraction, but increasing indentation frequency significantly increases the contractile velocity. Overall, the present study demonstrates the validity of this platform as a means to study mechanoelectrical coupling in a three-dimensional setting, and to investigate the mechanism underlying mechanically-stimulated contraction.
Index Terms: Atomic Force Microscopy, Cardiomyocyte, Mechanoelectrical Coupling
I. Introduction
The application of active mechanical stimulation like stretch to a cardiomyocyte can cause local depolarization, which leads to intracellular calcium release and contraction of the cell [1–3]. The process of mechanoelectrical coupling in cardiomyocytes has been extensively studied in vitro because of its implications for induction and termination of cardiac arrhythmias [4–5]. To explore this phenomenon in vitro, previous studies have observed the electrical depolarization of single cells or monolayers plated on a two-dimensional substrate and exposed to either an applied force [6,7] or fluid shear stress [8]. However, this configuration cannot mimic several aspects of the in vivo myocardium, not least of which is the three-dimensionality of native tissue.
Micro-scale tissue gauges provide a platform to study cardiomyocytes in a 3D environment [9–11]. Mixtures of cardiomyocytes and fibroblasts isolated from neonatal rat hearts are combined with solubilized matrix and centrifuged into 800x400 μm wells containing two flexible posts made from polydimethylsiloxane (PDMS) posts (referred to hereafter as microTUGs). After matrix polymerization and cell-mediated contraction, the mixtures form micro-scale constructs that are suspended between the PDMS posts. The formed constructs exhibit in vivo-like myofibrillar assembly and cell alignment. The force exerted by the contraction of the tissues can be measured in situ by observing the deflection of the PDMS posts. The system is a micro-scale adaptation of a previously described meso-scale cardiac tissue setup [12].
Traditionally, constructs within this system are stimulated by the application of an electric field to induce contraction. However, we have found that contraction of the constructs can also be instigated by indentation with the microcantilever of an atomic force microscope (AFM). AFM has been used extensively to measure the stiffness of cells and tissues in vitro [13–16], in addition to mechanically perturbing biological samples [17,18]. Combining the tissue gauge platform with AFM creates a system capable of recapitulating the mechanoelectrical coupling of cardiomyocytes in a 3D setting. The system also has the advantage of creating multiple samples for each condition since each substrate contains >100 wells, so that multiple tissues can be tested in each substrate with the rate limiting step being the use of AFM to perform the indentation. The present study establishes this platform as a means to effectively study both mechanoelectrical coupling by measuring the effect of indentation magnitude and frequency on the response of the constructs.
II. Materials and Methods
MicroTUG substrates were constructed using soft lithography. Briefly, SU-8 photoresist (MicroChem) was spun onto silicon wafers, exposed, and developed to create the geometry of the posts within the wells. PDMS (Dow-Corning) stamps were cast off the silicon masters, and then used to generate the PDMS microTUGs used for the experiments. A complete description of microTUG fabrication can be found in [9]. To generate the constructs, 750,000 cells of the suspension isolated from the ventricles of 2–3 day old Sprague-Daley rats were seeded in a 1 mg/mL salmon fibrin (Reagent Proteins, Pfenix, Inc) gel supplemented with 0.25 mg/mL bovine collagen type I. Constructs were fed daily with M199 medium supplemented with 10% chick embryo extract and 0.1% antibiotic antimycotic solution. The solution contains 75 μM streptomycin, a known inhibitor of stretch-activated channels. However, we found no significant difference in construct response to 1 Hz indentation with and without the presence of streptomycin.
At day 5, the microTUG substrates were transferred to the AFM setup, consisting of a Bioscope AFM (Bruker) probe fitted to an inverted microscope with a heated stage. A 3.5-micron diameter bead was fixed to the probe tip and lowered into contact with 1 mL of medium bathing the microTUG substrate, and the stage was kept at 37C. Measurements were made within one hour after removing the substrate from the incubator, since CO2 level was not controlled. Only non-spontaneously contracting constructs were targeted for mechanical stimulation (about 10–20% of the constructs spontaneously beat at 5 days in culture). Once contact was made with the construct, the indentation depth and frequency were set and the construct contractions were measured using a camera attached to the inverted microscope. The frame rate was set to 11 frames per second, and at least one full contraction was required for a successful measurement. To quantify the deflection of the microTUG posts, ImageJ was used to measure the displacement of the post during construct beating. Contraction velocity was calculated by dividing the post displacement during contraction by the time to peak.
After testing, the microTUG substrates were fixed in 3.7% paraformaldehyde, permeabilized in 0.1% Triton X-100, and stained with Texas Red phalloidin (1:50), DAPI (1:1000), and a primary antibody for alpha-actinin (1:100). Data are presented as mean +/− standard deviation for n = 3 tissues, and contraction magnitude and speed values were compared using one-way ANOVA and Tukey’s post-hoc test with statistical significance accepted for p < 0.05.
III. Results
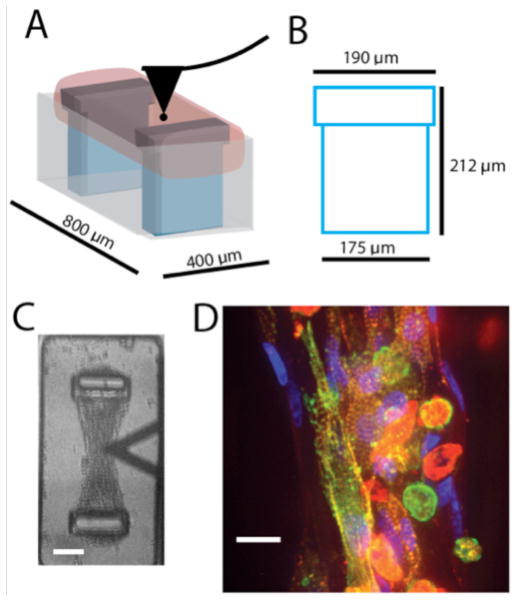
A schematic of the testing configuration can be found in Figure 1A. The cell-seeded hydrogel (pink) is suspended between the two posts (blue) within the 400x800 μm microTUG substrate wells (gray), and the AFM probe (black) is lowered to the top surface of the construct. The dimensions of the post are shown in Figure 1B. The post has a 190 μm head that the contracting fibroblasts wrap around to anchor the construct. A brightfield image from the high-speed camera is shown in Figure 1C. The AFM tip (triangular shape) is placed over the center of the construct, which is attached to the opposing TUG posts. Figure 1D shows a construct stained for nuclei (blue), actin (red), and alpha-actinin (green). The stain demonstrates self-organization of the cell-seeded constructs. Alpha-actinin concentrated in the z-disks of the sarcomeres distinguishes the cardiomyocytes from fibroblasts (since actin is present in both cell types). Fibroblasts are present in the outer edges of the construct, while cardiomyocytes are located primarily in the center. Therefore, the AFM probe makes contact on or near the centerline of the construct for all measurements to assure that the tip is not indenting an area devoid of cardiomyocytes.
Figure 1.
A) TUG schematic indicating the position of the AFM probe as it contacts the micro-tissue. B) Post dimensions C) Brightfield image of the construct just prior to contact with the AFM probe (scale bar = 50 microns). D) Construct stained with Texas Red phalloidin (red), DAPI (blue), and alpha-actinin (green). Scale bar = 20 microns.
Mechanical stimulation was implemented by displacing the base on the AFM cantilever at a constant rate for a specified distance and then immediately retracting the probe at the same rate to form an indentation ramp. Each indentation cycle had a period of 100 ms. Indentations of the sample by the bead attached to the AFM probe using a ramp size greater than 0.5 microns were found to induce a net contraction of the construct. Assuming the construct has a resting elastic modulus of 5 kPa [19], a 0.5 micron indentation corresponds to a normal force of approximately 3.9 nN. Having discovered that indenting with the AFM tip causes a coordinated contraction of the construct, we sought to determine if the indentation depth and frequency affected the resultant contraction force of the tissue. We modulated the indentation depth by setting the ramp size of the AFM tip to 1, 2, and 3 microns. The ramp size does not exactly match the indentation depth of the probe because the construct causes deflection of the probe tip relative to the probe head, and actual indentation depths were not measured due to the pacing of the AFM probe during testing. Using the spring constant of the cantilever and a Hertz model for contact with a substrate of elastic moduli ranging from 1 to 5 kPa, we calculated the indentation depth for a given ramp size (Supplementary Figure 1) and found that at least 80% of the ramp size translated to construct indentation. Three AFM indentation frequencies were chosen (0.5, 1, and 2 Hz), resulting in a total of 9 testing conditions. For control experiments, non-stimulated spontaneously contracting tissues were analyzed.
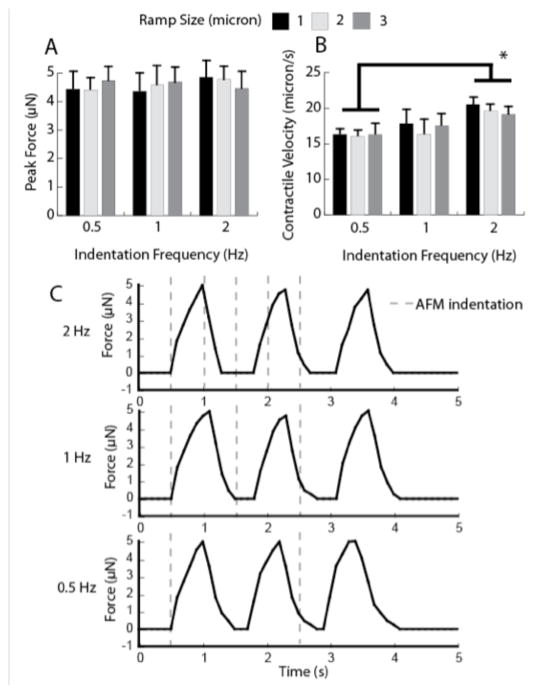
Figure 2A shows the averaged peak force exerted by the constructs, calculated from measurements of the TUG post displacement and a spring constant of 0.45 μN/μm [10] for the three indentation lengths and frequencies. The data indicate that ramp size has no significant effect on the resultant contraction force magnitude. The varying ramp sizes and frequencies all induced an approximately 10-micron displacement of both of the TUG posts, corresponding to a peak force of between 4 and 5 μN. These values are within the range of force values reported using electrical stimulation (4–8 μN) [10]. We also measured the contractile velocity to determine if indentation depth and frequency had any effect on the velocity at which the constructs contract. Figure 2B shows that ramp size did not significantly affect contraction velocity. However, an indentation frequency of 2 Hz induced a significantly higher contraction velocity compared to constructs stimulated at 0.5 Hz. Interestingly, the frequency of the AFM-stimulated contraction events did not mirror the frequency of the indentation, but rather remained approximately at 1 Hz. Therefore, after the initial contraction, the indentation was not synchronous with the initiation of a contraction event. This is evident in Figure 2C, which exhibits the force exerted by tissues stimulated with three indentation frequencies.
Figure 2.
A) Peak force as a function of indentation ramp size of the AFM probe. B) Contraction speed as a function of ramp size. (* denotes p < 0.05). C) Example traces of constructs stimulated by 2, 1, and 0.5 Hz. The timing of indentation is represented by a dotted gray line.
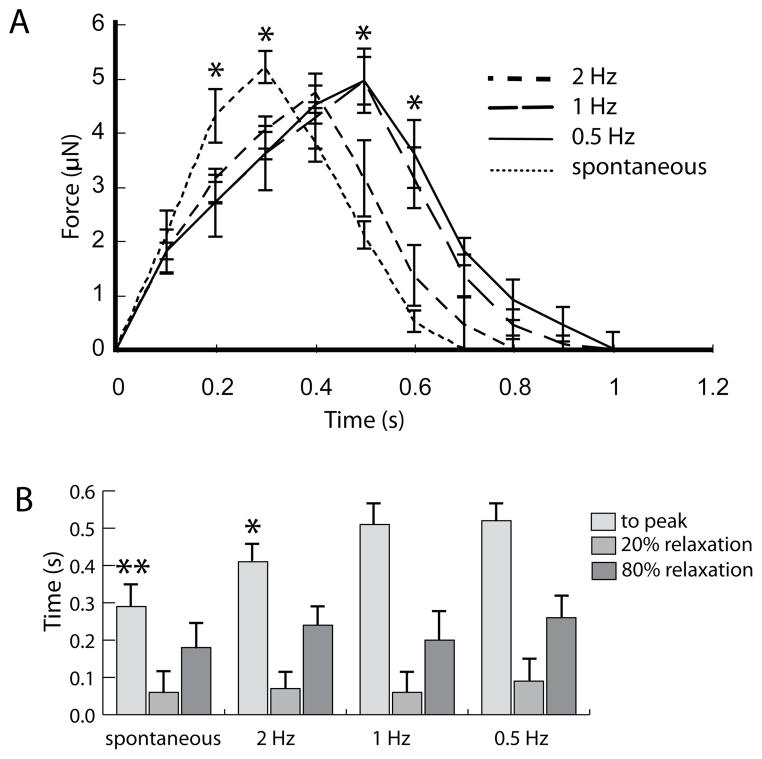
Figure 3A compares averaged force-time traces of constructs stimulated by a 1 μm ramp size at 0.5, 1, and 2 Hz with constructs undergoing spontaneous contractions. The traces were averaged over several periods and at least three different tissues to create a representative waveform of the construct contraction. The figure illustrates that indentation frequency has a significant effect on the contraction and relaxation dynamics. Constructs stimulated by 2 Hz indentations display a shorter contraction period than 0.5 and 1 Hz. Interestingly, spontaneously contracting constructs display the shortest contraction period. Although in contrast to the indentation-driven contractions, the spontaneous beating did not occur at a consistent frequency. The waveforms are quantified in Figure 3B by plotting the time to peak, time to 20% relaxation, and time to 80% relaxation (relative to time to peak). The time to peak is significantly shorter in constructs stimulated by 2Hz indentations compared to 1 and 0.5Hz. The spontaneously contracting constructs exhibit significantly different times to peak compared to all the indentation-induced contracting constructs, suggesting a quicker depolarization.
Figure 3.
A) Averaged traces of force generated by constructs stimulated by 1 μm indentations at different frequencies and by spontaneously contracting constructs. (* denotes p < 0.05 compared to constructs stimulated by 2 Hz frequency). B) Time to peak, 20% relaxation, and 80% relaxation (relative to time to peak) for the average traces plotted in (A). (*denotes p < 0.05 compared to 1 and 0.5 Hz frequency, ** denotes p < 0.05 compared to AFM-stimulated constructs).
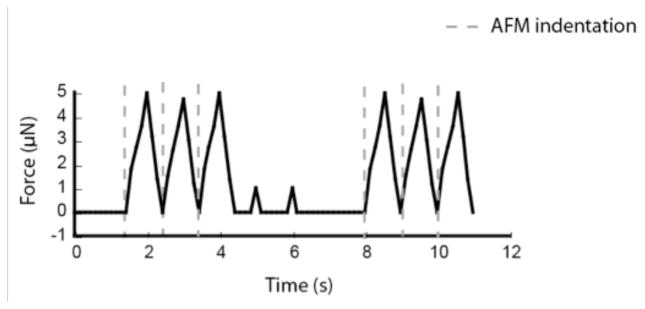
We next determined whether sustained indentations were necessary for continuous contractions. Because the contraction frequency is steady at approximately 1 Hz, the indentations are not necessarily in phase with the contractions after the initial stimulation. Moreover, we sought to determine whether a given ramp size could continue to stimulate a coordinated contraction, or if the construct would develop tolerance and require higher indentation depths over time. Figure 4 shows an example waveform of a tissue stimulated with 1-micron ramp sizes at a frequency of 1 Hz. AFM indentation is started, stopped, and then restarted. The figure shows that once the AFM stimulation is turned off (between 4 and 8 seconds), coordinated contractions abruptly terminate. Supplemental Video 1 illustrates the effect of pausing AFM indentation. In between indentation cycles, several cells within the construct contracted (as evidenced by the 1 μN force peaks). However, there was no coordinated contraction during this time. For all the constructs tested, continuous AFM stimulation was required to sustain the contractile events. The longest period tested was 3 minutes.
Figure 4.
Force trace of a construct stimulated by 1-micron, 1Hz indentations for two distinct cycles. Indentations are applied between 0.5 and 3.5 seconds, and 8 and 10 seconds.
IV. Discussion
The method described in the present study provides a novel means to elucidate the mechanoelectrical coupling of cardiomyocytes in a 3D environment. Previous studies have shown that both active [6,7] and passive [20,21] mechanical stimulation can modulate the contractile dynamics of cardiomyocytes. However, previous studies were conducted on 2D surfaces coated with extracellular matrix proteins, which is not as representative of the in vivo composition of the myocardium. The microTUG system provides a platform to study cardiomyocytes in a 3D environment, and incorporation of AFM allows for controlled mechanical stimulation of these constructs. Additionally, the microTUG system allows for direct quantification of contraction velocity and force magnitude, which are defining properties of striated muscle.
AFM ramp sizes more than 0.5 microns were found to induce coordinated contraction events at approximately 1 Hz, regardless of the indentation frequency (within a range from 0.5 to 2 Hz). Modulating indentation depth and frequency did not significantly affect the peak force exerted by the constructs. These results imply that the mechanism underlying the mechanically induced contraction is not affected by the extent of the probe indentation, once a certain threshold required for contraction has been surpassed. The contraction velocity was also unaffected by indentation depth, but increased significantly with indentation frequency. Therefore, even though the resultant contraction force is unaffected by ramp size or frequency, the time to peak of the contraction can be controlled by the frequency of the microcantilever.
Beyond providing a platform for exploring mechanoelectrical coupling of cardiomyocytes in 3D, the capability for mechanical point stimulation has additional benefits. Current stimulation techniques for microTUGs involve globally applied electric [9–10] or magnetic [11] fields. Point stimulation provides the means to track the propagation of depolarization wavefronts in anisotropic conditions like ectopic foci. Although the setup used for the present study was limited to frame rates of about 10 Hz, combining a higher frame rate camera with a voltage sensitive or calcium dye would allow for tracking of the depolarization and repolarization wavefronts. Changes could be made to the construct composition, stiffness, cell alignment, and other parameters to study their effect on how the depolarization wavefront propagates in response to changes in preload, afterload, and inotropy.
V. Conclusion
This study demonstrates the ability of AFM indentations to stimulate coordinated contractions of in vitro cardiac microtissues. Further research is required to determine the mechanism underlying this effect. Importantly, the system provides a means to investigate clinically relevant conditions such as the induction and termination of ventricular arrhythmias by acute mechanical stimulation, precordial impact, and mechanical pacing.
Supplementary Material
Supplementary Figure: A) Image of the AFM in contact with a construct within the TUG system. B) Schematic of Hooke’s Law applied to the cantilever and Hertz’s equation to describe the AFM indentation. C) Because the cantilever and construct are in series, the deformations of each sum to the total ramp size and the force is constant. D) Calculated indentation depth based on three estimated construct elastic moduli. Even for worst case scenario (5 kPa elastic modulus and 3 micron ramp size), the indentation is 80% of the ramp size.
Acknowledgments
This work was supported by from a T32 Interdisciplinary Cardiovascular Training Grant from the National Institutes of Health (to P.G.)
P.A. Galie thanks Rosa Alvarez and Anbin Mu for their assistance in isolating the cardiomyocytes and cardiac fibroblasts.
Contributor Information
Peter A. Galie, Institute for Medicine and Engineering at the University of Pennsylvania. 1010 Vagelos Laboratory, 3340 Smith Walk, Philadelphia, PA 19104
Fitzroy J. Byfield, Institute for Medicine and Engineering at the University of Pennsylvania. 1010 Vagelos Laboratory, 3340 Smith Walk, Philadelphia, PA 19104
Christopher S. Chen, Biomedical Engineering Department at Boston Unversity, 36 Cummington St, Boston, MA 02215
J. Yasha Kresh, Cardiothoracic Surgery Department at Drexel University. 245 N. 15th Street, Philadelphia, PA 19102.
Paul A. Janmey, Institute for Medicine and Engineering at the University of Pennsylvania. 1010 Vagelos Laboratory, 3340 Smith Walk, Philadelphia, PA 19104
References
- 1.Franz MR, Cima R, Wang D, Profitt D, Kurz R. Electrophysiological effects of myocardial stretch and mechanical determinants of stretch-activated arrhythmias. Circulation. 1992;86:968–978. doi: 10.1161/01.cir.86.3.968. [DOI] [PubMed] [Google Scholar]
- 2.Stacy GP, Jobe RL, Taylor LK, Hansen DE. Stretch-induced depolarization’s as a trigger of arrhythmias in isolated canine left ventricles. AJP – Heart and Circ Phys. 263:H613–H621. doi: 10.1152/ajpheart.1992.263.2.H613. [DOI] [PubMed] [Google Scholar]
- 3.Tavi P, Laine M, Weckstrom M. Effect of gadolinium on stretch-induced changes in contraction and intracellularly recorded action- and afterpotentials of rat isolated atrium. British Journal of Physiology. 1996;118(2):407–413. doi: 10.1111/j.1476-5381.1996.tb15417.x. [DOI] [PMC free article] [PubMed] [Google Scholar]
- 4.Kohl P, Nesbitt AD, Cooper PJ, Lei M. Sudden cardiac death by Commotio cordis: role of mechano-electric feedback. Cardiovascular Research. 2001;50:280–289. doi: 10.1016/s0008-6363(01)00194-8. [DOI] [PubMed] [Google Scholar]
- 5.Kim DY, White E, Saint DA. Increased mechanically-induced ectopy in the hypertrophied heart. Progress in Biophysics and Molecular Biology. 2012;110(2–3):331–339. doi: 10.1016/j.pbiomolbio.2012.07.004. [DOI] [PubMed] [Google Scholar]
- 6.Kamkin A, Kiseleva I, Wagner KD, Scholz H. Mechano-electric feedback in the heart: Evidence from intracellular microelectrode recordings on multicellular preparations and single cells from healthy and diseased tissue. In: Kamkin A, Kiseleva I, editors. Mechanosensitivity in Cells and Tissues. 2005. [PubMed] [Google Scholar]
- 7.Vandenburgh HH, et al. Response of neonatal rat cardiomyocytes to repetitive mechanical stimulation in vitro. Annals of the New York Academy of Sciences. 1995:19–29. doi: 10.1111/j.1749-6632.1995.tb17403.x. [DOI] [PubMed] [Google Scholar]
- 8.Kong CR, Bursac N, Tung L. Mechanoelectrical excitation by fluid jets in monolayers of cultured cardiac myocytes. Journal of Applied Physiology. 2005;98(6):2328–2336. doi: 10.1152/japplphysiol.01084.2004. [DOI] [PubMed] [Google Scholar]
- 9.Legant WR, Pathak A, Yang MT, Deshpande VS, McMeeking RM, Chen CS. Microfabricated tissue gauges to measure and manipulate forces from 3D microtissues. Proceedings of the National Academy of Sciences. 2009;106(25):10097–10102. doi: 10.1073/pnas.0900174106. [DOI] [PMC free article] [PubMed] [Google Scholar]
- 10.Boudou T, Legant WR, Mu A, et al. A microfabricated platform to measure and manipulate the mechanics of engineered cardiac microtissues. Tissue Engineering Part A. 2011;18(9–10):910–919. doi: 10.1089/ten.tea.2011.0341. [DOI] [PMC free article] [PubMed] [Google Scholar]
- 11.Zhao R, Boudou T, Wang WG, Chen CS, Reich DH. Decoupling Cell and Matrix Mechanics in Engineered Microtissues Using Magnetically Actuated Microcantilevers. Advanced Materials. 2013 doi: 10.1002/adma.201203585. [DOI] [PMC free article] [PubMed] [Google Scholar]
- 12.Lee EJ, et al. Engineered cardiac tissues for in vitro assessment of contractile function and repair mechanisms. Engineering in Medicine and Biology Society, 2006. EMBS’06. 28th Annual International Conference of the IEEE; 2006. pp. 849–852. [DOI] [PubMed] [Google Scholar]
- 13.Radmacher M. Measuring the elastic properties of biological samples with the AFM. Engineering in Medicine and Biology Magazine, IEEE. 1997;16(2):47–57. doi: 10.1109/51.582176. [DOI] [PubMed] [Google Scholar]
- 14.Azeloglu EU, Costa KD. Dynamic AFM elastography reveals phase dependent mechanical heterogeneity of beating cardiac myocytes. Engineering in Medicine and Biology Society, 2009. EMBS’09. 31st Annual International Conference of the IEEE; 2009. pp. 7180–7183. [DOI] [PubMed] [Google Scholar]
- 15.Solon J, Levental I, Sengupta K, Georges PC, Janmey PA. Fibroblast adaptation and stiffness matching to soft elastic substrates. Biophysical journal. 2007;93(12):4453–4461. doi: 10.1529/biophysj.106.101386. [DOI] [PMC free article] [PubMed] [Google Scholar]
- 16.Costa KD. Imaging and probing cell mechanical properties with the atomic force microscope. Methods Mol Biol. 2006;319:331–361. doi: 10.1007/978-1-59259-993-6_17. [DOI] [PubMed] [Google Scholar]
- 17.Langer MG, Koitschev A, Haase H, Rexhausen U, Hörber JKH, Ruppersberg JP. Mechanical stimulation of individual stereocilia of living cochlear hair cells by atomic force microscopy. Ultramicroscopy. 2000;82(1):269–278. doi: 10.1016/s0304-3991(99)00136-9. [DOI] [PubMed] [Google Scholar]
- 18.Charras GT, Lehenkari PP, Horton MA. Atomic force microscopy can be used to mechanically stimulate osteoblasts and evaluate cellular strain distributions. Ultramicroscopy. 2001;86(1):85–95. doi: 10.1016/s0304-3991(00)00076-0. [DOI] [PubMed] [Google Scholar]
- 19.Wang H, Svoronos AA, Boudou T, Sakar MS, Schell JY, Morgan JR, Chen CS, Shenoy VB. Necking and failure of constrained 3D microtissues induced by cellular tension. Proceedings of the National Academy of Sciences. 2013;110(52):20932–20928. doi: 10.1073/pnas.1313662110. [DOI] [PMC free article] [PubMed] [Google Scholar]
- 20.Galie PA, Khalid N, Carnahan KE, Westfall MV, Stegemann JP. Substrate stiffness affects sarcomere and costamere structure and electrophysiological function of isolated adult cardiomyocytes. Cardiovascular Pathology. 2012;22(3):219–227. doi: 10.1016/j.carpath.2012.10.003. [DOI] [PMC free article] [PubMed] [Google Scholar]
- 21.Chopra A, Murray ME, Byfield FJ, Mendez MG, et al. Augmentation of integrin-mediated mechanotransduction by hyaluronic acid. Biomaterials. 2014;35(1):71–82. doi: 10.1016/j.biomaterials.2013.09.066. [DOI] [PMC free article] [PubMed] [Google Scholar]
Associated Data
This section collects any data citations, data availability statements, or supplementary materials included in this article.
Supplementary Materials
Supplementary Figure: A) Image of the AFM in contact with a construct within the TUG system. B) Schematic of Hooke’s Law applied to the cantilever and Hertz’s equation to describe the AFM indentation. C) Because the cantilever and construct are in series, the deformations of each sum to the total ramp size and the force is constant. D) Calculated indentation depth based on three estimated construct elastic moduli. Even for worst case scenario (5 kPa elastic modulus and 3 micron ramp size), the indentation is 80% of the ramp size.


