

Abstract
Typically, the process of NMR-based structure determination relies on accurately measuring a large number of internuclear distances to serve as restraints for simulated annealing calculations. In solids, the rotational-echo double-resonance (REDOR) experiment is a widely used approach to determine heteronuclear dipolar couplings corresponding to distances usually in the range of 1.5–8 Å. A challenge in the interpretation of REDOR data is the degeneracy of symmetric subunits in an oligomer or equivalent molecules in a crystal lattice, which produce REDOR trajectories that depend explicitly on two or more distances instead of one. This degeneracy cannot be overcome by either spin dilution (for molecules containing 31P, 19F and other highly abundant nuclei) or selective pulses (in the case where there is chemical shift degeneracy). For small, crystalline molecules, such as phosphoserine, we demonstrate that as many as five inter-molecular distances must be considered to model 31P-dephased REDOR data accurately. We report excellent agreement between simulation and experiment once lattice couplings, 31P chemical shift anisotropy, and radiofrequency field inhomogeneity are all taken into account. We also discuss the systematic inaccuracies that may result from approximations that consider only the initial slope of the REDOR trajectory and/or that utilize a two- or three-spin system. Furthermore, we demonstrate the applicability of 31P-dephased REDOR for validation or refinement of candidate crystal structures and show that this approach is especially informative for NMR crystallography of 31P-containing molecules.
Keywords: Magic-Angle Spinning, Phosphorus, Phosphoserine, Simulation, Solid-State NMR
Graphical abstract

1. Introduction
Ab initio structure determination of compounds and materials that do not form single crystals highly suitable for diffraction-based approaches remains an outstanding challenge in modern chemistry. Solid-state NMR (SSNMR) has recently emerged as a powerful method that can complement diffraction and computational crystal structure prediction methods to enable validation, refinement, or determination of a structure. Most commonly, density functional theory (DFT) is used to calculate chemical shielding tensors for candidate structures or fragments thereof, which can be related to experimentally-observed isotropic chemical shifts and chemical shift anisotropy (CSA) parameters [1, 2]. For proteins, this approach can be used for structure refinement by computing the CSA parameters as a function of local geometry and then refining the dihedral angles via simulated annealing [3, 4]. For small molecules, usually X-ray powder diffraction (XRPD) data sets are used to determine the unit cell dimensions, and then crystal structures are predicted in order to generate a series of candidate structures, from which the best agreement is identified [5, 6]. The crystal structures of various small compounds have been confirmed or solved de novo by this approach, notably of compounds as large as 422 g/mol [7]. For example, the structure of O-phospho-DL-tyrosine (Figure 1a), previously unknown due to poor diffracting quality, was recently solved using a combination of XRPD and chemical shift measurements and calculations [8].
Figure 1. Applications of 31P-dephased REDOR to structural characterization of phosphorus-containing materials.
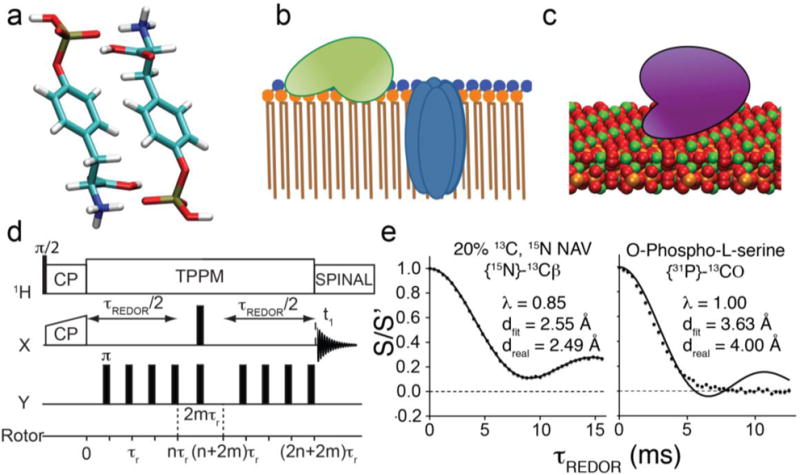
(a–c) Examples of systems that can be characterized using 31P-dephased REDOR: (a) Crystal structure of O-phospho-DL-tyrosine, determined by NMR crystallography. (b) Proteins on the surface of and embedded within a lipid bilayer, composed of lipids with phosphate headgroups. (c) Protein bound to the surface of hydroxyapatite, a mineral composed of inorganic phosphate and calcium. (d) The REDOR pulse sequence, which recouples heteronuclear dipolar couplings with a train of rotor-synchronized π pulses. (e) REDOR trajectories of diluted crystalline N-acetyl-valine (left) and natural-abundance O-phospho-serine (right) with fits to Eq. (1) shown as lines.
In principle, rotational-echo double resonance (REDOR) [9, 10] heteronuclear dipolar coupling measurements could supplement chemical shift calculations by providing distance restraints, which could drive structure generation or quickly screen putative structures. REDOR has been applied to NMR crystallography in a few cases by incorporating 13C and 15N labels [11–13], but widespread application of REDOR is limited by access to appropriately labeled molecules. One potential solution to this issue, for at least a subset of compounds containing 31P and/or 19F, is to measure dipolar couplings between these 100% naturally-abundant isotopes and the lower abundance 13C or 15N by detection of the latter spins. The prevalence of 19F in pharmaceuticals (25% of all FDA-approved drugs in 2011 [14]) and synthetic materials and 31P in many biomolecules (such as phospholipids and phosphorylated proteins) makes this a particularly attractive option. Such 31P or 19F dipolar coupling measurements have previously been applied to determine the structure of fluorinated zeolites [15] and to aid in resonance assignments of phosphorylated amino acids and calcium phosphonates [8, 16].
In contrast to complete structure determination, there are many examples of structural characterization using 31P-dephased REDOR, for systems such as peptides inserted in membranes (Figure 1b) [17–20], proteins bound to the surface of hydroxyapatite (Figure 1c) [21–23], phosphate glasses [24–28], heteropolyacids [29] and phosphate-containing compounds bound to proteins [30–35]. These studies have used REDOR to measure dipolar couplings of 31P to a variety of nuclei including 13C and 15N, as well as 19F and nuclei such as 11B, 17O, 23Na, or 27Al that are commonly found in materials chemistry applications. The extent to which couplings could be quantified depended on the degree of order in the system and the accuracy of the two- or three-spin approximations employed.
The standard REDOR pulse sequence (Figure 1d) uses a rotor-synchronized train of π pulses, typically on the dephasing spin channel, to recouple the heteronuclear dipolar coupling between two nuclei while refocusing chemical shift terms with a Hahn echo on the observed spin [9, 10]. To suppress scalar couplings (most frequently 13C–13C couplings) in uniformly-labeled materials, a J-decoupled REDOR experiment can be used that employs a frequency-selective (FS) spin-echo on the observed spin [36]. A FS-inversion can also be simultaneously applied on the dephasing channel to enable selective recoupling of a single dipolar coupling in the background of other couplings, even significantly stronger ones [37]. However, this requires that the peaks corresponding to the nuclei of interest are resolved, and that identical subunits in an oligomer or a crystal lattice are sufficiently well-separated so that a two-spin approximation can be employed. This is a potential problem for nuclei with high or moderately high gyromagnetic ratios (such as 19F or 31P) since REDOR effects from these spins can be observed for distances of 8 to 10 Å or more, whereas 13C or 15N dephasing is usually evident only to ~5 to 6 Å. The effective volume of the sphere of influence surrounding each dephasing spin is directly proportional to the gyromagnetic ratio, and so, for example, 31P dephasing will impact four times as many nearby spins as 15N dephasing.
Analysis of REDOR data relies on collection of both a dipolar dephasing trajectory (S) and a reference trajectory (S0 or S′) that corrects for relaxation during the REDOR evolution period. The appropriate reference trajectory depends upon the precise type of REDOR experiment being performed. In standard hard π pulse REDOR experiments with hard π pulses used for both dipolar recoupling and refocusing, the reference is obtained by omitting the π pulse trains on the dephasing channel and the result is called S0. In FS-REDOR experiments, Jaroniec et al. found that superior fits were obtained when the reference spectrum omitted only the FS pulse on the dephasing channel, leaving the hard π pulses in place [37]. We refer to this reference spectrum as S′ in order to clearly distinguish it from S0. This S′ reference trajectory accounts for decay of all coherences occupied during the dipolar evolution period, in addition to the T2 relaxation of the observed nucleus. The S′ trajectory experiences additional signal loss (relative to S0), whether FS or hard π refocusing pulses are utilized, and we propose that this more accurately represents the decay of coherences present in the S data set. This protocol appears to be particularly important in cases where multiple spins are involved.
REDOR data can often be well-described by average Hamiltonian theory (AHT) [38], resulting in the expression [39, 40]:
| (1) |
where is the scaled (effective) dipolar coupling between spins I and S, τ is the REDOR evolution time, β and γ are powder angles, and λ is a scaling factor that accounts for imperfect labeling and dilution of labeled compound in natural abundance material (both of which result in observed spins without a corresponding dephasing spin). Eq. (1) predicts a normalized dephasing of S/S′ to −0.0429 (for λ = 1) followed by oscillations around zero. Fitting REDOR data to Eq. (1) can yield distances with accuracy as great as 2% for small molecules with very high sensitivity [37], provided that the isotopically labeled pair is sufficient well-diluted in natural abundance material, to satisfy the approximation of an isolated two-spin system. By contrast, fitting REDOR trajectories derived from non-dilute samples to Eq. (1) often yields poor fits and poor accuracy (Figure 1e). The AHT approach has been extended to account for the effect of finite pulses and fast magic angle spinning (MAS) [39] but has limited accuracy to multi-spin clusters.
To account rigorously for multiple spins as well as experimental imperfections, in this study we perform numerically exact simulations of the REDOR pulse sequence. Generally, this approach is compatible with a variety of spin dynamics software packages such as SIMPSON [41], SPINEVOLUTION [42] or Spinach [43]. The primary advantages to this approach for our purposes are: (1) there are no fundamental limits on the number of spins included in a simulation; (2) the effects of factors such as CSA, finite pulses, and radiofrequency (RF) field (B1) inhomogeneity can be explicitly included; and (3) iterative fitting can be performed at reasonable computational cost. The challenge of this approach is that the output of the multi-spin simulation is not a single coupling or distance for a given REDOR experiment (which could function as a direct experimental restraint for structure determination), but a score relating the postulated structure to the experimentally observed data set. In many circumstances, a single distance restraint is not the appropriate finding, especially in cases where it is impractical or impossible to dilute the NMR-inactive isotope. This is the case for the small crystalline compounds containing 31P that are the subject of the current study. Given the potential applicability to NMR crystallography, we were motivated to develop a framework in which 31P-dephased REDOR data sets for small crystalline compounds could be quantitatively interpreted.
In this paper, we demonstrate that multi-spin simulations excellently reproduce 31P-dephased REDOR data for O-phospho-L-serine and three related compounds, if and only if a sufficient number of couplings are included in the simulations and CSA and RF inhomogeneity are accounted for. Armed with this capability, we demonstrate how 31P-dephased REDOR data can be used to discriminate between different candidate crystal structures or those of related compounds, and discuss how this approach might be applied to NMR crystallography.
2. Experimental
2.1. Sample Preparation
O-Phospho-L-serine was purchased from Sigma Aldrich and recrystallized by vapor diffusion. Approximately 29 mg/ml of compound was dissolved in H2O and acetone was used as the precipitant. The crystal form was confirmed by single crystal diffraction to be identical to that reported in [44] (orthorhombic, P212121, 7.8 × 10.2 × 9.1 Å). Calcium-bound O-phospho-L-serine was prepared by combining O-phospho-L-serine and CaCl2 2H2O in a 1:5 ratio and recrystallizing by slow evaporation of H2O (initial concentration of 10mg/ml) at pH 7.0 (adjusted with Ca(OH)2). The crystal form was confirmed by refinement of the XRPD pattern to be consistent with that reported in [45] (monoclinic, P21, 5.5 × 12.8 × 5.7 Å). O-Phospho-DL-serine was purchased from Sigma Aldrich and recrystallized by slow evaporation of H2O, with an initial concentration of 25 mg/ml. The unit cell parameters were confirmed to be identical as reported in [46] by single crystal diffraction (monoclinic, C2/c, 18.5 × 8.3 × 12.3 Å). O-Phospho-L-threonine was purchased from Sigma Aldrich and recrystallized by vapor diffusion. Approximately 9 mg/ml compound was dissolved in H2O and acetone was used as the precipitant. The crystal form was confirmed by single crystal diffraction to be identical to that reported in [47] (orthorhombic, P212121, 6.7 × 9.9 × 11.8 Å). Re-crystallized samples were ground to a powder with a mortar and pestle and packed into 3.2 mm MAS NMR rotors (Agilent Technologies, Santa Clara, CA, and Loveland, CO, and Revolution NMR, Fort Collins, CO). Samples were centered in rotors with custom-made Kel-F and rubber spacers so that 80% of the total filling volume of the rotor contained sample, corresponding to approximately 80% of the length of the probe coil. O-Phospho-DL-serine was packed in a standard-wall rotor while the rest were packed in thin-wall rotors.
2.2. Solid-State NMR Spectroscopy
All MAS SSNMR experiments were conducted at 14.1 T (600 MHz) on a Varian InfinityPlus (Fort Collins, CO) spectrometer with a 3.2-mm T3 HXY MAS probe tuned to 1H-31P-13C. Spinning was controlled using a Varian MAS controller at 12,500 ± 3 Hz during REDOR experiments and nutation curves, and at 4,000, 5,000, and 5,882 ± 5 Hz (and optionally also 3,033 Hz) for 31P spinning sideband patterns used for 31P CSA determination. Experiments were performed with variable-temperature gas set to 20 °C, resulting in an average sample temperature of 22.4 °C (calibrated using the hydroxyl and methylene proton shifts of ethylene glycol [48]). Experiments all employed tangent ramped cross polarization [49]. TPPM [50] and SPINAL-64 [51] 1H decoupling was used during evolution and acquisition periods, respectively, with a nutation frequency of ~80 kHz. Spectra were externally referenced to adamantane, assuming the downfield peak of 40.48 ppm [52]. All NMR data was processed with Lorenzian-to-Gaussian apodization and zero filling before Fourier transformation. REDOR and nutation data was processed and integrated in Spinsight (Varian), while sideband manifolds were processed using NMRPipe [53] and exported as text files for fitting.
2.3. Spin Dynamics Simulations and Analysis
The Crystallographic Information File (CIF) of the structure of each compound was converted to a crystal lattice.xyz file using VESTA software [54, 55]. These were converted to SPINEVOLUTION [42] coordinates files using a MATLAB (MATLAB 2015a, The MathWorks, Natick, 2014) script that identifies the closest six 31P to a given 13C type in the lattice. SPINEVOLUTION outputs were compared to experimental REDOR data and plotted using Microsoft Excel 2011 (Microsoft Corporation, Redmond, Washington, USA). 31P spinning sideband manifolds were fit [56] using SPINEVOLUTION and plotted using Excel. 31P nutation curves were fit to a binned B1 distribution using the solver function in Excel.
2.4. Candidate Structure Generation
Candidate structures were generated using the software FOX [57]. First, the XRPD pattern of each compound was simulated using the published single crystal X-ray structure. A randomized initial structural model using the published space group and unit cell parameters was then optimized in direct space using the parallel tempering algorithm in FOX. One hundred structures of each compound were generated, of which the top 35 were selected for REDOR simulations. A small number of structures were excluded due to overlap of atoms.
3. Results
To develop of a framework for scoring candidate crystal structures based on 31P-dephased REDOR data, we selected O-phospho-L-serine, its complex with Ca2+, O-phospho-DL-serine, and O-phospho-L-threonine as model compounds (Figure 2). High-quality crystal structures of these compounds have been published (Table 1) [44–47], providing a solid basis for structure-based REDOR simulation. Since the chemical structures of the organic components of these compounds differ at most by a single methyl group, they present an opportunity to test the ability of 31P-dephased REDOR to discriminate among several crystal forms. Each of these contains a beta carbon, two bonds away from a phosphorus atom (thus with an invariant intramolecular C β–P distance of ~2.6 Å), an alpha and a carboxyl carbon, while O-phospho-L-threonine contains one additional carbon, the C γ2 methyl group. Each carbon yields a distinct REDOR trajectory, which can be used to assess a crystal structure independently of the others.
Figure 2.

Chemical structures of compounds investigated in this study, with α, β, and γ carbons specified.
Table 1. Crystal parameters of compounds investigated in this study.
| O-Phospho-L-serine | Ca(II)(O-phospho-L-serine)H2O | (O-Phospho-DL-serine)H2O | O-Phospho-L-threonine | |
|---|---|---|---|---|
| CSD ID | SERPOP01 | TEGLUM | SERIPH10 | POTHRE01 |
| Formula | C3H8NO6P | Ca(C3H6NO6P)(H2O) | C3H8NO6P(H2O) | C4H10NO6P |
| MW (g/mol) | 185.06816 | 241.14556 | 185.06816 | 199.1 |
| T (K) | 283–303 | 296 | 283–303 | 295 |
| Crystal System | Orthorhombic | Monoclinic | Monoclinic | Orthorhombic |
| Space Group | P212121 | P21 | C2/c | P212121 |
| a (Å) | 7.767 | 5.534 | 18.473 | 6.709 |
| b (Å) | 10.167 | 12.759 | 8.327 | 9.854 |
| c (Å) | 9.136 | 5.74 | 12.3 | 11.776 |
| α (deg) | 90 | 90 | 90 | 90 |
| β(deg) | 90 | 104.77 | 120.72 | 90 |
| γ (deg) | 90 | 90 | 90 | 90 |
| V (Å3) | 718.657 | 391.9 | 1626 | 777.9 |
| Z, Z′ | 4, 1 | 2, 1 | 8, 1 | 4, 1 |
| Dc (g/cm3) | 1.709 | 2.044 | 1.661 | 1.7 |
| Crystal size (mm) | 0.2 × 0.2 × 0.4 | 0.2 × 0.1 × 0.005 | 0.15 × 0.15 × 0.5 | 0.35 × 0.15 × 0.15 |
| Crystal Habit | Blocks | Plate | Blocks | Needle |
| Crystal Color | Colorless | Colorless | Colorless | Colorless |
| R-Factor (%) | 2.7 | 2.4 | 3.0 | 2.6 |
To maximize our capacity to quantitatively interpret REDOR trajectories, we examined three factors that we anticipated could influence the data and reduce the accuracy of Eq. (1): B1 inhomogeneity, CSA, and multispin effects. We first considered the case of B1 inhomogeneity. Inhomogeneity of the applied magnetic field is known to reduce the efficiency of dipolar recoupling methods [58, 59] and various solutions have been proposed, including improved probe designs [60], restricting the sample volume to the center portion of the rotor [59] where the applied field is most homogeneous, spatially-selective pulses [61], and simultaneous frequency and amplitude modulation (SFAM) [62], a continuous RF modulation scheme that has comparatively less sensitivity to B1 inhomogeneity. In the present case the probe design being employed has an unbalanced solenoid circuit, and therefore B1 inhomogeneity that is typical of many SSNMR probes. We considered reducing the sample volume to be unsatisfactory for low-sensitivity research samples and therefore not a general solution. Similarly, spatially selective pulses by definition select only a small volume of the rotor, limiting sensitivity; continuous inversion schemes likewise only partially negate the effects of B1 inhomogeneity. Ultimately regardless of the details of probe design, sample volume reduction and/or selective pulses, there will be some remaining B1 inhomogeneity. Therefore, as a general solution to the data analysis problem, we elected to measure the B1 field profile and model the REDOR data as a weighted average of trajectories resulting from a binned distribution of rotor positions. To achieve this, we first measured the solenoid inhomogeneity at the 31P frequency by nutation curves [63] for each sample (Figure 3a). These curves were fit to a binned distribution of five RF fields that followed a truncated cosine bell shape. All four samples yielded essentially identical profiles, so the profile obtained for O-phospho-L-serine was used for all subsequent analysis.
Figure 3. Measurement of B1 field profiles, 31P CSA, and multi-spin effects.
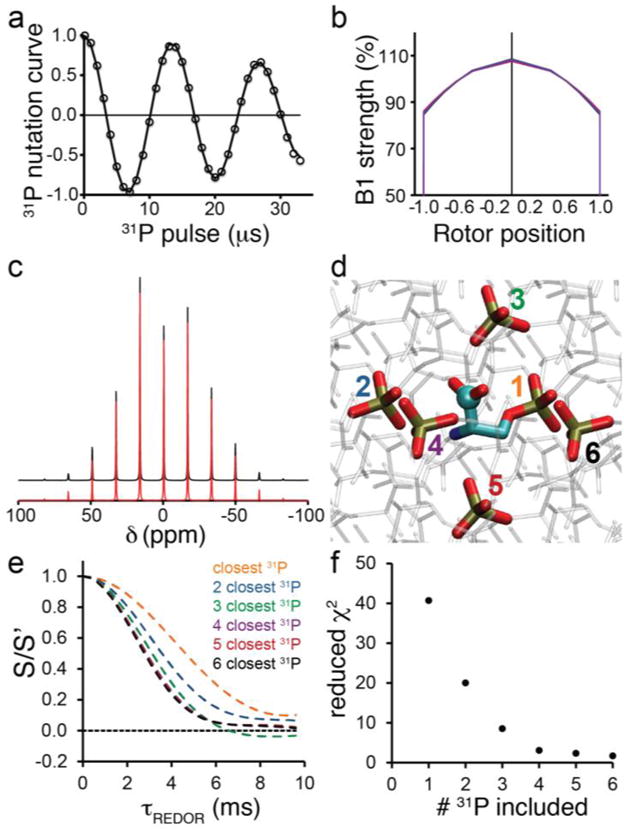
(a) 31P nutation curve of O-phospho-L-serine sample after initial 1H-31P CP. (b) Resultant B1 field profiles for O-phospho-L-serine (black), O-phospho-DL-serine (red), O-phospho-L-serine:Ca2+ (blue) and O-phospho-L-threonine (purple) samples. (c) 31P sideband pattern of O-phospho-L-serine at 4 kHz spinning with vertically-offset fits in red. (d) X-ray structure of the crystal lattice of O-phospho-L-serine, with phosphate groups of six closest 31P nuclei to a given carboxyl carbon emphasized, numbered according to their distance to the carboxyl carbon. (e) Simulated O-phospho-L-serine CO REDOR trajectories including the closest 1, 2, 3, 4, 5, or 6 31P atoms to the CO carbon, as shown in (c). (f) Reduced χ2 between CO REDOR data and simulations as a function of the number of included 31P spins, with RF inhomogeneity and CSA simulated.
Variations in the resonance offset resulting from large CSAs on the dephasing nucleus can scale the amplitude and frequency of oscillations as well as the dephasing amplitude in a REDOR experiment [37]. For CSAs on the order of ≤ 10 kHz (such as for amide 15N at moderate magnetic fields) XY-4 phase cycling can compensate for this. However, a typical 31P CSA is ~ 70 ppm, which at higher fields (600 MHz in the current case, so nearly 20 kHz) our simulations predicted a significant effect on REDOR trajectories. Although it would be possible to remove this factor by, for example, using 31P as the observed spin and dephasing 13C, such an experiment would require selective 13C labeling and eliminate a key advantage of 31P REDOR, that is, the ability to work with natural abundance samples. We therefore measured the reduced anisotropy δ and asymmetry factor η for each sample from the 31P sideband manifolds at 3.030, 4.000, 5.000, and 5.882 kHz MAS (Figure 3c, Figure S1) to input into subsequent REDOR simulations. The values for O-phospho-L- and DL-serine and O-phospho-L-threonine were in good agreement with published values [64], and to our knowledge these measurements have not previously been reported for O-phospho-L-serine:Ca2+ (Table 2).
Table 2.
31P chemical shift anisotropy data.
| |Δδ| (ppm) | η | |
|---|---|---|
| O-Phospho-L-serine | 83 ± 1 | 0.911 ± 0.008 |
| Ca(II)(O-phospho-L-serine)H2O | 102 ± 1 | 0.33 ± 0.3 |
| O-Phospho-DL-serine | 77.7 ± 0.4 | 0.98 ± 0.01 |
| O-Phospho-L-threonine | 105 ± 2 | 0.73 ± 0.02 |
REDOR of systems with multiple dephasing spins is not only complicated by the contributionsof multiple heteronuclear couplings but also is influenced by homonuclear dipoledipole coupling among dephasing spins [65]. Although the simplest way to overcome these complications is to simplify the experimental system to an isolated spin pair, either by sparse/specific isotopic labeling [66–68], dilution of labeled molecules in natural abundance [37], or specific incorporation of fluorinated probes either by attaching through a disulfide linkage [69] or biosynthetically as a non-natural amino acid [70], we were motivated to identify an approach applicable to 31P-dephased REDOR of crystalline compounds, for which these strategies are not an option. Several studies have reported treatments of REDOR dephasing for multispin systems [71–74]. Schaefer and co-workers have derived an equation in terms of a computationally-efficient product of cosine terms, in the case where the homonuclear couplings are sufficiently averaged by motion [71]. Generally, for diverse cases where motion is not present, it is useful to employ numerical simulations, which are robustly accurate and versatile enough to model the homonuclear couplings as well as CSA and RF inhomogeneity effects. The choice of the number of lattice 31P nuclei to include in simulations was informed by preliminary REDOR simulations where the number of included nuclei was increased stepwise until the simulations converged to a trajectory that did not change upon inclusion of additional spins (Figure 3d,e). In general, we found that inclusion of the closest six 31P nuclei was sufficient for the simulations to converge, and additional nuclei did not yield further reduction in the computed χ2 between data and simulation (Figure 3f). We therefore kept the number of 31P nuclei in subsequent simulations fixed at six.
We measured the REDOR trajectories of each carbon for the four samples. A spinning rate of 12.5 kHz and dephasing π pulses of length 8 μs were used in order to limit finite pulse effects(φ = 2 τ p/ τ r = 0.2) [39]. We observed that the trajectories of the alpha and carboxyl carbons (and gamma carbon in case of threonine) damped to zero rather than displaying the oscillations characteristic of REDOR curves, and the beta carbon trajectories exhibited small oscillations.
To ascertain the relative contributions of CSA, B1 inhomogeneity, and multispin effects, we conducted simulations using models of increasing complexity and compared to experimental data (Figure 4). Inclusion of the six closest 31P nuclei (rather than simply the intramolecular 31P) had the dominant effect on the simulations, lowering the χ2 value by at least a factor of two (and as much as ten). Inclusion of the additional couplings resulted in a trajectory that demonstrated marginally more dephasing than observed in the experiment; with the single coupling simulated, dephasing was less than observed experimentally. Next, including CSA improved the fit quality by another factor of up to nine, and at least ~40% in all cases. Finally, inclusion of the B1 inhomogeneity model (as described above) resulted in another factor of almost two to more than ten improvement. The CSA and B1 homogeneity effects both act to reduce the dephasing amplitude, each roughly to the same degree. The final best-fit trajectories are in excellent agreement with the experimental data, with χ2 values ranging from 1.9 to 13 despite the ~100:1 signal-to-noise ratio of the spectra.
Figure 4. Relative contributions of lattice couplings, CSA, and RF inhomogeneity on simulated 31P-dephased REDOR trajectories.
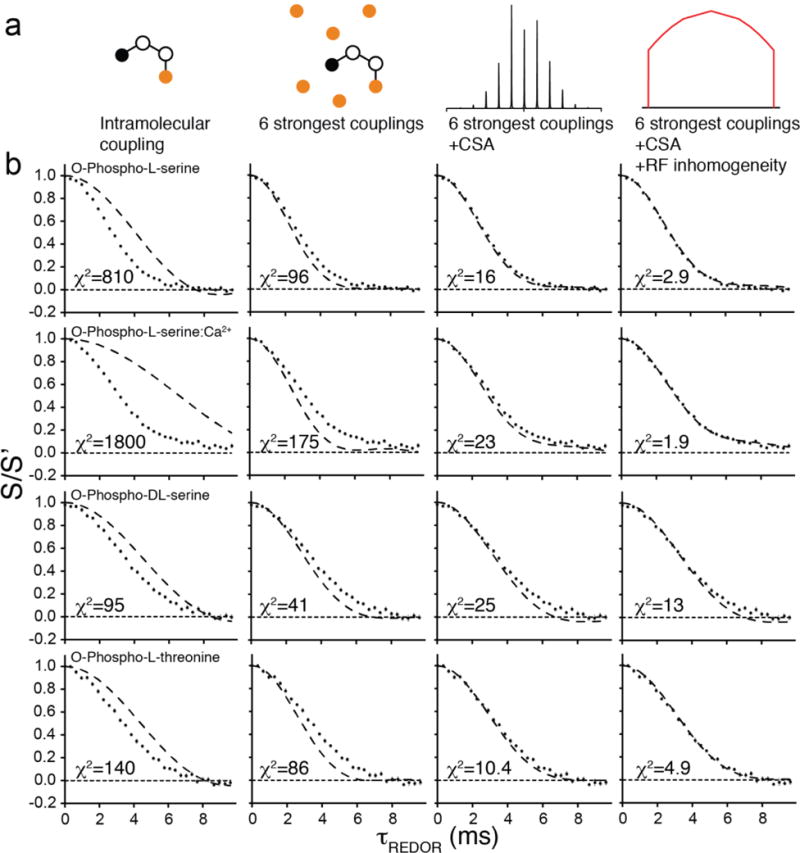
(a) Models of increasing complexity used to simulate REDOR trajectories. (b) Comparison of experimental CO REDOR data (symbols) and simulations (solid lines) using different models specified in (a), on various forms of phosphoserine and phosphothreonine. Error bars are standard error on the mean of either 6 or 8 replicates. Reduced χ2 between data and simulation is shown for each trajectory.
We noted that despite the similarity between the chemical structures of these four compounds, their REDOR trajectories were all distinct from each other (Figure 5), especially for the weaker couplings. We compared the reduced χ2 between data and simulation for each of the four compounds and noted that use of an incorrect structure (one of the other three structures) produced a higher χ2 in each case, and in most cases, it was over an order of magnitude higher. This illustrates the power of REDOR data to discriminate between candidate crystal structures in an NMR crystallography application.
Figure 5. Discrimination between different forms of phosphoserine and phosphothreonine by REDOR trajectories.
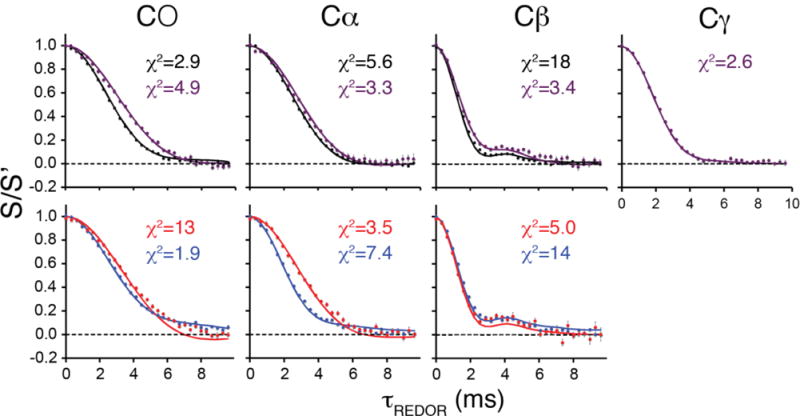
REDOR data (circles) for each carbon of O-phospho-L-serine (black), O-phospho-DL-serine (red), O-phospho-L-serine:Ca2+ (blue) and O-phospho-L-threonine (purple) compared with simulations (solid lines). For the weaker couplings (CO, C α) the REDOR trajectories for each molecule are easily distinguishable from each other and are reproduced well by simulations. Error bars are standard error on the mean of either 6 or 8 replicates. Reduced χ2 between data and simulation is shown for each trajectory.
To further explore the ability of REDOR to discriminate among structures, we generated an ensemble of ~30 candidate structures using the simulated powder pattern, space group and unit cell parameters of each compound. Remarkably, in each case, the lowest average χ2 corresponded to the published structure (Figure 6), and the vast majority of candidate structures yielded χ2 values one or two orders of magnitude higher than the value for the published structure. We noted that in the case of O-phospho-L-threonine, the second-best scoring candidate structure was the closest match to the published structure based on a heavy-atom RMSD from an alignment of their unit cells, and that similarly for O-phospho-L-serine the second-best scoring candidate structure was the second closest match to the published structure. We conclude from this result that iterative structure generation and 31P-dephased REDOR scoring represents a powerful strategy for NMR-based crystal structure determination.
Figure 6. Discrimination between incorrect candidate structures and published structures by REDOR trajectories.
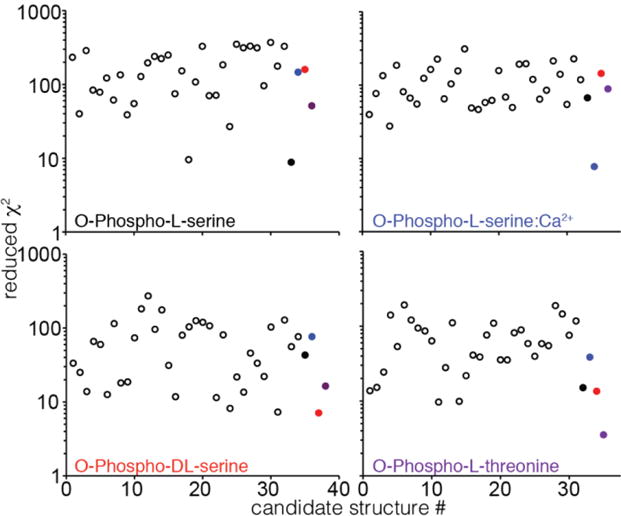
Reduced χ2 between REDOR data and simulation is shown for synthetically generated crystal structures (open circles) and published structures (closed circles, O-phospho-L-serine in black, O-phospho-DL-serine in red, O-phospho-L-serine:Ca2+ in blue, O-phospho-L-threonine in purple). In each case the lowest χ2 corresponds to the published structure.
4. Discussion
For multispin systems, very different geometries (relative orientations) and coupling magnitudes can result in nearly identical REDOR trajectories in the weak-coupling regime, where few if any distinct oscillations are observed. As a result, the accuracy of distance measurements in such systems is limited. If good candidate structures are available, direct comparison with postulated experimental data is likely preferable to direct fitting of a single distance [65]. Direct fitting can yield systematic errors, especially under poorly justified assumptions (such as assuming a two- or three-spin system when additional couplings are not negligible, or neglecting the contributions of CSA). These results may be unique and in good agreement with the trajectories, but nevertheless inaccurate if the underlying assumptions are incorrect. For the molecules studied here, the common practice of fitting the initial behavior of the REDOR trajectories with a two-spin model would have yielded distances in error by up to 1.0 Å or more. For example, in the case of the O-phospho-L-serine:Ca2+ CO data, the two-spin model yields a distance of 3.6 Å, 1.1 Å less than the value known from X-ray diffraction [45]. In this extreme case, the carboxyl carbon is closer to three phosphorus atoms in the crystal lattice than its intramolecular phosphorus. This is a fundamental issue that arises in many molecules containing 31P in densely packed assemblies, such as phospholipids. On the basis of these considerations alone, it would be tempting to conclude that REDOR is a fundamentally impracticable measurement for systems with many dephasing spins, large CSA amplitudes and/or under imperfect experimental conditions (B1 inhomogeneity). On the contrary, we have shown that developing an understanding of these factors can enable quite close agreement between simulation and experiment, even when REDOR trajectories deviate from the form given by Eq. (1) or more general expressions [71].
Applications of the framework developed here beyond NMR crystallography include the study of proteins and peptides bound to the surface of hydroxyapatite [21–23] and the study of proteins and peptides on the surface of or embedded within the lipid bilayer [17–20]. In the case of hydroxyapatite, x-ray and electron microscopy-derived crystal structures are available [75–77], suggesting an approach of REDOR-based scoring of candidate structures docked onto the crystal structure. In the case of lipid bilayers, which are highly dynamic under most circumstances, measurements of parameters such as the area-per-lipid and transverse probability distribution of the phosphate groups are available from x-ray and neutron scattering experiments [78, 79]. These can be used to guide molecular dynamics simulations, which in turn can produce candidate structures to score based on REDOR data. The effects of motion on REDOR dephasing are understood [71] and can be incorporated into the current framework.
We note that in some cases, the first-order effects of supramolecular lattice couplings, RF inhomogeneity and CSA may cancel each other. Although it is plausible that in fortuitous situations (e.g., compounds with higher CSAs or with less relative effects of lattice couplings), these effects might cancel at short time, the absence of observable oscillations after S/S0 reaches a minimum indicates that CSA and/or multi-spin effects are significant. Fitting such a trajectory only from initial rate regime data could lead to inaccurate determination of coupling values. O-Phospho-L-serine is occasionally used as a model compound to test heteronuclear recoupling pulse sequences, but analysis has been limited to the initial rate regime of the beta carbon trajectory [21]; for our conditions, this appears to be a case where these effects cancel each other (Figure S2). Failure to consider these effects could lead to systematic overestimation or underestimation of distances, depending on which effects dominate.
To date there are only a few structures of 31P-containing compounds reported to be solved by NMR crystallography. The structure of O-phospho-DL-tyrosine (Figure 1a) has recently been reported [8]. Likewise, the crystal structures of four phosphonate:Ca2+ phases were recently obtained ab initio using XRPD, SSNMR and chemical shift calculations [16]. In both cases, the compounds are quite comparable to those studied in this work, and it will be interesting to attempt to validate these structures using the approach outlined here.
The key finding in this work is that despite the challenges associated with multispin systems, if REDOR data is appropriately modeled it is possible to discriminate between the published structure and an ensemble of synthetic candidate crystal structures and between related crystalline compounds. The challenge lies chiefly in determining sufficient independent structural information so that REDOR can serve to validate or score existing candidate structures. Given the recent progress in crystal structure prediction methods [80] this approach, and NMR crystallography in general, carries great potential.
Supplementary Material
Highlights.
Quantitative interpretation of 31P-dephased 13C-detected REDOR trajectories
Methods applied to phosphorylated amino acids such as O-phospho-L-serine
Improved REDOR fitting procedure including multi-spin effects, chemical shift anisotropy, and radio-frequency field inhomogeneity
Full protocol enables selection of best structure from candidates
Acknowledgments
We thank Prof. Jim Morrissey, Dr. Yan Wang, and Dr. Taras Pogerelov for helpful discussions and for reading the manuscript. A.I.G. appreciates the support from a Robert and Carolyn Springborn Fellowship. This research was supported by the National Institutes of Health (Grant numbers R01-GM112845, R01-HL103999 and R01-GM123455).
Footnotes
Publisher's Disclaimer: This is a PDF file of an unedited manuscript that has been accepted for publication. As a service to our customers we are providing this early version of the manuscript. The manuscript will undergo copyediting, typesetting, and review of the resulting proof before it is published in its final citable form. Please note that during the production process errors may be discovered which could affect the content, and all legal disclaimers that apply to the journal pertain.
References
- 1.Oldfield E. Quantum chemical studies of protein structure. Philos T R Soc B. 2005;360:1347–1361. doi: 10.1098/rstb.2003.1421. [DOI] [PMC free article] [PubMed] [Google Scholar]
- 2.Sun HH, Sanders LK, Oldfield E. Carbon-13 NMR shielding in the twenty common amino acids: Comparisons with experimental results in proteins. J Am Chem Soc. 2002;124:5486–5495. doi: 10.1021/ja011863a. [DOI] [PubMed] [Google Scholar]
- 3.Wylie BJ, Schwieters CD, Oldfield E, Rienstra CM. Protein Structure Refinement Using C-13 alpha Chemical Shift Tensors. J Am Chem Soc. 2009;131:985–992. doi: 10.1021/ja804041p. [DOI] [PMC free article] [PubMed] [Google Scholar]
- 4.Wylie BJ, Sperling LJ, Nieuwkoop AJ, Franks WT, Oldfield E, Rienstra CM. Ultrahigh resolution protein structures using NMR chemical shift tensors. P Natl Acad Sci USA. 2011;108:16974–16979. doi: 10.1073/pnas.1103728108. [DOI] [PMC free article] [PubMed] [Google Scholar]
- 5.Salager E, Day GM, Stein RS, Pickard CJ, Elena B, Emsley L. Powder Crystallography by Combined Crystal Structure Prediction and High-Resolution H-1 Solid-State NMR Spectroscopy. J Am Chem Soc. 2010;132:2564–+. doi: 10.1021/ja909449k. [DOI] [PubMed] [Google Scholar]
- 6.Salager E, Stein RS, Pickard CJ, Elena B, Emsley L. Powder NMR crystallography of thymol. Phys Chem Chem Phys. 2009;11:2610–2621. doi: 10.1039/b821018g. [DOI] [PubMed] [Google Scholar]
- 7.Baias M, Dumez JN, Svensson PH, Schantz S, Day GM, Emsley L. De Novo Determination of the Crystal Structure of a Large Drug Molecule by Crystal Structure Prediction-Based Powder NMR Crystallography. J Am Chem Soc. 2013;135:17501–17507. doi: 10.1021/ja4088874. [DOI] [PubMed] [Google Scholar]
- 8.Paluch P, Pawlak T, Oszajca M, Lasocha W, Potrzebowski MJ. Fine refinement of solid state structure of racemic form of phospho-tyrosine employing NMR Crystallography approach. Solid State Nucl Mag. 2015;65:2–11. doi: 10.1016/j.ssnmr.2014.08.002. [DOI] [PubMed] [Google Scholar]
- 9.Gullion T, Schaefer J. Detection of Weak Heteronuclear Dipolar Coupling by Rotational-Echo Double-Resonance Nuclear-Magnetic-Resonance. Adv Magn Reson. 1989;13:57–83. [Google Scholar]
- 10.Gullion T, Schaefer J. Rotational-Echo Double-Resonance Nmr. J Magn Reson. 1989;81:196–200. doi: 10.1016/j.jmr.2011.09.003. [DOI] [PubMed] [Google Scholar]
- 11.Macholl S, Borner F, Buntkowsky G. Revealing the configuration and crystal packing of organic compounds by solid-state NMR spectroscopy: Methoxycarbonylurea, a case study. Chem-Eur J. 2004;10:4808–4816. doi: 10.1002/chem.200400191. [DOI] [PubMed] [Google Scholar]
- 12.Macholl S, Tietze D, Buntkowsky G. NMR crystallography of amides, peptides and protein-ligand complexes. Crystengcomm. 2013;15:8627–8638. [Google Scholar]
- 13.Tietze D, Voigt S, Mollenhauer D, Tischler M, Imhof D, Gutmann T, Gonzalez L, Ohlenschlager O, Breitzke H, Gorlach M, Buntkowsky G. Revealing the Position of the Substrate in Nickel Superoxide Dismutase: A Model Study. Angew Chem Int Edit. 2011;50:2946–2950. doi: 10.1002/anie.201005027. [DOI] [PubMed] [Google Scholar]
- 14.Wang J, Sanchez-Rosello M, Acena JL, del Pozo C, Sorochinsky AE, Fustero S, Soloshonok VA, Liu H. Fluorine in Pharmaceutical Industry: Fluorine-Containing Drugs Introduced to the Market in the Last Decade (2001–2011) Chem Rev. 2014;114:2432–2506. doi: 10.1021/cr4002879. [DOI] [PubMed] [Google Scholar]
- 15.Fyfe CA, Brouwer DH, Lewis AR, Villaescusa LA, Morris RE. Combined solid state NMR and X-ray diffraction investigation of the local structure of the five-coordinate silicon in fluoride-containing as-synthesized STF zeolite. J Am Chem Soc. 2002;124:7770–7778. doi: 10.1021/ja012558s. [DOI] [PubMed] [Google Scholar]
- 16.Sene S, Bouchevreau B, Martineau C, Gervais C, Bonhomme C, Gaveau P, Mauri F, Begu S, Mutin PH, Smith ME, Laurencin D. Structural study of calcium phosphonates: a combined synchrotron powder diffraction, solid-state NMR and first-principle calculations approach. Crystengcomm. 2013;15:8763–8775. [Google Scholar]
- 17.Su YC, Doherty T, Waring AJ, Puchala P, Hong M. Roles of Arginine and Lysine Residues in the Translocation of a Cell-Penetrating Peptide from C-13, P-31, and F-19 Solid-State NMR. Biochemistry-Us. 2009;48:4587–4595. doi: 10.1021/bi900080d. [DOI] [PMC free article] [PubMed] [Google Scholar]
- 18.Su YC, Waring AJ, Ruchala P, Hong M. Membrane-Bound Dynamic Structure of an Arginine-Rich Cell-Penetrating Peptide, the Protein Transduction Domain of HIV TAT, from Solid-State NMR. Biochemistry-Us. 2010;49:6009–6020. doi: 10.1021/bi100642n. [DOI] [PMC free article] [PubMed] [Google Scholar]
- 19.Tang M, Waring AJ, Hong M. Phosphate-mediated arginine insertion into lipid membranes and pore formation by a cationic membrane peptide from solid-state NMR. J Am Chem Soc. 2007;129:11438–11446. doi: 10.1021/ja072511s. [DOI] [PubMed] [Google Scholar]
- 20.Toke O, Maloy WL, Kim SJ, Blazyk J, Schaefer J. Secondary structure and lipid contact of a peptide antibiotic in phospholipid Bilayers by REDOR. Biophys J. 2004;87:662–674. doi: 10.1529/biophysj.103.032706. [DOI] [PMC free article] [PubMed] [Google Scholar]
- 21.Jaeger C, Groom NS, Bowe EA, Horner A, Davies ME, Murray RC, Duer MJ. Investigation of the nature of the protein-mineral interface in bone by solid-state NMR. Chem Mater. 2005;17:3059–3061. [Google Scholar]
- 22.Ndao M, Ash JT, Breen NF, Goobes G, Stayton PS, Drobny GP. A C-13{P-31} REDOR NMR Investigation of the Role of Glutamic Acid Residues in Statherin- Hydroxyapatite Recognition. Langmuir. 2009;25:12136–12143. doi: 10.1021/la901647n. [DOI] [PMC free article] [PubMed] [Google Scholar]
- 23.Ndao M, Ash JT, Stayton PS, Drobny GP. The role of basic amino acids in the molecular recognition of hydroxyapatite by statherin using solid state NMR. Surf Sci. 2010;604:L39–L42. doi: 10.1016/j.susc.2010.02.026. [DOI] [PMC free article] [PubMed] [Google Scholar]
- 24.Chan JCC, Eckert H. Dipolar coupling information in multispin systems: Application of a compensated REDOR NMR approach to inorganic phosphates. J Magn Reson. 2000;147:170–178. doi: 10.1006/jmre.2000.2191. [DOI] [PubMed] [Google Scholar]
- 25.Eckert H. Short and Medium Range Order in Ion-Conducting Glasses Studied by Modern Solid State NMR Techniques. Z Phys Chem. 2010;224:1591–1653. [Google Scholar]
- 26.Elbers S, Strojek W, Koudelka L, Eckert H. Site connectivities in silver borophosphate glasses: new results from B-11{P-31} and P-31{B-11} rotational echo double resonance NMR spectroscopy. Solid State Nucl Mag. 2005;27:65–76. doi: 10.1016/j.ssnmr.2004.08.007. [DOI] [PubMed] [Google Scholar]
- 27.Strojek W, Kalwei M, Eckert H. Dipolar NMR strategies for multispin systems involving quadrupolar nuclei: P-31{Na-23} rotational echo double resonance (REDOR) of crystalline sodium phosphates and phosphate glasses. J Phys Chem B. 2004;108:7061–7073. [Google Scholar]
- 28.Zeyer M, Montagne L, Jaeger C. Measuring oxygen-phosphorus distances and the orientation of electric field gradient tensors using O-17{P-13} REDOR in phosphate glasses. Solid State Nucl Mag. 2003;23:136–144. doi: 10.1016/S0926-2040(03)00012-2. [DOI] [PubMed] [Google Scholar]
- 29.Ganapathy S, Fournier M, Paul JF, Delevoye L, Guelton M, Amoureux JP. Location of protons in anhydrous Keggin heteropolyacids H3PMo12O40 and H3PW12O40 by H-1{P-31}/P-31{H-1} REDOR NMR and DFT quantum chemical calculations. J Am Chem Soc. 2002;124:7821–7828. doi: 10.1021/ja017848n. [DOI] [PubMed] [Google Scholar]
- 30.Kaustov L, Kababya S, Belakhov V, Baasov T, Shoham Y, Schmidt A. Inhibition mode of a bisubstrate inhibitor of KDO8P synthase: A frequency-selective REDOR solid-state and solution NMR characterization. J Am Chem Soc. 2003;125:4662–4669. doi: 10.1021/ja028688y. [DOI] [PubMed] [Google Scholar]
- 31.Kaustov L, Kababya S, Du SC, Baasov T, Gropper S, Shoham Y, Schmidt A. Structural and mechanistic investigation of 3-deoxy-D-manno-octulosonate-8-phosphate synthase by solid-state REDOR NMR. Biochemistry-Us. 2000;39:14865–14876. doi: 10.1021/bi0017172. [DOI] [PubMed] [Google Scholar]
- 32.Li Y, Appleyard RJ, Shuttleworth WA, Evans JNS. Time-Resolved Solid-State Redor Nmr Measurements on 5-Enolpyruvylshikimate 3-Phosphate Synthase. J Am Chem Soc. 1994;116:10799–10800. [Google Scholar]
- 33.McDowell LM, Poliks B, Studelska DR, O’Connor RD, Beusen DD, Schaefer J. Rotational-echo double-resonance NMR-restrained model of the ternary complex of 5-enolpyruvylshikimate-3-phosphate synthase. J Biomol Nmr. 2004;28:11–29. doi: 10.1023/B:JNMR.0000012864.70184.48. [DOI] [PubMed] [Google Scholar]
- 34.McDowell LM, Studelska DR, Poliks B, O’Connor RD, Schaefer J. Characterization of the complex of a trifluoromethyl-substituted shikimate-based bisubstrate inhibitor and 5-enolpyruvylshikimate-3-phosphate synthase by REDOR NMR. Biochemistry-Us. 2004;43:6606–6611. doi: 10.1021/bi049685w. [DOI] [PubMed] [Google Scholar]
- 35.Yu TY, O’Connor RD, Sivertsen AC, Chiauzzi C, Poliks B, Fischer M, Bacher A, Haase I, Cushman M, Schaefer J. N-15{P-31} REDOR NMR Studies of the Binding of Phosphonate Reaction Intermediate Analogues to Saccharomyces cerevisiae Lumazine Synthase. Biochemistry-Us. 2008;47:13942–13951. doi: 10.1021/bi8015789. [DOI] [PMC free article] [PubMed] [Google Scholar]
- 36.Jaroniec CP, Tounge BA, Rienstra CM, Herzfeld J, Griffin RG. Measurement of C-13-N-15 distances in uniformly C-13 labeled biomolecules: J-decoupled REDOR. J Am Chem Soc. 1999;121:10237–10238. [Google Scholar]
- 37.Jaroniec CP, Tounge BA, Herzfeld J, Griffin RG. Frequency selective heteronuclear dipolar recoupling in rotating solids: Accurate C-13-N-15 distance measurements in uniformly C-13,N-15-labeled peptides. J Am Chem Soc. 2001;123:3507–3519. doi: 10.1021/ja003266e. [DOI] [PubMed] [Google Scholar]
- 38.Haeberlen U, Waugh JS. Coherent Averaging Effects in Magnetic Resonance. Phys Rev. 1968;175:453–+. [Google Scholar]
- 39.Jaroniec CP, Tounge BA, Rienstra CM, Herzfeld J, Griffin RG. Recoupling of heteronuclear dipolar interactions with rotational-echo double-resonance at high magic-angle spinning frequencies. J Magn Reson. 2000;146:132–139. doi: 10.1006/jmre.2000.2128. [DOI] [PubMed] [Google Scholar]
- 40.Mueller KT. Analytic Solutions for the Time Evolution of Dipolar-Dephasing Nmr Signals. J Magn Reson Ser A. 1995;113:81–93. [Google Scholar]
- 41.Bak M, Rasmussen JT, Nielsen NC. SIMPSON: A general simulation program for solid-state NMR spectroscopy. J Magn Reson. 2000;147:296–330. doi: 10.1006/jmre.2000.2179. [DOI] [PubMed] [Google Scholar]
- 42.Veshtort M, Griffin RG. SPINEVOLUTION: A powerful tool for the simulation of solid and liquid state NMR experiments. J Magn Reson. 2006;178:248–282. doi: 10.1016/j.jmr.2005.07.018. [DOI] [PubMed] [Google Scholar]
- 43.Hogben HJ, Krzystyniak M, Charnock GTP, Hore PJ, Kuprov I. Spinach - A software library for simulation of spin dynamics in large spin systems. J Magn Reson. 2011;208:179–194. doi: 10.1016/j.jmr.2010.11.008. [DOI] [PubMed] [Google Scholar]
- 44.Sundaral M, Putkey EF. Molecular Structures of Amino Acids and Peptides.2. A Redetermination of Crystal Structure of L-O-Serine Phosphate - a Very Short Phosphate-Carboxyl Hydrogen Bond. Acta Crystall B-Stru, B. 1970;26:790–&. doi: 10.1107/s0567740870003138. [DOI] [PubMed] [Google Scholar]
- 45.Suga T, Okabe N. Aqua(L-O-serine phosphato)calcium(II) Acta Crystallogr C. 1996;52:1894–1896. [Google Scholar]
- 46.Putkey E, Sundaral M. Molecular Structures of Amino Acids and Peptides.1. Crystal Structure and Conformation of Dl-O-Serine Phosphate Monohydrate - Very Short Phosphate-Phosphate Hydrogen Bonds. Acta Crystall B-Stru, B. 1970;26:782–&. doi: 10.1107/s0567740870003126. [DOI] [PubMed] [Google Scholar]
- 47.Maniukiewicz W, Kwiatkowski W, Blessing RH. O-phospho-DL-threonine and O-phospho-L-threonine compared with their serine analogs. Acta Crystallogr C. 1996;52:1736–1741. doi: 10.1107/s0108270195015708. [DOI] [PubMed] [Google Scholar]
- 48.Ammann C, Meier P, Merbach AE. A Simple Multi-Nuclear Nmr Thermometer. J Magn Reson. 1982;46:319–321. [Google Scholar]
- 49.Metz G, Wu XL, Smith SO. Ramped-Amplitude Cross-Polarization in Magic-Angle-Spinning Nmr. J Magn Reson Ser A. 1994;110:219–227. [Google Scholar]
- 50.Bennett AE, Rienstra CM, Auger M, Lakshmi KV, Griffin RG. Heteronuclear Decoupling in Rotating Solids. J Chem Phys. 1995;103:6951–6958. [Google Scholar]
- 51.Fung BM, Khitrin AK, Ermolaev K. An improved broadband decoupling sequence for liquid crystals and solids. J Magn Reson. 2000;142:97–101. doi: 10.1006/jmre.1999.1896. [DOI] [PubMed] [Google Scholar]
- 52.Morcombe CR, Zilm KW. Chemical shift referencing in MAS solid state NMR. J Magn Reson. 2003;162:479–486. doi: 10.1016/s1090-7807(03)00082-x. [DOI] [PubMed] [Google Scholar]
- 53.Delaglio F, Grzesiek S, Vuister GW, Zhu G, Pfeifer J, Bax A. Nmrpipe - a Multidimensional Spectral Processing System Based on Unix Pipes. J Biomol Nmr. 1995;6:277–293. doi: 10.1007/BF00197809. [DOI] [PubMed] [Google Scholar]
- 54.Momma K, Izumi F. VESTA: a three-dimensional visualization system for electronic and structural analysis. J Appl Crystallogr. 2008;41:653–658. [Google Scholar]
- 55.Momma K, Izumi F. VESTA 3 for three-dimensional visualization of crystal, volumetric and morphology data. J Appl Crystallogr. 2011;44:1272–1276. [Google Scholar]
- 56.Herzfeld J, Berger AE. Sideband Intensities in Nmr-Spectra of Samples Spinning at the Magic Angle. J Chem Phys. 1980;73:6021–6030. [Google Scholar]
- 57.Favre-Nicolin V, Cerny R. FOX, ‘free objects for crystallography’: a modular approach to ab initio structure determination from powder diffraction. J Appl Crystallogr. 2002;35:734–743. [Google Scholar]
- 58.Horne D, Kendrick RD, Yannoni CS. Bond Length Measurements in Amorphous Solids by Nutation Nmr-Spectroscopy - the Role of Rf Field Homogeneity. J Magn Reson. 1983;52:299–304. [Google Scholar]
- 59.Naito A, Nishimura K, Kimura S, Tuzi S, Aida M, Yasuoka N, Saito H. Determination of the three-dimensional structure of a new crystalline form of N-acetyl-Pro-Gly-Phe as revealed by C-13 REDOR, X-ray diffraction, and molecular dynamics calculation. J Phys Chem-Us. 1996;100:14995–15004. [Google Scholar]
- 60.Stringer JA, Bronnimann CE, Mullen CG, Zhou DHH, Stellfox SA, Li Y, Williams EH, Rienstra CM. Reduction of RF-induced sample heating with a scroll coil resonator structure for solid-state NMR probes. J Magn Reson. 2005;173:40–48. doi: 10.1016/j.jmr.2004.11.015. [DOI] [PubMed] [Google Scholar]
- 61.Bax A. A Spatially Selective Composite 90-Degrees Radiofrequency Pulse. J Magn Reson. 1985;65:142–145. [Google Scholar]
- 62.Nishimura K, Fu RQ, Cross TA. The effect of RF inhomogeneity on heteronuclear dipolar recoupling in solid state NMR: Practical performance of SFAM and REDOR. J Magn Reson. 2001;152:227–233. [Google Scholar]
- 63.Bax A. Two-dimensional nuclear magnetic resonance in liquids. Delft University Press; D Reidel Pub Co.; Delft, Holland Dordrecht, Holland; Boston Hingham, MA: 1982. Sold and distributed in the U.S.A and Canada by Kluwer Boston. [Google Scholar]
- 64.Potrzebowski MJ, Assfeld X, Ganicz K, Olejniczak S, Cartier A, Gardiennet C, Tekely P. An experimental and theoretical study of the C-13 and P-31 chemical shielding tensors in solid O-phosphorylated amino acids. J Am Chem Soc. 2003;125:4223–4232. doi: 10.1021/ja029840z. [DOI] [PubMed] [Google Scholar]
- 65.Fyfe CA, Lewis AR. Investigation of the viability of solid-state NMR distance determinations in multiple spin systems of unknown structure. J Phys Chem B. 2000;104:48–55. [Google Scholar]
- 66.Mani R, Tang M, Wu X, Buffy JJ, Waring AJ, Sherman MA, Hong M. Membrane-bound dimer structure of a beta-hairpin antimicrobial peptide from rotational-echo double-resonance solid-state NMR. Biochemistry-Us. 2006;45:8341–8349. doi: 10.1021/bi060305b. [DOI] [PubMed] [Google Scholar]
- 67.Kandasamy SK, Lee DK, Nanga RP, Xu J, Santos JS, Larson RG, Ramamoorthy A. Solid-state NMR and molecular dynamics simulations reveal the oligomeric ion-channels of TM2-GABA(A) stabilized by intermolecular hydrogen bonding. Biochim Biophys Acta. 2009;1788:686–695. doi: 10.1016/j.bbamem.2008.11.009. [DOI] [PubMed] [Google Scholar]
- 68.Liu W, Fei JZ, Kawakami T, Smith SO. Structural constraints on the transmembrane and juxtamembrane regions of the phospholamban pentamer in membrane bilayers: Gln29 and Leu52. Biochim Biophys Acta. 2007;1768:2971–2978. doi: 10.1016/j.bbamem.2007.10.011. [DOI] [PMC free article] [PubMed] [Google Scholar]
- 69.Getmanova E, Patel AB, Klein-Seetharaman J, Loewen MC, Reeves PJ, Friedman N, Sheves M, Smith SO, Khorana HG. NMR spectroscopy of phosphorylated wild-type rhodopsin: mobility of the phosphorylated C-terminus of rhodopsin in the dark and upon light activation. Biochemistry-Us. 2004;43:1126–1133. doi: 10.1021/bi030120u. [DOI] [PubMed] [Google Scholar]
- 70.Graesser DT, Wylie BJ, Nieuwkoop AJ, Franks WT, Rienstra CM. Long-range 19F-15N distance measurements in highly-13C, 15N-enriched solid proteins with 19F-dephased REDOR shift (FRESH) spectroscopy. Magn Reson Chem. 2007;45(Suppl 1):S129–134. doi: 10.1002/mrc.2126. [DOI] [PubMed] [Google Scholar]
- 71.Goetz JM, Schaefer J. REDOR dephasing by multiple spins in the presence of molecular motion. J Magn Reson. 1997;127:147–154. doi: 10.1006/jmre.1997.1198. [DOI] [PubMed] [Google Scholar]
- 72.Mueller LJ, Elliott DW. Correlated tensor interactions and rotational-echo double resonance of spin clusters. J Chem Phys. 2003;118:8873–8881. [Google Scholar]
- 73.Vogt FG, Gibson JM, Mattingly SM, Mueller KT. Determination of molecular geometry in solid-state NMR: Rotational-echo double resonance of three-spin systems. J Phys Chem B. 2003;107:1272–1283. [Google Scholar]
- 74.Arshava B, Breslav M, Antohi O, Stark RE, Garbow JR, Becker JM, Naider F. Long-distance rotational echo double resonance measurements for the determination of secondary structure and conformational heterogeneity in peptides. Solid State Nucl Mag. 1999;14:117–136. doi: 10.1016/s0926-2040(99)00018-1. [DOI] [PubMed] [Google Scholar]
- 75.Ivanova TI, Frank-Kamenetskaya OV, Kol’tsov AB, Ugolkov VL. Crystal structure of calcium-deficient carbonated hydroxyapatite. Thermal decomposition, J Solid State Chem. 2001;160:340–349. [Google Scholar]
- 76.Kay MI, Young RA, Posner AS. Crystal Structure of Hydroxyapatite. Nature. 1964;204:1050–&. doi: 10.1038/2041050a0. [DOI] [PubMed] [Google Scholar]
- 77.Sato K, Kogure T, Iwai H, Tanaka J. Atomic-scale {1010} interfacial structure in hydroxyapatite determined by high-resolution transmission electron microscopy. J Am Ceram Soc. 2002;85:3054–3058. [Google Scholar]
- 78.Kucerka N, Nagle JF, Sachs JN, Feller SE, Pencer J, Jackson A, Katsaras J. Lipid bilayer structure determined by the simultaneous analysis of neutron and x-ray scattering data. Biophys J. 2008;95:2356–2367. doi: 10.1529/biophysj.108.132662. [DOI] [PMC free article] [PubMed] [Google Scholar]
- 79.Nagle JF, Tristram-Nagle S. Structure of lipid bilayers. Bba-Rev Biomembranes. 2000;1469:159–195. doi: 10.1016/s0304-4157(00)00016-2. [DOI] [PMC free article] [PubMed] [Google Scholar]
- 80.Reilly AM, Cooper RI, Adjiman CS, Bhattacharya S, Boese AD, Brandenburg JG, Bygrave PJ, Bylsma R, Campbell JE, Car R, Case DH, Chadha R, Cole JC, Cosburn K, Cuppen HM, Curtis F, Day GM, DiStasio RA, Dzyabchenko A, van Eijck BP, Elking DM, van den Ende JA, Facelli JC, Ferraro MB, Fusti-Molnar L, Gatsiou CA, Gee TS, de Gelder R, Ghiringhelli LM, Goto H, Grimme S, Guo R, Hofmann DWM, Hoja J, Hylton RK, Iuzzolino L, Jankiewicz W, de Jong DT, Kendrick J, de Klerk NJJ, Ko HY, Kuleshova LN, Li XY, Lohani S, Leusen FJJ, Lund AM, Lv J, Ma YM, Marom N, Masunov AE, McCabe P, McMahon DP, Meekes H, Metz MP, Misquitta AJ, Mohamed S, Monserrat B, Needs RJ, Neumann MA, Nyman J, Obata S, Oberhofer H, Oganov AR, Orendt AM, Pagola GI, Pantelides CC, Pickard CJ, Podeszwa R, Price LS, Price SL, Pulido A, Read MG, Reuter K, Schneider E, Schober C, Shields GP, Singh P, Sugden IJ, Szalewicz K, Taylor CR, Tkatchenko A, Tuckerman ME, Vacarro F, Vasileiadis M, Vazquez-Mayagoitia A, Vogt L, Wang YC, Watson RE, de Wijs GA, Yang J, Zhu Q, Groom CR. Report on the sixth blind test of organic crystal structure prediction methods. Acta Crystallogr B. 2016;72:439–459. doi: 10.1107/S2052520616007447. [DOI] [PMC free article] [PubMed] [Google Scholar]
Associated Data
This section collects any data citations, data availability statements, or supplementary materials included in this article.