Abstract
An automated patient-specific system to classify the level of sedation in ICU patients using heart rate variability signal is presented in this paper. ECG from 70 mechanically ventilated adult patients with administered sedatives in an ICU setting were used to develop a support vector machine based system for sedation depth monitoring using several heart rate variability measures. A leave-one-subject-out cross validation was used for classifier training and performance evaluations. The proposed patient-specific system provided a sensitivity, specificity and an AUC of 64%, 84.8% and 0.72, respectively. It is hoped that with the help of additional physiological signals the proposed patient-specific sedation level prediction system could lead to a fully automated multimodal system to assist clinical staff in ICUs to interpret the sedation level of the patient.
I. INTRODUCTION
Accurate assessment of the level of consciousness in critically ill mechanically ventilated patients in the intensive care unit (ICU) is important. Patients are often sedated to relieve stress, prevent injuries and to facilitate ventilation and analgesia [1]. Controlling depth of sedation is essential since both over- and under sedation could result in adverse patient outcomes. Currently clinicians rely on several scoring systems to assess patients level of sedation and sometimes the clinicians find it difficult to come to a conclusion using the scoring system. In addition, these scoring systems are highly subjective, rely on the experience and clinical observation and may not always be feasible to accurately assess depth of sedation [2]. This limitation may increase/decrease the amount of sedatives used. Therefore a physiologically-based continuous sedation monitoring system is essential.
Several electroencephalogram (EEG) based monitors are used to assess the level of sedation during general anesthesia [3], [4]. These monitors are currently used during surgical procedures and their performance in monitoring level of sedation in ICU patients is not well known and may be unreliable to distinguish between light and deep sedation levels [5]. However, little or no attention has been given to the development of a non-EEG based monitors and very few studies have tried to explore the potential of electrocardiogram (ECG) to assess levels of sedation [6].
The ECG is routinely recorded and readily available in the ICU to monitor the cardiovascular function of the patients. It is also shown that the heart rate variability (HRV) is systematically related to level of consciousness and can be used to analyze the autonomic nervous system (ANS) function [7], [8]. However, HRV is still not widely used to assess sedation levels in clinical environments and remains primarily a research methodology.
In this paper, we propose a novel patient-specific system using HRV and support vector machine (SVM) to classify level of sedation. The proposed patient-specific system was rigorously tested and validated on a large ICU database and we hope that the proposed system will provide a reference for developing HRV based sedation level assessment monitors.
II. Method
A. Dataset
We used ECG data from 70 patients (43 males; 27 females) in this study. GE bedside patient monitors and BedMaster (Excel Medical Electronics, Jupiter FL, USA) software was used to record the ECG data at a sampling frequency of 240 Hz. All recordings took place in several ICUs at Massachusetts General Hospital (MGH), Boston, USA under a protocol approved by the local IRB. The demographic characteristics of the patients used in this study is given in Table I.
TABLE I.
Summary of patient demographics presented as minimum, maximum, mean standard deviation.
| Variable | Min | Max | mean ± SD |
|---|---|---|---|
|
| |||
| Age | 20 | 86 | 58.7 ± 15.2 |
| Weight (kg) | 67 | 126 | 97.4 ± 6.2 |
| No. of days in ICU | 1.5 | 36 | 13.1 ± 8.2 |
| No. of drugs | 1 | 18 | 5.5 ± 3.2 |
B. Sedation assessment
The Richmond agitation-sedation scale (RASS) was used to score patient sedation levels shown in Table II which ranges from −5 (deeply sedated/completely unresponsive) to +5 (agitated/violent) with 0 being normal/calm state [9]. RASS assessments were performed by ICU nurses as a part of routine care and trained clinical research staff as part of the research protocol in approximately 2-hour increments. In this study, we performed a binary classification between two RASS groups: nonsedated [0, −1] versus sedated [−4, −5] that are well separated in terms of patients sedation levels. We grouped this to determine if the combination of a number of HRV features could be used to obtain patient’s level of sedation.
TABLE II.
The Richmond Agitation-Sedation Scale (RASS)[9] used for sedation assessment.
| Score | Term | Description |
|---|---|---|
|
| ||
| +4 | Combative | Combative, violent, danger to staff |
| +3 | Very agitated | Pulls or removes tube(s); aggressive |
| +2 | Agitated | Fights ventilator |
| +1 | Restless | Anxious but aggressive |
| 0 | Alert and calm | |
| −1 | Drowsy | Awakens to voice (eye opening > 10s) |
| −2 | Light sedation | Awakens to voice (eye opening < 10s) |
| −3 | Moderate sedation | Movement or eye opening to voice (but no eye contact) |
| −4 | Deep sedation | No response to voice, moves or opens eyes to physical stimulation |
| −5 | Unarousable | No response to voice or physical stimulation |
III. Sedation level classification system
Figure 1 shows an overview of the proposed automatic sedation level classification system. HRV signal is initially obtained from the raw ECG and later processed to remove artifacts. The clean HRV signal is then segmented into short duration epochs and several features are then extracted. Principal component analysis (PCA) was used to reduce the dimensions of the feature set and then fed to the multiclass SVM classifier. The output of the classifier is the predicted sedation level. Details of each step in the proposed classification system is described below:
Fig. 1.
Illustration of the proposed automatic sedation classification system.
A. Artifact reduction
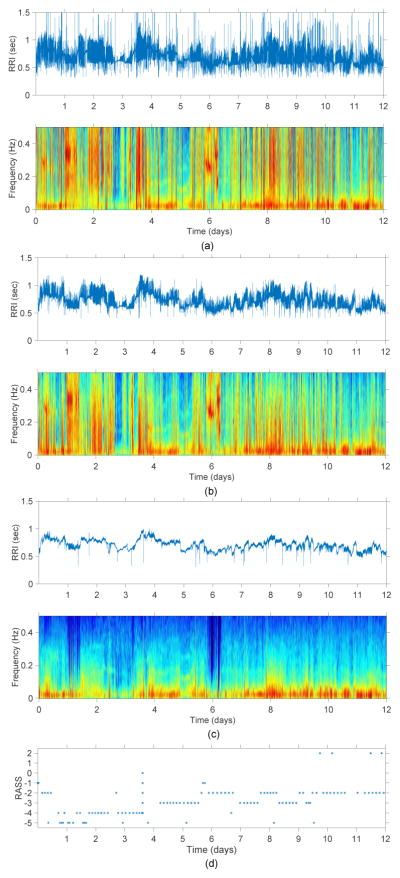
The ECG signal was segmented into short duration epochs (dur−) and the Pan-Tompkins algorithm was used to obtain the RR intervals (RRI) from the ECG signal [10]. Using a threshold based method proposed by Clifford et al. abnormal ectopic beats were removed [11]. Though the percentage of artifacts reduced significantly (see Figure 2b) by using this method regular peaks were still present due to the effect of mechanical ventilation. In order to remove these artifacts, we propose a novel threshold rejection method on the basis of the interquartile range similar to the method described in [12]. The differences between adjacent RRI (RRIdiff) were initially obtained and the inter-quartile range of the absolute value of RRIdiff was measured. The outliers above a set threshold of 98% quartile were identified as artifacts which were discarded and the missing samples were later adjusted using a linear interpolation (see Figure 2c). After pre-processing, we regarded the cleaned and interpolated RRI as normalized RRI (NN interval).
Fig. 2.
Example of a (a) raw RRI signal and its corresponding spectrogram, (b) artifact reduced RRI signal using threshold method [11] and its corresponding spectrogram, (c) RRI signal after removing mechanical ventilator artifacts using the proposed threshold rejection method and its corresponding spectrogram, and (d) RASS scores for one of the patients included in this study.
B. HRV feature extraction
Due to the novelty of the research area, a large set of features (31 features) were extracted from the NN interval (summarized in Table III) which were selected from previous studies in adults [13], [14]. PCA was used to reduce the dimension of the feature space to identify optimal subset of features, while retaining 98% of the energy. These features were then normalized to have uniform mean and standard deviation before feeding it to the SVM classifier for classification.
TABLE III.
List of HRV features used in this work for estimating sedation level.
| Domain | Features |
|---|---|
| Time | Maximum, minimum, mean, median of NN, Standard deviation of NN (SDNN), percentage of consecutive NNs that vary by 5, 10, 15, 20, 25, 30 ms (pNNx), Root mean square of SDNN (RMSDD), mean heart rate (MHR), Standard deviation of heart rate (SDHR), HRV triangular index, coefficient of variation, Max change in NN (MCNN), Mean of the absolute value of first derivative of NN (MAFDNN), Nonlinear energy, Line length. |
| Frequency | PVLF-Power in very low frequency spectrum (0.003–0.04 Hz), PLF-Power in low frequency spectrum (0.04–0.15Hz), PHF-Power in high frequency spectrum (0.15–0.4 Hz) PLF/PHF, PLF/PTOT × 100, PTOT is the total power spectrum PHF/PTOT × 100. |
| Nonlinear | Poincare plot measures (SD1, SD2). |
| Complexity | Shannon entropy, Spectral entropy, Kolmogorov complexity. |
C. Classification
A leave-one-subject-out (LOSO) cross validation was used to test the performance of the proposed classification system as it results in an unbiased estimation of the true generalization error. In each iteration of the LOSO, 69 patients data were used for training the SVM model and the remaining patients data was used for testing. This process was repeated until each patients data was used for testing.
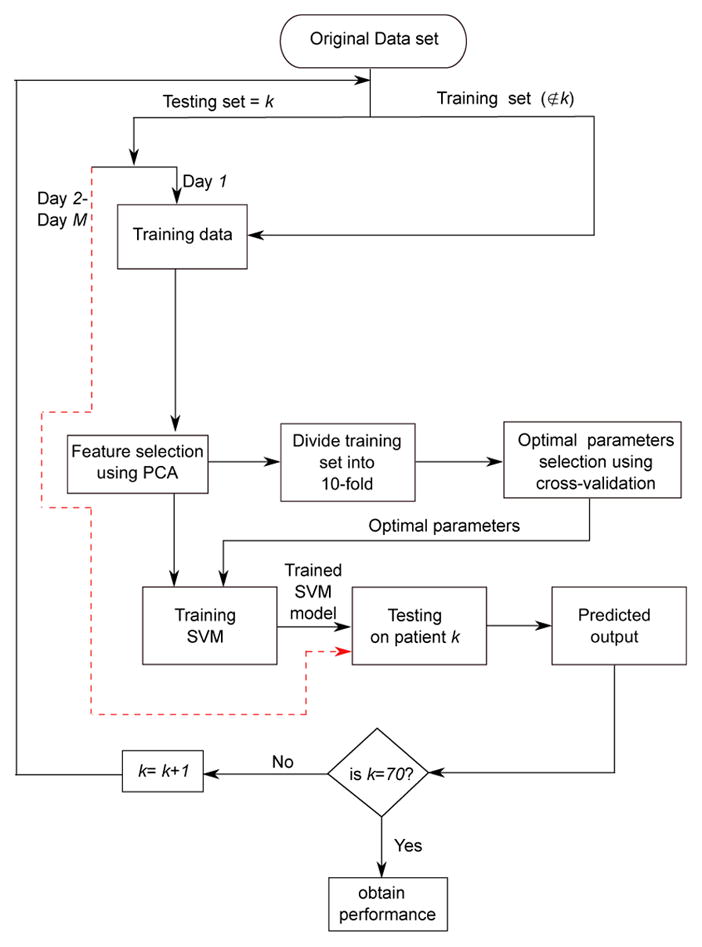
Initially, a training set was obtained by leaving out a single subject from the database. This resulted in a split of 69:1 between training and testing set. First 24 hours data (day 1) from the testing set was used in the training process and the remaining data (day 2 to day M, where M is the total no. of days in the ICU) was used for testing. In this way the classifier becomes calibrated for the patient under consideration and provide patient-specific classification of sedation levels. Multiclass SVM with Gaussian (or radial basis function) kernel was used in this study for classification. The kernel parameters kernel width σ and the regularization constant C were varied in the range [2−4, 2−3, …, 212] and [2−5, 2−4, , 28] respectively. The duration (dur−) of the NN interval window preceding the RASS assessment required to compute HRV features was varied over the range [5,30] minutes in steps of 5 minutes.
A 10-fold cross validation method applied to a training set of 69 patients was used for SVM model selection. The parameters [dur−, σ, C] with highest classification accuracy in the cross validation loop were selected to obtain the optimal parameter set which were then used to train the final SVM model to test the left-out patient. This validation method resulted in a total of 70 iterations. The LIBSVM software package was used to implement the SVM algorithm [15]. Figure 3 demonstrates this process using a LOSO cross-validation system.
Fig. 3.

Performance evaluation of the proposed patient-specific automatic sedation level classification system.
IV. Results
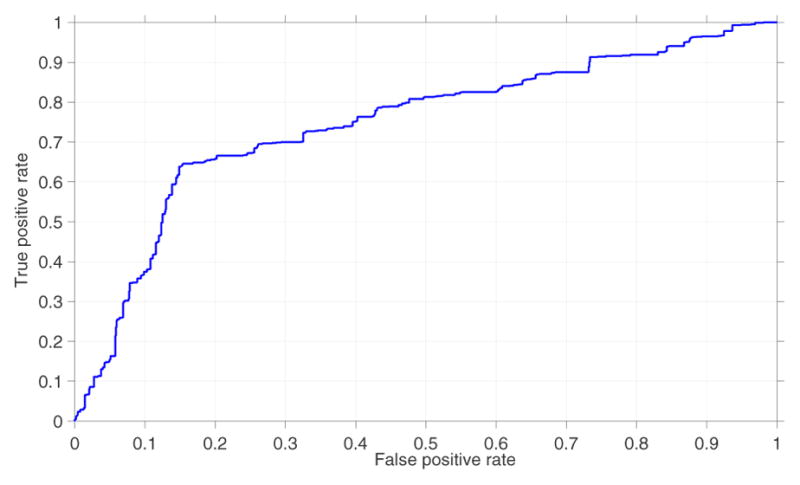
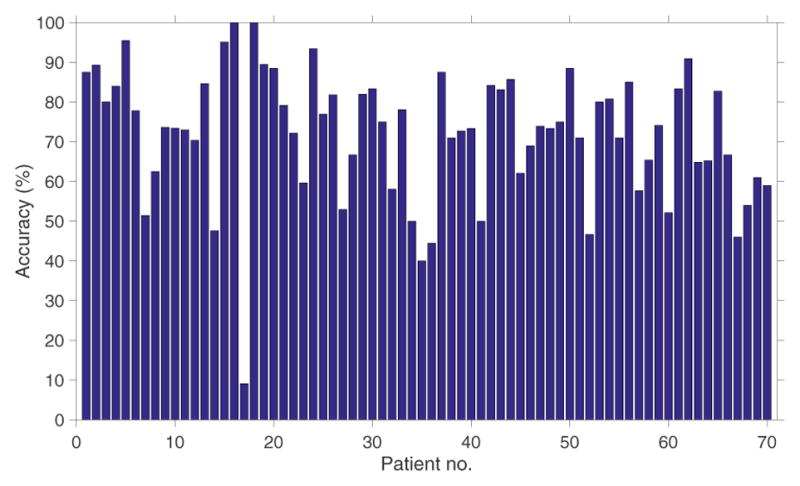
The training process of the 10-fold cross validation results in 70 different values of dur− and the optimal (maximum likelihood) value of 15 minutes (68/70) provided maximum accuracy during the training process. The PCA transformation reduced the dimension of the original feature space (31 features) to an average of 9 features. The proposed system correctly classified 64% (sensitivity = 64%) of sedated epochs and 84.8% (specificity = 84.8%) of nonsedated epochs as shown in Table IV. Figure 4 shows the performance of the proposed system. The area under the receiver-operator characteristic curve (AUC) was 0.72. This test provides a measure of the systems ability to distinguish between sedated and non-sedated state of the patient using HRV. Figure 5 shows the performance of the proposed system for each patient.
TABLE IV.
Confusion matrix of the proposed HRV based sedation system and the actual sedation score.
| Sedated | Nonsedated | |
|---|---|---|
| Sedated | 678 | 381 |
| Nonsedated | 179 | 999 |
|
| ||
| Accuracy (%) | 64 | 84.8 |
Fig. 4.

Mean receiver operating characteristic curve of the proposed system. Area under the ROC curve was 0.72.
Fig. 5.

Performance (accuracy, %) of the sedation level detection system for each patient.
The proposed patient-specific sedation level classification system is trained and tested for individual patient separately. Several features were used in this work, however, mean heart rate (MHR), high frequency spectral power (PHF), Poincar plot measures (SD1, SD2) and Kolmogorov complexity features were always selected across all patients. The proposed system using HRV has several advantages over traditional methods for assessing depth of sedation. The HRV (1) is unaffected by inter-observer variability, (2) can be used for continuous monitoring, and (3) does not require multiple electrodes for recording ECG when compared to EEG.
V. Conclusion
In this paper, we present a novel HRV based automated patient-specific sedation level classification system using several time, frequency and complexity domain features. This was a proof of concept study to demonstrate the potential of HRV to assess sedation levels in ICU patients. To improve the quality of the HRV signal under analysis, a novel artifact reduction technique was also proposed. The cross validated classification results on a large database (70 patients) show that the proposed system can predict the sedation levels with an overall accuracy of 75%.
With the additional help from several physiological and vital signals (such as electroencephalogram, blood pressure and respiration rate), we expect that the proposed system can be further developed to effectively monitor sedation levels and help clinical staff to reduce complications due to over-and under-sedation.
Acknowledgments
This work was supported by NIH-NINDS 1K23NS090900-01, Andrew David Heitman Foundation (MBW, ESR), Rappaport Foundation (MBW)
References
- 1.Pomeranz B, Macaulay RJ, Caudill MA, Kutz I, Adam D, Gordon D, Kilborn KM, Barger AC, Shannon DC, Cohen RJ. Assessment of autonomic function in humans by heart rate spectral analysis. The American Journal of Physiology. 1985 Jan;248(1 Pt 2):H151–153. doi: 10.1152/ajpheart.1985.248.1.H151. [DOI] [PubMed] [Google Scholar]
- 2.De Jonghe B, Cook D, Appere-De-Vecchi C, Guyatt G, Meade M, Outin H. Using and understanding sedation scoring systems: a systematic review. Intensive care medicine. 2000;26(3):275–285. doi: 10.1007/s001340051150. [DOI] [PubMed] [Google Scholar]
- 3.Jospin M, Caminal P, Jensen EW, Litvan H, Vallverd M, Struys MM, Vereecke HE, Kaplan DT. Detrended fluctuation analysis of EEG as a measure of depth of anesthesia. Biomedical Engineering, IEEE Transactions on. 2007;54(5):840–846. doi: 10.1109/TBME.2007.893453. [DOI] [PubMed] [Google Scholar]
- 4.Li X, Li D, Liang Z, Voss LJ, Sleigh JW. Analysis of depth of anesthesia with Hilbert–Huang spectral entropy. Clinical Neurophysiology. 2008;119(11):2465–2475. doi: 10.1016/j.clinph.2008.08.006. [DOI] [PubMed] [Google Scholar]
- 5.Chisholm CJ, Zurica J, Mironov D, Sciacca RR, Ornstein E, Heyer EJ. Comparison of electrophysiologic monitors with clinical assessment of level of sedation. Mayo Clinic Proceedings. 2006 Jan;81(1):46–52. doi: 10.4065/81.1.46. [DOI] [PMC free article] [PubMed] [Google Scholar]
- 6.Janz BA, Clifford GD, Mietus JE, Mark RG. Computers in Cardiology, 2005. IEEE; 2005. Multivariable analysis of sedation, activity, and agitation in critically ill patients using the Riker scale ECG, blood pressure, and respiratory rate; pp. 735–738. [Google Scholar]
- 7.Ebert TJ. Sympathetic and hemodynamic effects of moderate and deep sedation with propofol in humans. Anesthesiology. 2005 Jul;103(1):20–24. doi: 10.1097/00000542-200507000-00007. [DOI] [PubMed] [Google Scholar]
- 8.Bradley BD, Green G, Ramsay T, Seely AJE. Impact of sedation and organ failure on continuous heart and respiratory rate variability monitoring in critically ill patients: A pilot study*. Critical Care Medicine. 2013 Feb;41(2):433–444. doi: 10.1097/CCM.0b013e31826a47de. [DOI] [PubMed] [Google Scholar]
- 9.Sessler CN, Gosnell MS, Grap MJ, Brophy GM, O’Neal PV, Keane KA, Tesoro EP, Elswick RK. The Richmond Agitation-Sedation Scale: validity and reliability in adult intensive care unit patients. American Journal of Respiratory and Critical Care Medicine. 2002 Nov;166(10):1338–1344. doi: 10.1164/rccm.2107138. [DOI] [PubMed] [Google Scholar]
- 10.Pan J, Tompkins WJ. A real-time QRS detection algorithm; Biomedical Engineering, IEEE Transactions on; 1985. pp. 230–236. [DOI] [PubMed] [Google Scholar]
- 11.Clifford GD, McSharry PE, Tarassenko L. Computers in Cardiology, 2002. IEEE; 2002. Characterizing artefact in the normal human 24-hour RR time series to aid identification and artificial replication of circadian variations in human beat to beat heart rate using a simple threshold; pp. 129–132. [Google Scholar]
- 12.Kaufmann T, Sütterlin S, Schulz SM, Vögele C. Artiifact: a tool for heart rate artifact processing and heart rate variability analysis. Behavior research methods. 2011;43(4):1161–1170. doi: 10.3758/s13428-011-0107-7. [DOI] [PubMed] [Google Scholar]
- 13.de Chazal P, Heneghan C, Sheridan E, Reilly R, Nolan P, O’Malley M. Automated processing of the single-lead electrocardiogram for the detection of obstructive sleep apnoea. IEEE transactions on bio-medical engineering. 2003 Jun;50(6):686–696. doi: 10.1109/TBME.2003.812203. [DOI] [PubMed] [Google Scholar]
- 14.Stein PK, Kleiger RE, Domitrovich PP, Schechtman KB, Rottman JN. Clinical and demographic determinants of heart rate variability in patients post myocardial infarction: insights from the cardiac arrhythmia suppression trial (CAST) Clinical cardiology. 2000;23(3):187–194. doi: 10.1002/clc.4960230311. [DOI] [PMC free article] [PubMed] [Google Scholar]
- 15.Chang CC, Lin CJ. LIBSVM: A library for support vector machines. ACM Transactions on Intelligent Systems and Technology (TIST) 2011;2(3):27. [Google Scholar]


