Abstract
Treatment of end-stage heart failure includes cardiac transplantation or ventricular assist device (VAD) therapy. While increasingly prevalent, current VAD therapy has inherent complications, including thrombosis. Studies have demonstrated that VAD implantation alters intra-cardiac blood flow, creating areas of stagnation that predispose to thrombus formation. Two potential surgical configurations exist for VAD implantation: through the apical or diaphragmatic surfaces of the heart. We hypothesized that diaphragmatic implantation causes more stagnation than apical implantation. We also hypothesized that intermittent aortic valve (AV) opening reduces stagnation of blood inside the left ventricle (LV) when compared to a closed AV. To test these hypotheses, a human left-ventricle geometry was re-created in silico and a VAD inflow cannula was virtually implanted in each configuration. A computational indicator-dilution study was conducted where “virtually-dyed blood” was washed out of the LV by injecting blood with no dye. Simulations demonstrated a substantial reduction in stagnation with intermittent AV opening. In addition, virtual dye was cleared slightly faster in the apical configuration. Simulations from our study demonstrate the clinical importance of VAD management to allow intermittent opening of the AV to prevent subvalvular stagnation, and it also suggests that apical configuration might be more hemodynamically favorable.
Keywords: Ventricular Assist Device, Computational Fluid Dynamics, Blood Flow, Stagnation, Surgical Configuration
Introduction
Ventricular assist device (VAD) therapy is the most viable alternative to cardiac transplantation in medical therapy refractory heart failure [1-3]. Two surgical techniques have been proposed for implantation of contemporary VADs. The most common surgical technique, referred to in this study as “apical” implantation, is to place the inflow cannula into the LV apex, directed towards the mitral valve (see reference [4] for description of technique). Implantation of the Thoratec HeartMate II (a second generation device) in the apical configuration required the creation of a pump-pocket, which was a significant clinical drawback [5]. Other theoretical drawbacks to this technique include fixating the ventricular apex and impeding cardiac torsion. To avoid the creation of a pump-pocket, Gregoric and colleagues (2011) proposed an alternative surgical technique, referred to in this study as the “diaphragmatic” implantation, in which the inflow cannula is implanted parallel to the short axis of the LV and anterior to the papillary muscle insertion [5]. Although creation of a pump pocket is not required with third generation devices [6], the ideal inflow cannula location remains a point of contention. Sileshi and colleagues (2015) compared the two techniques demonstrating that in the acute setting, surgical technique did not affect total hospital stay or post-operative ICU time [7]. However, very little data is available that can provide insight into potential hemodynamic differences between the two configurations and how these differences in blood flow patterns may affect long-term outcomes.
One of the most devastating complications of VAD therapy is thrombus formation leading to stroke [8]. Stasis, endothelial injury, and hypercoagulability are three categories of factors thought to promote thrombosis (i.e., the Virchow’s “triad”) [9]. Disruption of physiological blood flow in VAD patients leads to regions of stagnation or “hot-spots” prone to forming thrombi [10]. In physiological blood flow, thrombus formation is prevented by appropriate levels of wall shear stress that create a homeostatic balance between fibrin monomer polymerization and cleavage. In areas of stagnation, this homeostatic balance is disrupted, increasing the susceptibility to pathological thrombus formation. Following continuous flow VAD implantation, blood flow patterns are substantially altered in the heart, aorta, and great vessels [11-15]. Studies have demonstrated that VAD implantation increases shear stress, hemolysis, and stagnation [16]. These parameters are biologically important as they all adversely affect thrombogenicity [17]. More importantly, case reports have demonstrated that areas of stagnation caused by VAD implantation can be fatal [18].
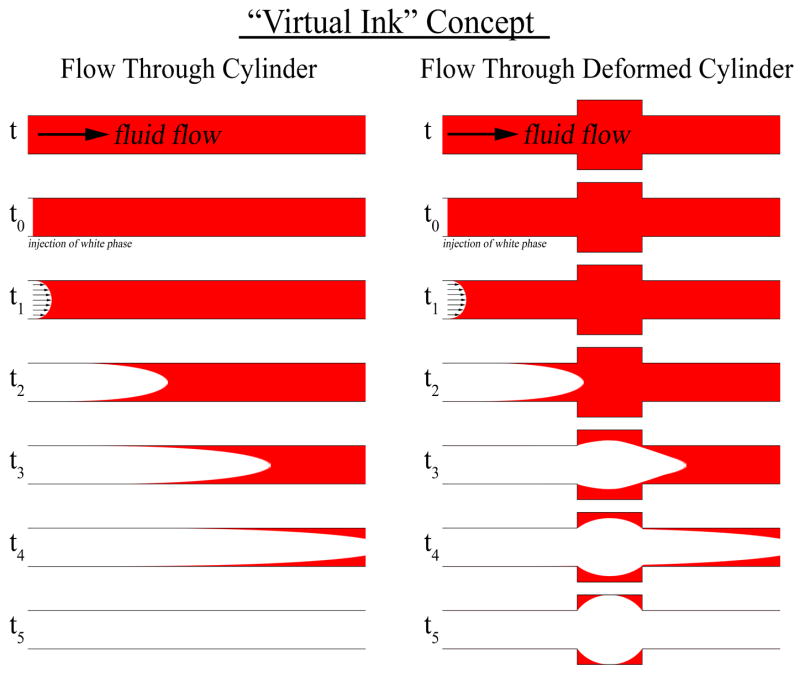
Initial studies by Chiu and colleagues demonstrated that surgical VAD configuration affects blood thrombogenicity [16]. To expand on these findings, we designed a computational study to test the hypothesis that the VAD implantation site affects stagnation of blood flow within the LV. To test this hypothesis, a three-dimensional (3D) model of the left-heart was constructed from clinical imaging of a heart failure patient prior to VAD implantation. A VAD inflow cannula was virtually implanted in both apical and diaphragmatic configurations. Computational fluid dynamic (CFD) simulations of blood flow through the VAD-supported ventricle were used to identify areas of stagnation. More specifically, an indicator-dilution study was performed using an established technique known as the “virtual ink” method [19] to identify areas of stagnating blood (Figure 1). This technique allowed quantification and visualization of stagnant “hot-spots.” The virtual ink technique was used to compare the two surgical configurations and test whether one configuration is more hemodynamically favorable.
Figure 1. Concept of Virtual Ink Washout.
Illustration of the technique employed in this study to identify areas of stagnation. Two scenarios are illustrated, fluid flow through a straight cylinder (left) and through a deformed cylinder (right). At time point t0, fluid flow through the cylinders is changed from fluid with red ink to fluid without ink. Red fluid in the straight cylinder is washed out in accordance with a laminar flow profile. However, in the deformed cylinder, the red fluid is washed out more slowly, with stagnant areas still retaining red fluid by time point t5 due to decreased localized flow.
Another important clinical issue facing VAD patients is the development of aortic valve (AV) complications. Multiple studies have demonstrated the risk of developing AV pathology, aortic regurgitation and leaflet fusion [20, 21]. This has been shown in patients with the HeartWare HVAD (centrifugal pump), the Thoratec HMI and the HMII (axial flow pump) [22, 23]. The risk of development of AV disease is reduced in patients managed to allow intermittent AV opening [24, 25]. While many hypotheses exist as to the exact causes responsible for development of AV disease, most hypotheses are related to alterations in physiological hemodynamics due to the implanted device. Based on these data, many centers aim to adjust VAD speed to allow for intermittent AV opening. To determine if intermittent AV opening has an effect on stagnation of blood within the LV, we also conducted simulations to test this hypothesis. Predictions generated from these analyses offer insight regarding optimal device design, site of surgical implantation, and implementation of VAD therapy.
Methods
Patient Selection
This study was approved by the IRB at the Medical College of Wisconsin. Informed consent was not required as the study was conducted in a retrospective fashion. Inclusion criteria included: Adults, ≥18 years of age, ≥1 contrast-enhanced CT scan in the patient’s medical record, diagnosis of severe heart failure (NYHA class IV), and evidence of dilated left ventricle with an estimated ejection fraction of <20% or current VAD candidate. Exclusion criteria included: artificial heart valves, clinically significant valve disease, and/or history of cardiac transplant. Based on these criteria, a patient was identified who had undergone contrast-enhanced CT imaging 4 weeks prior to VAD implantation. The de-identified DICOM images had 0.625 mm slice thickness and 0.6 mm pixel size.
Creation of Fluid Domain
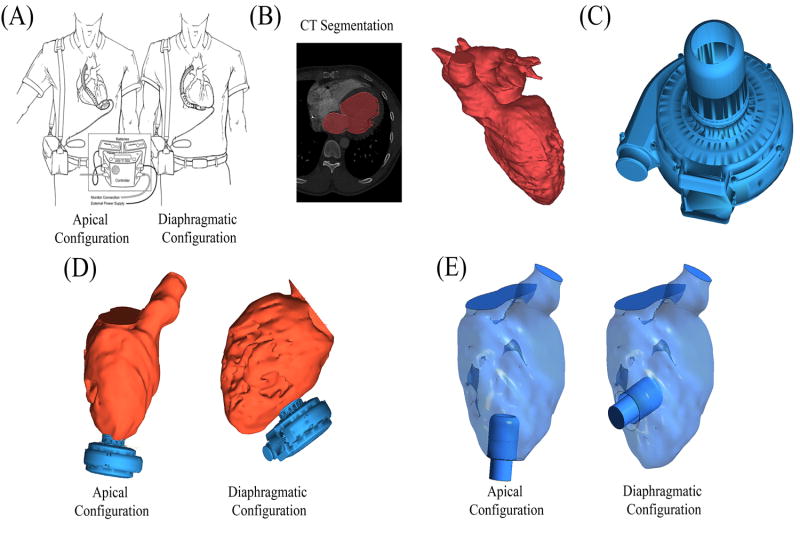
A three dimensional model of the blood flow path within the left heart was created in Mimics 16.0 (Materialise Inc., Leuven, Belgium) (Figure 2, B). Briefly, the de-identified DICOM image set was imported and the flow lumen was manually segmented, verified by a board-certified thoracic radiologist, and converted to a 3D object. The cardiovascular regions contained in the 3D object included the pulmonary veins, left atria, LV, and ascending aorta. This geometry was cropped to include the path from the mitral to AV. The 3D geometry of a HeartWare HVAD inflow cannula was provided by HeartWare International, Inc (Figure 2, C). Both geometries were imported into ICEM-CFD 14.0 (ANSYS, Canonsburg, PA), where the inflow cannula was positioned in both surgical configurations (Figure 2, D). The device inflow cannula was subtracted from the fluid domain and its distal end defined as an outlet (Figure 2, E). The model was inspected and verified by a board-certified cardiothoracic surgeon. Four surfaces were defined in the geometry (Figure 2): mitral valve (inlet), aortic valve (outlet), VAD inflow cannula (outlet), and the endocardium (walls).
Figure 2. Generation of Cardiac Anatomy.
Virtual surgery was applied to implant the VAD in two surgical configurations: apical vs. diaphragmatic configurations. (A) Illustration (reprinted with permission from Gregoric et. al. 2011), shows both the apical (left) and diaphragmatic (right) configurations in situ. (B) The blood flow path in the left heart was segmented from contrast-enhanced CT scans of a heart failure patient prior to VAD implantation. (C) 3D geometry from the Heartware HVAD. (D) The VAD geometry was combined with the heart geometry to represent both surgical configurations. (E) The HVAD cannula geometry was subtracted from the fluid domain and its distal end defined as the outlet, thus defining the final geometries used in simulations.
CFD Simulations
Each geometry was reconstructed as a mesh of approximately 4.7 million tetrahedral cells using ANSYS ICEM-CFD 14.0 (ANSYS Inc., Cannonsburg, PA). Transient 3D simulations were conducted in ANSYS Fluent 14.0 (ANSYS Inc., Cannonsburg, PA). The spatial and temporal resolutions, with an average spacing of approximately 100 microns and a time step of 0.01 seconds, are able to capture the main features of the flow. The simulations were run for a total of 12 one-second cardiac cycles. The simulation boundary conditions were as follows: (1) unsteady velocity was used at the mitral valve, corresponding to a Doppler-measured time-dependent flowrate, (2) the VAD cannula opening was set to a constant pressure, and (3) no slip at the walls. Depending upon the simulation, the AV was set to be either closed (no fluid flow) or intermittently opened. In simulations designed to replicate intermittent AV opening, the AV was set to open every 4th beat. When open, the pressure at both the AV outlet and VAD outlet were set to the same pressure (afterload) allowing the simulation to mathematically determine the volumetric flow through each outlet. While there is no aortic arch in these simulations, this assumption is reasonable as flow through both the VAD and AV conjoins in the aorta.
The inflow waveform across the mitral valve was derived from previously published in vivo measurements in another heart failure patient using echo-Doppler [26, 27]. A smoothed-periodic curve was fitted to the echo-Doppler data in MATLAB R2014a (Mathworks, Natick, MA) (Figure 3, A). The geometry was modeled as rigid given that the cross section of the left ventricle was demonstrated to vary minimally in systole versus diastole in an advanced heart failure patient (Figure 3, B). The curve was scaled to a cardiac index (CI) of 1.8 or 3.0, where CI = 1.8 represents the lower physiological limit of blood flow in a heart failure patient and CI = 3.0 represents a well-compensated patient. To compute the cardiac index [CI = Cardiac Output (L/min) / Body Surface Area (m2)], the body surface area (BSA) was calculated from patient height (H) and weight (W) using the Du Bois equation (BSA = 0.007184 W0.425H0.725), where H is in cm and W is in kg [28]. Based on these methods, the average cardiac output was 3.02 L/min and 5.03 L/min for CI = 1.8 and 3.0, respectively. The initial flow conditions were obtained by running 2 cardiac cycles prior to the 12-cycle simulation. Blood was modeled as a Newtonian fluid with a density of 1,060 kg/m3 and a viscosity of 0.0035 Pa·s.
Figure 3. Initial CFD Simulations.
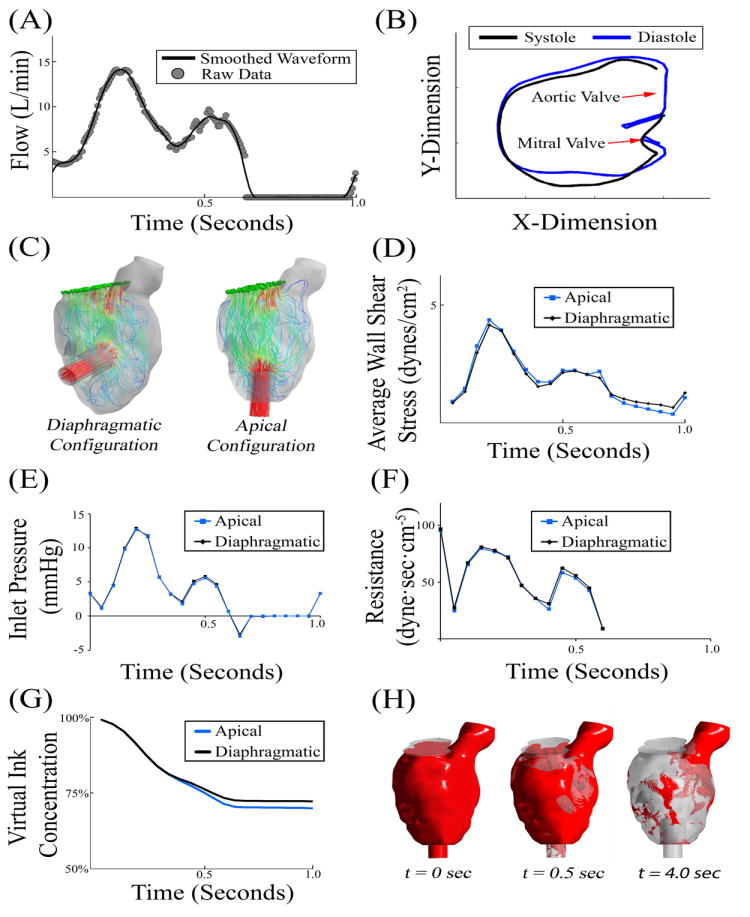
(A) Blood flow across the mitral valve was measured using echocardiography and scaled to a cardiac index of 3.0 [27]. (B) In this patient with severe heart failure, there was a minimal change in left ventricle geometry during the cardiac cycle. (C) Instantaneous flow pathlines in the two VAD configurations. (D-F) Initial 1.0 second simulations demonstrated minimal variability in wall shear stress, inlet pressure, or flow resistance. (G) Initial 1 second virtual ink washout study demonstrated that the apical configuration cleared approximately 2% more than the diaphragmatic configuration. (H) Visual representation of virtual ink simulation after 0, 0.5, and 4.0 seconds.
Output and Analysis
Stagnation was quantified using the virtual ink technique originally described by Rayz and colleagues [19]. Briefly, the transport of virtual ink is described via a passive scalar with zero flux at the walls. Transport of the virtual ink is governed by the underling blood flow patterns, but has no influence on blood flow. The diffusion coefficient of the virtual ink is set to zero, so that its clearance is determined purely by advection. Each simulation started with a virtual ink concentration equal to 1.0 (in arbitrary units) everywhere in the domain and the percentage of ink remaining in the domain was plotted as a function of time.
A poor fit was obtained when the clearance curves were fit with a single exponential curve, but an excellent fit was obtained with a double-exponential curve relating virtual ink concentration to elapsed time:
| Equation 1 |
where C (t) is the volume-average concentration of virtual ink as a function of time and C0 = 1 is the initial concentration of virtual ink. The fitting constants τ1 and τ2 represent the characteristic times of virtual ink clearance from the bulk flow (fast clearance) and stagnating regions (slow clearance). Defining the half-life as the time required to clear 50% of the virtual ink within each clearance mode, and assuming τ1 < τ2 the fast and slow clearance half-lives are defined as:
| Equation 2 |
| Equation 3 |
Results
Initial Simulations
The inlet flow waveform was scaled to a cardiac index of 3.0 to represent the cardiac output of a well-compensated patient (Figure 3). Pathlines illustrate the blood flow trajectories under these conditions (Figure 3, C). Post processing analysis revealed that variations in average wall shear stress, inlet pressure (measured at the mitral valve), and hydrodynamic resistance were minimal between the two surgical configurations (Figure 3, D-F). These results suggest that any differences observed in virtual ink clearance were due to differences in stagnation. A virtual ink washout study over 1 heartbeat demonstrated approximately a 2% increase in red ink clearance of the apical configuration over the diaphragmatic configuration (Figure 3, G). While a 2% difference is modest, this difference lead to the hypothesis that over the course of multiple cardiac cycles, the difference would accumulate and ultimately lead to substantial clinical differences in thrombogenicity.
Simulations Over Multiple Cardiac Cycles
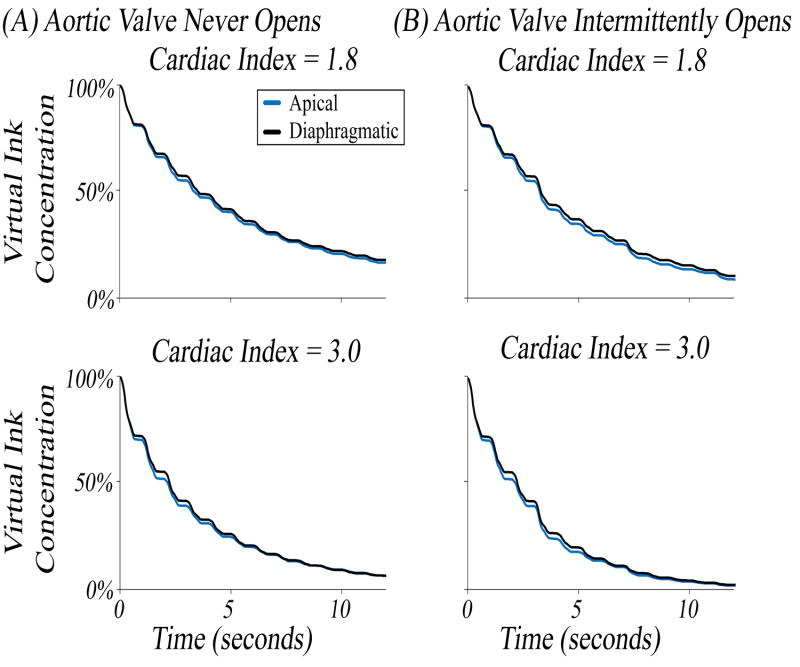
To test the hypothesis that differences in virtual ink clearance simulations would accumulate over multiple cycles resulting in substantial differences in stagnation, simulations were performed in each configuration for 12 cardiac cycles (1 cycle = 1 second) at cardiac indices of 1.8 and 3.0 (Figure 4). Clinically in VAD-implanted patients, blood flow through the VAD can vary resulting in a range of AV opening frequency. Thus, simulations were done to represent the extremes of AV activity. In simulations designed to simulate infrequent opening, the boundary condition at the AV was set to allow no flow (i.e., wall) for the duration of the simulation, while in simulations with intermittent opening of the AV, the valve was set to open every 4th cycle.
Figure 4. Virtual Ink Clearance in Apical versus Diaphragmatic Configurations.
Injection of clear ink was started a t = 0 seconds to clear red ink. The percentage of initial red ink remaining was plotted as a function of time. (A) Simulations were conducted at a CI of 1.8 and 3.0 where the aortic valve was not allowed to open. (B) Simulations were conducted at a CI of 1.8 and 3.0 where the aortic valve was allowed to open intermittently.
After 12 seconds with no flow through the AV (Figure 4, A), it was found that the apical configuration cleared 1.2% more virtual ink for a cardiac index of 1.8 (83.3% vs 82.1%) but was nearly identical at a cardiac index of 3.0 (93.4% apical vs 93.5% diaphragmatic). When allowing the AV to open every 4th beat, a similar behavior was noted (Figure 4, B); at a cardiac index of 1.8, the apical configuration was able to clear 1.7% more after 12 seconds (91.3% vs 89.6%) whereas there was very little difference at a cardiac index of 3.0 (98.2% apical vs 97.9% diaphragmatic). In every set of simulations, the curves for the two implantation sites approached the same asymptote, but in every instance the apical configuration initially cleared the virtual ink faster. Contrary to our expectation, however, the difference between the two curves did not grow over time.
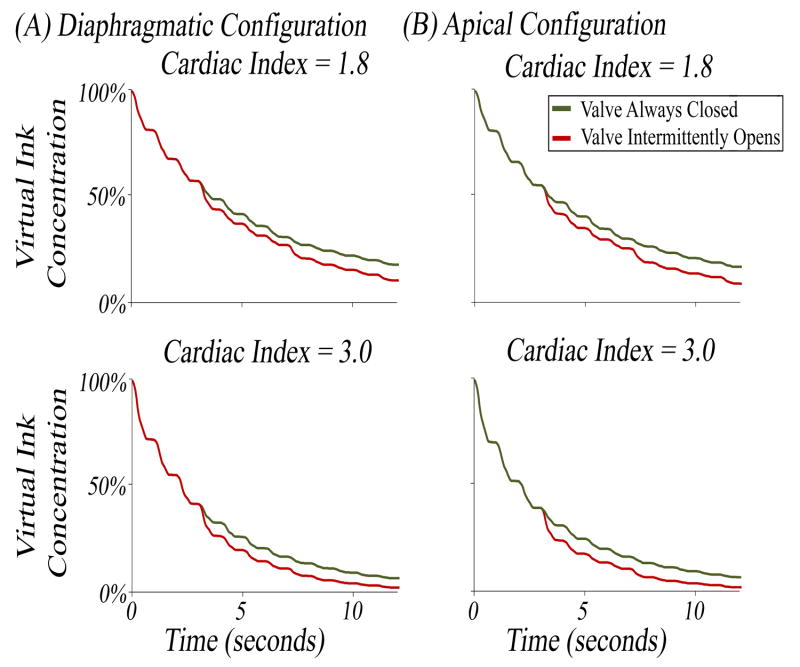
The importance of allowing intermittent opening of the AV has been established clinically as a strategy to avoid AV leaflet fusion and subsequent aortic regurgitation. However, no studies have tested the hypothesis that intermittent AV opening affects stagnation of blood flow immediately proximal to the valve. The simulations conducted in Figure 4 allowed this hypothesis to be tested directly. The results were re-plotted in Figure 5 to test intermittent AV opening as the independent variable. In the diaphragmatic configuration, it was found that intermittent AV opening allowed for a 7.5% increase in clearance of ink (89.6% intermittent vs 82.1% closed) for a CI of 1.8 and a 4.4% increase (97.9% intermittent vs 93.5% closed) for a CI of 3.0 after 12 seconds (Figure 5, A). Similar differences were observed when testing this hypothesis in the apical configuration (Figure 5, B).
Figure 5. Virtual Ink Clearance with Aortic Valve Closed versus Intermittent Opening.
Same data as in Figure 4 replotted to assess the effect of aortic valve intermittent opening on blood stagnation. (A) Simulations were conducted in the diaphragmatic configuration at a CI of 1.8 and 3.0. (B) Simulations were conducted in the apical configuration at a CI of 1.8 and 3.0. On all graphs, the percentage of initial red ink remaining was plotted as a percentage on the y-axis.
To summarize, a modest difference in stagnation was observed between the apical and diaphragmatic configurations, but a substantial difference in stagnation was observed when intermittent AV opening was allowed.
Clearance half-lives
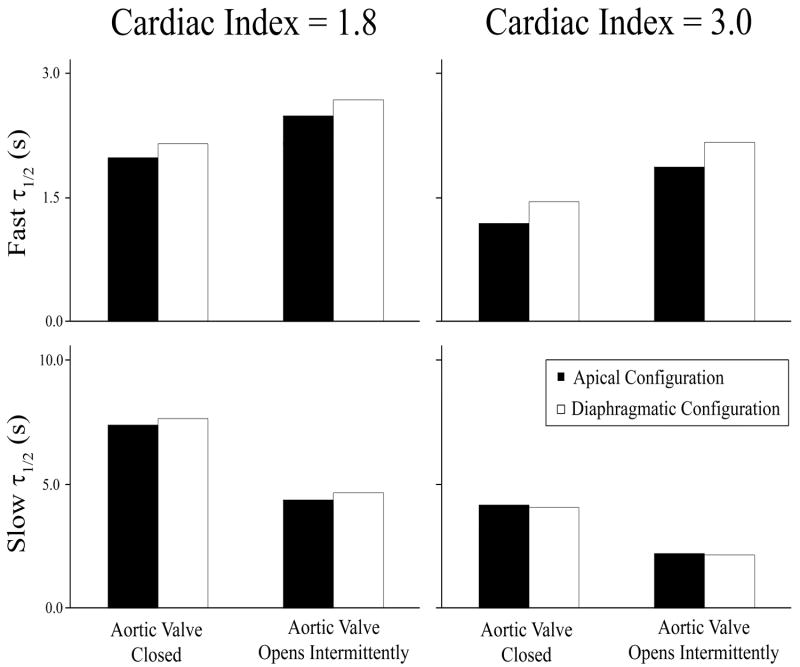
One weakness of the comparisons made between different curves in Figures 4 and 5 is that these comparisons were made at arbitrary time points (t=1s and t=12s, respectively). To quantify the clearance rate in a time-independent fashion, the washout curves were fit with a double exponential curve (Equation 1), which provided half-lives for clearance of bulk flow vs. stagnating regions. In simulations where the AV remained closed, the fast clearance half-life (τ1/2)FAST was shorter in the apical configuration than in the diaphragmatic configuration by 8.4% at a CI of 1.8 (1.98 seconds vs 2.15 seconds) and by 21% at a CI of 3.0 (1.19 seconds vs 1.45 seconds) (Figure 6). In simulations where the AV was allowed to open intermittently, the fast clearance half-life was also shorter in the apical configuration, although by smaller margin: a 7.7% difference at CI of 1.8 (2.48 seconds vs 2.68 seconds) and a 15.8% difference at a CI of 3.0 (1.87 seconds vs 2.17 seconds). In contrast, the slow clearance half-life (τ1/2)SLOW was similar in the two VAD configurations, regardless of whether the AV was always closed or allowed to open (Figure 6). These results suggest that ink clearance in the ventricle by bulk flow was faster in the apical implantation, but clearance from the stagnating regions was similar in the two VAD configurations.
Figure 6. Comparison of Fast and Slow Washout Half-Lives in Apical vs Diaphragmatic Configurations.
Curves in Figures 4 and 5 were fit to a second order exponential decay model (Equation 1), which suggested two modes of virtual ink clearance, namely a fast clearance mode representing bulk flow clearance and a slow clearance mode representing clearance from stagnating regions. The half-life of the fast and slow clearance modes were computed for each surgical configuration and cardiac indices of 1.8 and 3.0.
Virtual ink clearance was significantly faster when the AV opened intermittently as compared to when the AV was closed (Figures 5 and 6). Intermittent opening of the AV led to a significant reduction in the slow clearance half-life (Figure 6), which implies a reduction in blood stagnation in the subvalvular region when the AV opens. In addition, intermittent opening of the AV increased the fast clearance half-life in such a way that there was a much smaller difference between the fast and slow clearance modes. This implies that the washout curve behaved more like a single exponential decay with less regions of blood stagnation when the AV opened every 4th beat.
Identification of Areas of Stagnation
Results from Figures 4-7 indicate two important findings with respect to stagnation of blood flow: 1. Opening of the AV is the most important factor affecting blood stagnation in the VAD-supported left ventricle, and 2. The apical configuration clears blood slightly faster than the diaphragmatic configuration. To identify stagnant “hot-spots”, a 3D representation of the fluid geometry was created after 12 seconds of flow. Any voxel that contained at least 50% of the original virtual ink was colored red in Figure 7. In both surgical configurations, blood stasis occurred in the sub-valvular region when the AV was kept closed. Intermittent opening of the AV allowed flow through the valve to clear virtual ink from this region (there was no retrograde flow in this model). However, for the lower cardiac output (CI = 1.8), regions of blood stagnation can still be seen at the apex of the heart and lateral to the aorta even when the AV opens intermittently. Finally, more blood stagnation was observed at the apex of the heart in the diaphragmatic configuration than in the apical configuration (Figure 7).
Figure 7. Visualization of Stagnation Zones.
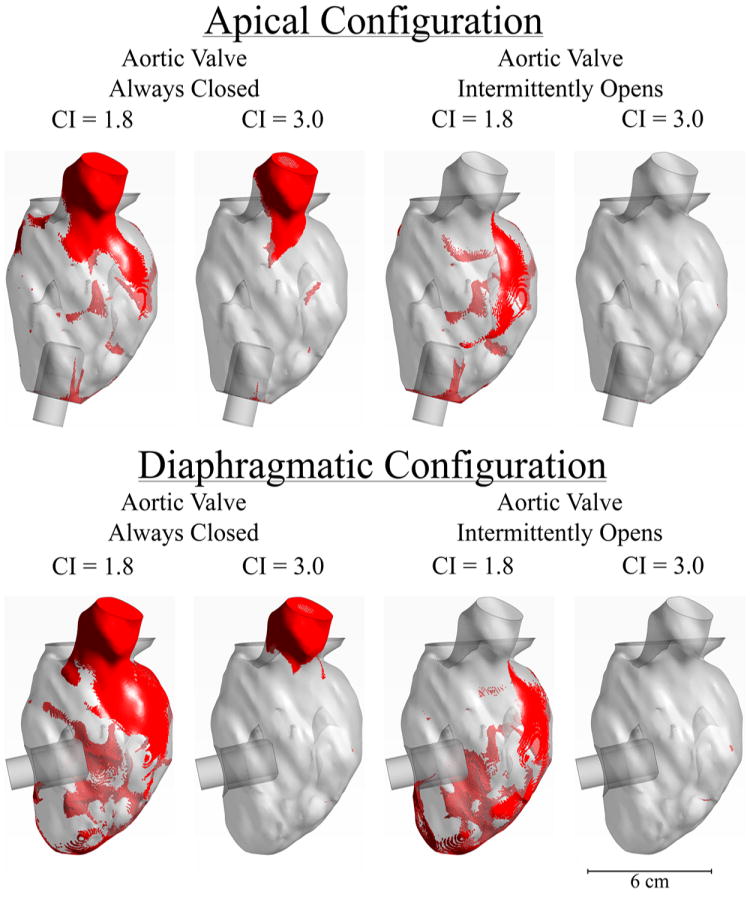
After 12 seconds of simulation, the remaining red ink was visualized in each geometry. Elements were colored “red” if they contained more than 50% of the initial red ink concentration. Top figures are for the apical configuration, bottom figures are for the diaphragmatic configuration.
Discussion
This study investigated regions of blood stagnation in a computational model of a VAD-implanted LV using the virtual ink washout technique. Two hypotheses were tested: 1. Whether blood stagnation is greater in diaphragmatic vs. apical implantation and, 2. Whether intermittent AV opening decreases the amount of stagnating blood. Simulations suggested that virtual ink clearance was slightly faster in the apical configuration compared to the diaphragmatic configuration. Simulations demonstrated that opening of the AV greatly reduced blood stagnation in the LV.
Stagnation of Blood in the Apical vs. Diaphragmatic Configurations
Complications associated with VAD therapy can be divided into two categories: acute and chronic complications [29]. Acute complications include those associated with surgery, such as post-operative right ventricular failure, or perioperative bleeding. Chronic complications include neurologic events, device thrombosis, and aortic regurgitation [20]. It has been established experimentally for nearly 100 years that blood stagnation leads to thrombus formation [30]. It is also well-understood in the literature that continuous flow VAD therapy alters physiological blood flow by creating hemodynamically unfavorable stagnant “hot-spots” [18, 31]. In this study, we aimed to identify regions of blood stasis within the LV that could be areas of thrombosis formation under the assumption that stagnant blood promotes thrombotic events associated with chronic complications in VAD patients.
When implanting a VAD, many considerations must be taken into account when deciding on the optimal implantation strategy. Current considerations include device size/type, patient anatomy, and surgeon preference. To our knowledge, no studies have directly tested the impact of surgical configuration on blood flow stagnation. While short-term clinical studies have demonstrated equipoise between the two techniques [7], no long-term clinical studies have compared complications. Our simulations suggest there might be a higher risk for thromboembolic events with diaphragmatic implantation due to greater blood stagnation as compared to apical implantation. Our simulations demonstrated blood flow was slower in areas that were not directly along the path between the inlet (mitral valve) and outlets (VAD and AV). Thus, it appears that implantation of a VAD in the diaphragmatic configuration induces stagnation of blood in the apex of the heart. While our simulations demonstrated a relatively modest difference in stagnation between the two configurations, it is important to consider that even small areas of stagnation can still induce formation of thrombi with clinical consequences [32].
This process can be thought of as analogous to atrial fibrillation causing blood stagnation in the left atrial appendage [33]. However, one must use caution when interpreting these results, as the difference in blood stagnation between apical and diaphragmatic configurations was modest. Prior to using data from our study to justify a larger and more expensive animal or clinical study, it would be important to repeat these simulations on several patient geometries to determine if any statistically significant differences can be identified. Importantly, if future studies confirm that the diaphragmatic configuration carries an increased risk of thromboembolism; this drawback will still need to be quantitated and weighed against other theoretical benefits of diaphragmatic implantation.
Opening of the Aortic Valve
With a closed AV, the entire cardiac output flows from the mitral valve, through the VAD, and into the aorta at the site of the outflow graft (configuration in series). This artificial blood flow path greatly increases blood residence time along areas not directly in the flow path, potentially resulting in thrombosis [18]. One serious long-term complication of VAD therapy is the development of AV disease including leaflet fusion, stenosis, and regurgitation [20, 21]. The molecular mechanisms for development of these pathologies are incompletely understood, but hypothesized to be the result of non-pulsatile flow, diminished leaflet motion, and/or activation of the clotting cascade due to blood trauma induced by the VAD [15].
When the AV opens, blood flow travels through both the native heart and the VAD (configuration in parallel). Many computational studies have focused on stagnation of blood flow in the aorta and great vessels. Studies conducted where the AV remained closed found that stagnation typically occurs immediately distal to the AV [11, 14, 34]. A previous study by our group followed up on these results demonstrating that including residual cardiac function in the simulation eliminated stagnation [35]. This finding demonstrates the importance of optimizing VAD speed to allow for intermittent AV opening. Our study further supports this finding as we have demonstrated intermittent AV opening will reduce subvalvular stagnation immediately proximal to the aortic valve. Follow up in vivo and in vitro studies are necessary to determine whether the primary cause of AV disease in VAD patients is stagnation or another mechanism of pathologic blood flow.
While this study has several strengths including use of clinical data (cardiac geometry, VAD geometry, and inlet waveform), unsteady simulations, and an established method for identifying stagnant flow, three limitations must be acknowledged. First, the heart was modeled as a rigid structure. In a healthy heart, this would be an unreasonable assumption. However, in patients with heart failure, the LV has minimal contractility (Figure 3, B) so this assumption is not unreasonable. The second limitation is that LV blood flow was assumed to be laminar, as in previous studies [36, 37]. In our model, the maximum Reynolds number at the mitral valve was Re = 1,905, which supports the assumption in our model [38]. A recent CFD study that used a turbulence model reported turbulent fluctuations in the velocity field in the LV, but the authors concluded that laminar models capture the large-scale flow features, including residence times [37]. Finally, the third limitation of our study is that a single patient geometry was studied. While we attempted to choose a geometry that was a “median” patient representation, no statistical conclusions could be drawn preventing our results from being generalizable to all VAD candidates. In spite of this fact, our simulations demonstrate the importance of allowing intermittent AV opening to prevent subvalvular blood stagnation. Furthermore, these simulations provide initial evidence that the apical configuration may be more hemodynamically favorable and justify further in silico and ex vivo studies of the VAD surgical configuration.
In summary, VAD therapy is rapidly evolving, resulting in greater clinical and surgical flexibility. Fortunately, this has broadened the target patient population and therefore, number of candidates eligible for VAD therapy. However, this rapid progression of technology has resulted in clinical options that have an unknown effect on patient outcomes. Next-generation devices from several manufacturers are currently in clinical trials and these will only increase the flexibility of VAD therapy giving surgeons, clinicians, and device designers/manufacturers additional therapeutic options for which patient outcomes are unknown. Rather than drawing direct clinical conclusions, the results from this study should be used as an impetus to help design further computational, ex-vivo, and clinical studies to further improve VAD therapy.
Acknowledgments
We would like to thank Dr. Jason Hokama from HeartWare Inc. for providing the HeartWare HVAD geometry. We also thank Dr. Vitaliy Rayz for providing computational assistance with the virtual ink technique. We would also like to thank Dr. Sasha Prisco for her input on the manuscript. Finally, we would like to thank Pablo Martinez-Legapzi from Hospital Gregorio Marañon in Madrid and Juan Carlos del Alamo from UCSD for sharing the echo Doppler data used as the inlet boundary conditions in this study.
Funding Sources: This project was supported in part by the National Center for Advancing Translational Sciences, National Institutes of Health, through Grant Numbers 8KL2TR000056 and UL1TR001436. Its contents are solely the responsibility of the authors and do not necessarily represent the official views of the NIH.
Footnotes
Conflicts of Interest: NAM has a consulting relationship with St. Jude and HeartWare, and is an investigator for St. Jude, HeartWare, and SynCardia. CM has consulting relationships with St. Jude, Abiomedand HeartWare and is an investigator for St. Jude, HeartWare, and SynCardia. JAB has consulting relationships with St. Jude, Abiomed and HeartWare
References
- 1.Norton C, et al. Epidemiology and cost of advanced heart failure. Prog Cardiovasc Dis. 2011;54(2):78–85. doi: 10.1016/j.pcad.2011.04.002. [DOI] [PubMed] [Google Scholar]
- 2.Rose EA, et al. Long-term use of a left ventricular assist device for end-stage heart failure. New England Journal of Medicine. 2001;345(20):1435–1443. doi: 10.1056/NEJMoa012175. [DOI] [PubMed] [Google Scholar]
- 3.Lietz K, et al. Outcomes of left ventricular assist device implantation as destination therapy in the post-REMATCH era implications for patient selection. Circulation. 2007;116(5):497–505. doi: 10.1161/CIRCULATIONAHA.107.691972. [DOI] [PubMed] [Google Scholar]
- 4.Kar B, et al. The effect of LVAD aortic outflow-graft placement on hemodynamics and flow: Implantation technique and computer flow modeling. Texas Heart Institute Journal. 2005;32(3):294–298. [PMC free article] [PubMed] [Google Scholar]
- 5.Gregoric ID, Cohn WE, Frazier OH. Diaphragmatic implantation of the HeartWare ventricular assist device. J Heart Lung Transplant. 2011;30(4):467–70. doi: 10.1016/j.healun.2010.11.014. [DOI] [PubMed] [Google Scholar]
- 6.Wieselthaler GM, et al. Initial clinical experience with a novel left ventricular assist device with a magnetically levitated rotor in a multi-institutional trial. The Journal of Heart and Lung Transplantation. 2010;29(11):1218–1225. doi: 10.1016/j.healun.2010.05.016. [DOI] [PubMed] [Google Scholar]
- 7.Sileshi B, et al. In-hospital outcomes of a minimally invasive off-pump left thoracotomy approach using a centrifugal continuous-flow left ventricular assist device. The Journal of Heart and Lung Transplantation. 2015;34(1):107–112. doi: 10.1016/j.healun.2014.09.023. [DOI] [PubMed] [Google Scholar]
- 8.Morgan JA, et al. Stroke while on long-term left ventricular assist device support: incidence, outcome, and predictors. ASAIO Journal. 2014;60(3):284–289. doi: 10.1097/MAT.0000000000000074. [DOI] [PubMed] [Google Scholar]
- 9.Lowe GD. Virchow’s triad revisited: abnormal flow. Pathophysiology of haemostasis and thrombosis. 2003;33(5-6):455–457. doi: 10.1159/000083845. [DOI] [PubMed] [Google Scholar]
- 10.Xenos M, et al. Device Thrombogenicity Emulator (DTE)–Design optimization methodology for cardiovascular devices: A study in two bileaflet MHV designs. Journal of biomechanics. 2010;43(12):2400–2409. doi: 10.1016/j.jbiomech.2010.04.020. [DOI] [PMC free article] [PubMed] [Google Scholar]
- 11.May-Newman K, Hillen B, Dembitsky W. Effect of left ventricular assist device outflow conduit anastomosis location on flow patterns in the native aorta. ASAIO journal. 2006;52(2):132–139. doi: 10.1097/01.mat.0000201961.97981.e9. [DOI] [PubMed] [Google Scholar]
- 12.Bazilevs Y, et al. Patient-specific isogeometric fluid–structure interaction analysis of thoracic aortic blood flow due to implantation of the Jarvik 2000 left ventricular assist device. Computer Methods in Applied Mechanics and Engineering. 2009;198(45):3534–3550. [Google Scholar]
- 13.Osorio AF, et al. Computational fluid dynamics analysis of surgical adjustment of left ventricular assist device implantation to minimise stroke risk. Computer methods in biomechanics and biomedical engineering. 2013;16(6):622–638. doi: 10.1080/10255842.2011.629616. [DOI] [PubMed] [Google Scholar]
- 14.Karmonik C, et al. Computational fluid dynamics in patients with continuous-flow left ventricular assist device support show hemodynamic alterations in the ascending aorta. The Journal of thoracic and cardiovascular surgery. 2014;147(4):1326–1333.e1. doi: 10.1016/j.jtcvs.2013.09.069. [DOI] [PubMed] [Google Scholar]
- 15.Chiu W-C, Slepian MJ, Bluestein D. Thrombus Formation Patterns in the HeartMate II VAD-Clinical Observations Can Be Predicted by Numerical Simulations. ASAIO Journal. 2014;60(2):237–240. doi: 10.1097/MAT.0000000000000034. [DOI] [PMC free article] [PubMed] [Google Scholar]
- 16.Chiu W-C, et al. Thromboresistance comparison of the HeartMate II ventricular assist device with the device thrombogenicity emulation-optimized HeartAssist 5 VAD. Journal of biomechanical engineering. 2014;136(2):021014. doi: 10.1115/1.4026254. [DOI] [PMC free article] [PubMed] [Google Scholar]
- 17.Girdhar G, et al. Device thrombogenicity emulation: a novel method for optimizing mechanical circulatory support device thromboresistance. PloS one. 2012;7(3):e32463. doi: 10.1371/journal.pone.0032463. [DOI] [PMC free article] [PubMed] [Google Scholar]
- 18.May-Newman K, et al. Thromboembolism is linked to intraventricular flow stasis in a patient supported with a left ventricle assist device. ASAIO Journal. 2013;59(4):452–455. doi: 10.1097/MAT.0b013e318299fced. [DOI] [PubMed] [Google Scholar]
- 19.Rayz V, et al. Flow residence time and regions of intraluminal thrombus deposition in intracranial aneurysms. Annals of biomedical engineering. 2010;38(10):3058–3069. doi: 10.1007/s10439-010-0065-8. [DOI] [PMC free article] [PubMed] [Google Scholar]
- 20.Cowger J, et al. The development of aortic insufficiency in left ventricular assist device-supported patients. Circulation: Heart Failure. 2010;3(6):668–674. doi: 10.1161/CIRCHEARTFAILURE.109.917765. [DOI] [PMC free article] [PubMed] [Google Scholar]
- 21.Mudd JO, et al. Fusion of aortic valve commissures in patients supported by a continuous axial flow left ventricular assist device. The Journal of Heart and Lung Transplantation. 2008;27(12):1269–1274. doi: 10.1016/j.healun.2008.05.029. [DOI] [PubMed] [Google Scholar]
- 22.Pak S-W, et al. Prevalence of de novo aortic insufficiency during long-term support with left ventricular assist devices. The Journal of Heart and Lung Transplantation. 2010;29(10):1172–1176. doi: 10.1016/j.healun.2010.05.018. [DOI] [PubMed] [Google Scholar]
- 23.Patil NP, et al. De novo aortic regurgitation after continuous-flow left ventricular assist device implantation. The Annals of thoracic surgery. 2014;98(3):850–857. doi: 10.1016/j.athoracsur.2014.05.030. [DOI] [PubMed] [Google Scholar]
- 24.Aggarwal A, et al. The development of aortic insufficiency in continuous-flow left ventricular assist device supported patients. The Annals of thoracic surgery. 2013;95(2):493–498. doi: 10.1016/j.athoracsur.2012.09.020. [DOI] [PubMed] [Google Scholar]
- 25.Martina JR, et al. Analysis of aortic valve commissural fusion after support with continuous-flow left ventricular assist device. Interactive cardiovascular and thoracic surgery. 2013 doi: 10.1093/icvts/ivt263. ivt263. [DOI] [PMC free article] [PubMed] [Google Scholar]
- 26.Rossini L, et al. A clinical method for mapping and quantifying blood stasis in the left ventricle. Journal of biomechanics. 2015;49(11):2152–61. doi: 10.1016/j.jbiomech.2015.11.049. [DOI] [PMC free article] [PubMed] [Google Scholar]
- 27.Martínez-Legazpi P, et al. Contribution of the diastolic vortex ring to left ventricular filling. Journal of the American College of Cardiology. 2014;64(16):1711–1721. doi: 10.1016/j.jacc.2014.06.1205. [DOI] [PubMed] [Google Scholar]
- 28.Du Bois D, Du Bois EF. Clinical calorimetry: tenth paper a formula to estimate the approximate surface area if height and weight be known. Archives of internal medicine. 1916;17(6_2):863–871. [Google Scholar]
- 29.Piccione W. Left ventricular assist device implantation: short and long-term surgical complications. The Journal of heart and lung transplantation. 2000;19(8):S89–S94. doi: 10.1016/s1053-2498(99)00110-2. [DOI] [PubMed] [Google Scholar]
- 30.Shionoya T. STUDIES IN EXPERIMENTAL EXTRACORPOREAL THROMBOSIS II. THROMBUS FORMATION IN NORMAL BLOOD IN THE EXTRACORPOREAL VASCULAR LOOP. The Journal of experimental medicine. 1927;46(1):13–17. doi: 10.1084/jem.46.1.13. [DOI] [PMC free article] [PubMed] [Google Scholar]
- 31.Slepian M, et al. Device thrombogenicity emulation: A novel methodology to predict “Hot Spot” sites of thrombus formation in continuous flow VADs. The Journal of Heart and Lung Transplantation. 2013;32(4):S180. [Google Scholar]
- 32.Falk E, Thuesen L. Pathology of coronary microembolisation and no reflow. Heart. 2003;89(9):983–985. doi: 10.1136/heart.89.9.983. [DOI] [PMC free article] [PubMed] [Google Scholar]
- 33.Al-Saady N, Obel O, Camm A. Left atrial appendage: structure, function, and role in thromboembolism. Heart. 1999;82(5):547–554. doi: 10.1136/hrt.82.5.547. [DOI] [PMC free article] [PubMed] [Google Scholar]
- 34.Kar B, et al. The effect of LVAD aortic outflow-graft placement on hemodynamics and flow: implantation technique and computer flow modeling. Texas Heart Institute Journal. 2005;32(3):294. [PMC free article] [PubMed] [Google Scholar]
- 35.Aliseda A, et al. LVAD Outflow Graft Angle and Thrombosis Risk. ASAIO Journal. :9000. doi: 10.1097/MAT.0000000000000443. Publish Ahead of Print. [DOI] [PMC free article] [PubMed] [Google Scholar]
- 36.Khalafvand S, et al. Fluid-dynamics modelling of the human left ventricle with dynamic mesh for normal and myocardial infarction: preliminary study. Computers in biology and medicine. 2012;42(8):863–870. doi: 10.1016/j.compbiomed.2012.06.010. [DOI] [PubMed] [Google Scholar]
- 37.Chnafa C, Mendez S, Nicoud F. Image-Based Simulations Show Important Flow Fluctuations in a Normal Left Ventricle: What Could be the Implications? Annals of Biomedical Engineering. 2016:1–13. doi: 10.1007/s10439-016-1614-6. [DOI] [PubMed] [Google Scholar]
- 38.Domenichini F, Pedrizzetti G, Baccani B. Three-dimensional filling flow into a model left ventricle. Journal of Fluid Mechanics. 2005;539:179–198. [Google Scholar]


