Abstract
The growing plant cell wall is commonly considered a fiber-reinforced structure whose strength, extensibility and anisotropy depend on the orientation of crystalline cellulose microfibrils, their bonding to the polysaccharide matrix, and matrix viscoelasticity1–4. Structural reinforcement of the wall by stiff cellulose microfibrils is central to contemporary models of plant growth, mechanics, and meristem dynamics4–12. Although passive microfibril reorientation during wall extension has been inferred from theory and from bulk measurements13–15, nm-scale movements of individual microfibrils have not been directly observed. Here we combined nm-scale imaging of wet cell walls by atomic force microscopy (AFM) with a stretching device and endoglucanase treatment that induces wall stress relaxation and creep, mimicking wall behaviors during cell growth. Microfibril movements during forced mechanical extensions differ from those during creep of the enzymatically-loosened wall. In addition to passive angular reorientation, we observed a diverse repertoire of microfibril movements that reveal the spatial scale of molecular connections between microfibrils. Our results show that wall loosening alters microfibril connectivity, enabling microfibril dynamics not seen during mechanical stretch. These insights into microfibril movements and connectivities need to be incorporated into refined models of plant cell wall structure, growth and morphogenesis.
To visualize microfibril movements, we prepared cell-free strips of the outer epidermal wall of onion (Figure 1a) because this material is suitable for both tensile tests14,16,17 and high-resolution AFM imaging of individual microfibrils at the inner (newly deposited) cell wall surface18. AFM also let us assess the wall surface by nanomechanical methods. To modulate wall stress and strain, walls strips were clamped in a custom-made extensometer (Extended Data Figure 1) mounted on the AFM stage. Prior to mounting, the wall was washed gently to remove adherent membranes and cytoplasm and heated for 10 s to inactivate endogenous enzymes, but otherwise was in a near-native state. The wall was submerged under buffer throughout the experiments.
Figure 1. Microfibril reorientations during different modes of cell wall extension.
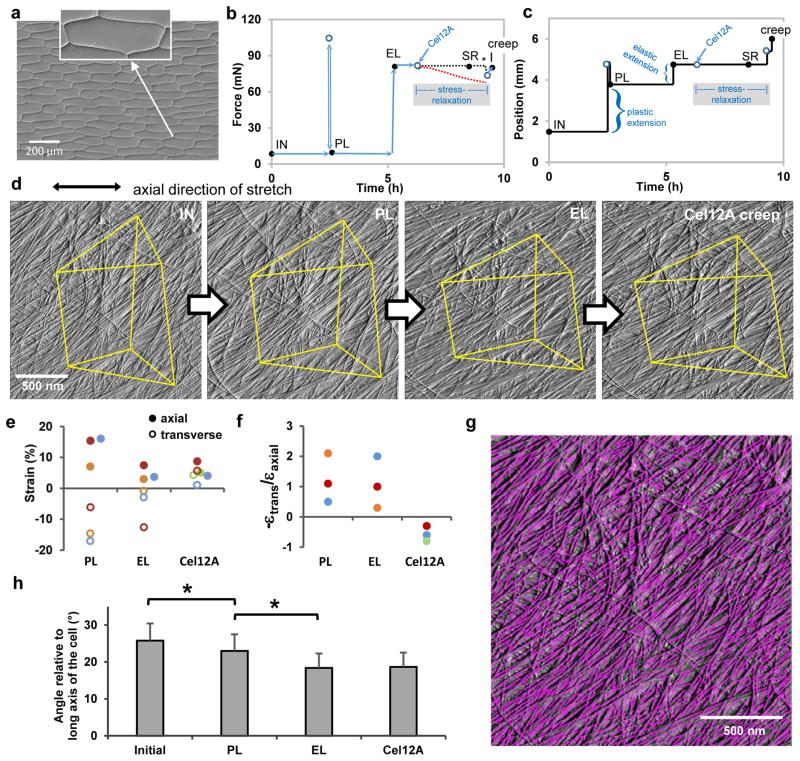
a, Light micrograph (differential interference contrast) of a peeled epidermal wall of onion scale, showing cell outlines. Peeling tears open the cells, leaving only the outer wall. We probed the cell side of the wall by AFM. Inset shows that the cell wall makes tight connections to neighboring cells. Residues of the anticlinal (side) walls are visible as short triangular flanges. b-c, Wall extension protocol showing coupled changes in force (b) and length (c) of wall specimen. AFM images were made at the five points indicated by the black circles: initial (IN, unstretched wall); after plastic (PL) extension; after elastic (EL) extension; after stress relaxation (SR) induced by treatment with Cel12A while cell wall length was held constant (period indicated by the shaded box); and after the cell wall was freed to extend (creep). During stress relaxation the force sensor registers the force applied to the locked movable stage (blacked dotted line), not the force borne by the wall sample which is approximated by the red dotted line (see Methods). At the end of the stress relaxation period, the movable stage is freed to move (*) and the sensor registers the actual force borne by the cell wall. The extensometer is then manually adjusted to restore the elastic holding force to its value before the addition of Cel12A. This accounts for the two closely-spaced points prior to the acquisition of the creep image. d, AFM Peakforce error images showing the same wall surface at four points in the extension series (the Cel12A-relaxed SR image is omitted because it is nearly identical to the elastic EL image; see Extended Data Movie 1). Yellow lines connect stable fiducial marks. e, Average axial and transverse strains measured from distances between 5–10 pairs of vertices (SEMs are 0.2 – 1.8 % strain). Colors are used to match experiment sets; axial strains denoted with solid circles, transverse strain with open circles. Points are offset laterally to improve visibility. f, Negative strain ratios for the three sets of experiments shown in (e). g, Automated detection of microfibrils with SOAX software; ‘snakes’ are colored magenta. h, Mean orientation of snakes (microfibril fragments) at four points in the extension protocol, for three experiments. Error bar = SEM, n = 3. Significant difference at P<0.05 indicated with *.
A well-defined series of axial extensions (Figure 1b,c) resulted in consecutive plastic deformation, elastic deformation, time-dependent stress relaxation and irreversible extension (“creep”) of the wall. This protocol was based on well-established biomechanical behavior of primary cell walls19 (see Methods): Plastic deformation occurs when the wall is stretched beyond its yield point and is gauged as the residual extension after force is re-zeroed (Figure 1b,c). A second extension that does not exceed the first stretch point is reversible, thus elastic (Extended Data Figure 2). Stress relaxation was induced by holding wall length constant and adding Cel12A, a β1,4-endoglucanase that loosens load-bearing junctions between microfibrils20. After a period of stress relaxation, the wall was freed to extend, converting relaxation into wall creep. Cel12A treatment mimics auxin-induced wall loosening21–23, resulting in wall stress relaxation and creep that are essential for cell growth3,24.
AFM images of the same surface (2 × 2 μm) were collected after these sequential steps to follow displacements of the same collection of microfibrils (Figure 1d). This cell wall is a polylamellate structure with cellulose microfibrils (3-nm wide) forming a trellis-like network of bundled microfibrils that are oriented within each lamella in a common direction that shifts by 30–90° between adjacent lamellae18. By close inspection of the images we identified points where two microfibrils intersected without evidence of local microfibril sliding during wall extension. These stable intersections were treated as fiducial marks to calculate μm-scale axial and transverse extensions (strains). To aid visual comprehension of the overall pattern of surface distortions, some of these points are joined by yellow lines in Figure 1d.
Upon plastic and elastic strains, the wall stretched axially and compressed transversely (Figure 1e), resulting in a mean strain ratio (-εtrans/εaxial) of ~1 (Figure 1f). For elastic strains this is called Poisson’s ratio, which ranges from 0 to 0.5 in many polymeric materials. The high value for plant cell walls has been attributed to the arrangement of stiff cellulose microfibrils in the plane of the wall and their relative freedom to reorient16. Transverse compression upon axial extension indicates mechanical coupling between microfibrils, potentially at limited junctions dubbed ‘biomechanical hotspots’20.
To compare these forced mechanical strains with wall yielding catalyzed by wall loosening21, we treated elastically-stretched walls with Cel12A20 to stimulate wall stress relaxation and creep, biophysical processes essential for cell growth3,23,24. During stress relaxation (shaded box in Figure 1b), microfibril movement was negligible at the μm-scale (Extended Data Movie 1). To end the relaxation phase, the locked stage was released and the holding force was manually restored to the elastic setpoint (Figure 1b,c). The enzymatically-loosened wall extended both axially and transversely (Figure 1d,e), resulting in a ratio (-εtrans/εaxial) of approximately −0.5. Negative Poisson’s ratios occur during elastic strain of so-called auxetic materials as a result of honeycomb-like or hinged microstructures25, but in the case of Cel12A action the negative value likely results from mechanical decoupling of microfibrils, freeing them to separate in the direction of applied force while simultaneously releasing the transverse compression that arose during prior elastic extension. Hence, enzymatic loosening alters microfibril connectivity, enabling wall creep via patterns of microfibril movement different from those occurring during forced mechanical extension.
This conclusion is confirmed at the nm-scale by visual inspection of the AFM images which show appreciable angular reorientations of microfibrils after plastic and elastic strains, but not after creep (seen most strikingly by comparing Movies 2–4 in Extended Data). Previous work likewise did not detect altered microfibril angle after creep of cucumber hypocotyl cell walls26. To quantify microfibril orientations by automated analysis we used image analysis software to identify microfibril segments (“snakes”, Figure 1g) and their orientations. Microfibrils progressively realigned in the stretch direction after plastic and elastic extensions, whereas their orientation remained statistically unchanged after Cel12A-induced creep (Figure 1h), despite greater axial strain than transverse strain. These results show that passive microfibril reorientation – the foundation of the multinet growth hypothesis13 – indeed contributes to axial extension and transverse compression when the cell wall is passively stretched by external force, but not during enzyme-mediated creep. The results challenge the idea – often asserted in discussions of cell growth and implicitly inferred by contemporary finite-element models of plant morphogenesis4,7,9–11,27 - that elastic strain is the initial step for cell wall growth. Here we see evidence that wall elasticity and creep employ distinctive microfibril motions.
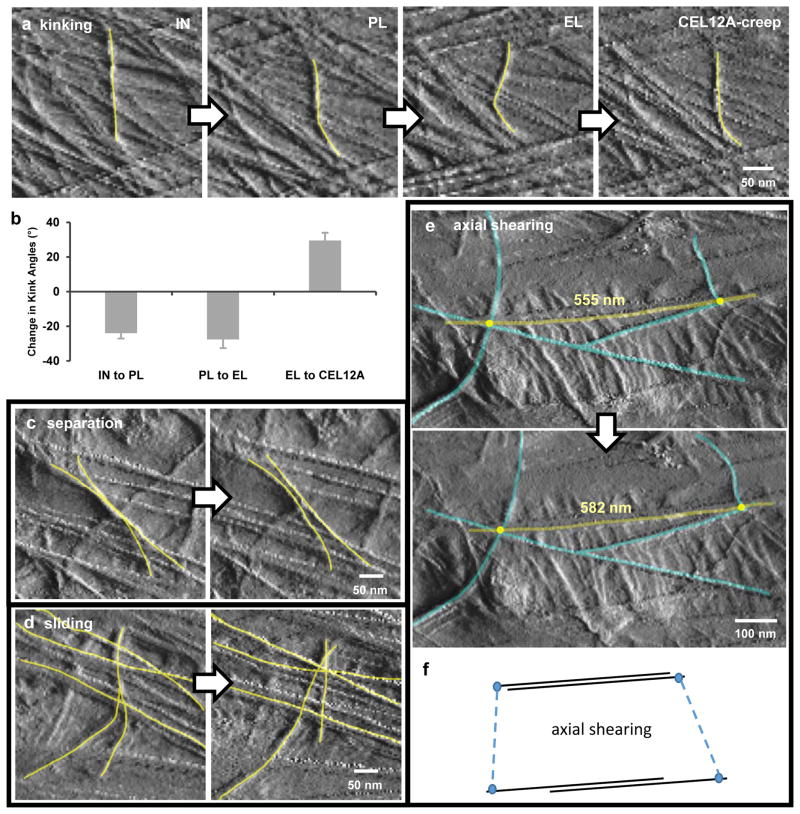
Closer inspection of the AFM images revealed additional clues about how microfibrils are interconnected and anchored in the cell wall: (a) Most microfibril segments in this wall are aggregated into bundles of 2–5 microfibrils18; during plastic and elastic strains the bundles reoriented as cohesive units, reshaping the pliant matrix between the bundles. Lateral bonding between microfibrils within a bundle was evidently stable enough to withstand the shear forces generated during these extensions and when the AFM tip repeatedly scanned the wall surface. (b) The 2–3 lamellae visible in the AFM images deformed coherently, without μm-scale slippage between lamella (although limited slippage was seen at the nm-scale, described below). We take this to mean that adjacent lamellae are firmly connected to each other and are not free to deform individually as dictated by their distinctive microfibril orientations. (c) Microfibrils transverse to the applied axial force became curved or kinked during plastic and elastic extensions (Figure 1d; Figure 2a–b; Movies 2–3 in Extended Data), a result of transverse compression of the wall and the inability of stiff microfibrils to accommodate appreciable compression along the microfibril axis. After Cel12A-induced creep, the kinked microfibrils became straighter, consistent with the action of this enzyme to loosen load-bearing junctions between microfibrils20, reversing the transverse compression imposed during the preceding axial stretch. (d) Lateral shifts of kinked or curved microfibrils indicate that microfibrils are not firmly anchored throughout their length but rather at uneven intervals, roughly estimated from the kinked segments to be ~100–200 nm. Between anchor points the microfibrils appear free to move. This distance may correspond to the spacing of load-bearing junctions in the microfibril network of this cell wall and is similar to the estimated density of binding sites in cell walls for expansins28, the endogenous wall-loosening proteins in plants21. Additional microfibril motions seen in this study include lateral separation of microfibrils (Figure 2c), sliding of microfibrils across one another (Figure 2d), and axial shearing (side-by-side gliding) of aligned microfibrils (Figure 2e,f). These results expand the repertoire of microfibril motions beyond the oft-discussed notion of passive angular reorientation.
Figure 2. Diversity of individual microfibril movements during cell wall extension.
a, AFM Peakforce error images showing the dynamics of microfibril kinking during four points in the extension series. b, Average changes in kink angles between consecutive points in the extension series. Error bar = SEM, 28 ≤ n ≤ 41 from three replicate experiments. All means are significantly different from zero. c, An example of lateral separation of two microfibrils during elastic extension. Note that axially-oriented microfibrils draw closer together, correlating with transverse compression. d, An example of independent motions (sliding and separation) of microfibrils in adjacent lamellae during Cel12A-creep. e, An example of axial shearing (side-by-side gliding) of microfibrils during elastic extension. f, Diagram to clarify axial shearing of microfibrils. In a, c, d and e, yellow lines were added to highlight microfibrils of interest. These four classes of motions were observed during plastic, elastic and Cel12A-induced movements.
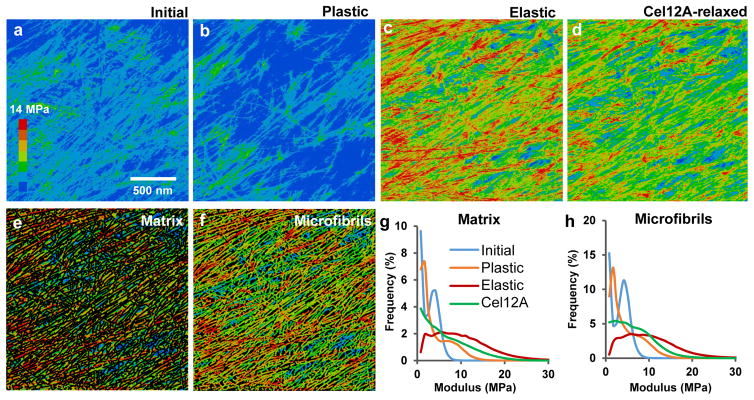
This series of wall extensions was also analyzed by nanomechanical mapping, which assesses local resistance to surface indentation by the AFM tip, quantified as a modulus29. The presence of fibrillar features in the modulus maps (Figure 3a–d) indicates microfibrils resist indentation more than does the matrix. This is due partly to microfibril stiffness and partly to microfibril support by the underlying matrix and by contacts with other microfibrils. After plastic deformation the modulus map changes, becoming more heterogeneous, accentuating microfibrils and deemphasizing the matrix (Figure 3b). Plastic deformation evidently rearranges local internal stresses and interactions between matrix polymers and microfibrils. Matrix softening is evidenced by higher correlation between modulus and height after plastic deformation (Extended Data Figure 3).
Figure 3. Modulus maps of cell wall surface after different modes of extension.
a–d, Heat maps of indentation modulus of the cell wall surface at four points in the extension series, collected in Peakforce tapping mode simultaneously with the images in Figure 1d. Color scale at left (step size = 2 MPa). Note that the modulus of axially aligned microfibrils is particularly reduced after Cel12A relaxation, indicating nonhomogeneous stress relaxation at the nanoscale. Modulus values increase when the holding force is restored (Extended Data Figure 5). e, Modulus map of the matrix component of the image in c, obtained by blacking out microfibrils identified with SOAX. f, Modulus map of the microfibril component of the image in c, identified by SOAX software. g, Histograms of the modulus distribution for the matrix for images a–d. h, Histograms of the modulus distribution for the microfibrils during four extension points shown in a–d. Note the y-axes in g and h differ by a factor of two and that values of 0–1 MPa are not graphed because of scaling issues; see Extended Data Figure 4 for an example of the complete distribution). This experiment was replicated three times with similar results. IN: Initial; PL: Plastic; EL: Elastic.
When the wall was elastically extended at a constant holding force, the indentation modulus increased markedly across the whole surface (Figure 3c), demonstrating that surface lamellae contribute to wall mechanics in these experiments. We liken this mechanical response to the lateral stiffening of a guitar string or drumhead upon tensioning. We used image-analysis software to segregate microfibrils and matrix into separate modulus maps (Figure 3e,f) and to derive separate histograms of modulus distributions (Figure 3g,h). The histograms confirm the visual impressions that the modulus values increase when the wall is tensioned and that microfibrils have a higher indentation modulus than the matrix. This latter point is evidenced in Figure 3g,h by ~2X higher proportion of microfibril pixels with modulus >1 MPa compared with matrix (see also Extended Data Figure 4). Note that indentation modulus depends on wall structure and differs from the tensile modulus of cellulose30, which is ~100 GPa. Both microfibrils and matrix stiffen when the wall is tensioned, suggesting that both components bear in-plane tensile stress. Another possibility is that the matrix alone bears tensile stress and the increased microfibril modulus results from firmer support of the matrix. However, infrared spectroscopy of stretched onion walls indicates that cellulose bears some tensile stress17. Since the matrix in this wall is predominately pectin, our AFM results support the idea that pectic polysaccharides contribute to cell wall mechanics7,8. Finally, when the wall strip was treated with Cel12A but temporarily held at constant length to permit wall stress relaxation, the indentation modulus decreased in a heterogeneous pattern (Figure 3d), indicating an uneven nanoscale pattern of relaxation. When the elastic force was restored, modulus values increased in a heterogeneous pattern (Extended Data Figure 5). These patterns provide further evidence of the 100–200 nm scale of microfibril connectivity.
Our results revealed that microfibril movements in the primary cell wall are strikingly different for extensions motivated by applied forces versus selective wall loosening. How microfibril motions observed here compare with those in-vivo is uncertain because similar nano-scale studies are not feasible in living cells with current methods. These experiments required removal of the living cell, replacement of turgor-generated wall stresses with uniaxial forces, and replacement of endogenous wall-loosening catalysts with an endoglucanase that mimics loosening caused by auxin20,22,23. Living cells may influence microfibril movements and connectivity by additional means. One revealing artefact in these experiments was the microfibril kinking that resulted from uniaxial extension and concomitant transverse compression. We used this kinking artefact as a means to assess microfibril anchoring, rather than to infer movements in-vivo. Nonetheless, microfibril kinking potentially occurs in-vivo under some circumstances, e.g. when gravitropic bending causes wall contractions. The principal lesson learned here, that mechanically-motivated patterns differ from those mediated by wall loosening, is very likely to apply in-vivo as well. Because plant cells may loosen and stiffen their cell walls in multiple ways, additional insights may be gleaned from further work to characterize microfibril motions at the nanoscale.
This approach could be extended to explore the action of wall-loosening catalysts with other mechanisms of action21 and to investigate the nanoscale underpinnings of microfibril connectivity for more insightful models that connect wall mechanics to cell growth, morphogenesis and wall integrity sensing. These ideas may also be applicable to the mechanics of other fiber-reinforced biomaterials, such as collagen-based tissues, where, like the plant cell wall, both mechanical and enzymatic factors modulate biomechanical properties.
METHODS
Preparation of cell walls and mounting on the AFM extensometer
An epidermal strip, 30 mm long x 5 mm wide, was excised from the abaxial side of the fifth scale of fresh white onion (Allium cepa, cv. Cometa) purchased from a local grocery. As described previously18, the outer epidermal walls detached from the rest of the epidermal cells as a large sheet (Figure 1a), uncovering the wall surface adjacent to the plasma membrane. From photographs of the epidermal surface before and after peeling, we found no evidence that peeling distorted cell shape, other than a small axial shrinkage (~2.5%), presumably due to turgor loss. We used the abaxial epidermis because, unlike the adaxial epidermis, its outer wall readily detaches from the rest of cells.
The epidermal strip was cut so as to leave a thin trapezoidal prism of parenchyma cells remaining at the two ends, with the cuticle side being the widest base. This helped to orient the wall strip and to keep it from rolling. The long axis of the peel was parallel to the long axis of the epidermal cells and was the stretch direction. The strip was washed in 10 mL of 20 mM HEPES buffer, pH 7.0 with 0.1% Tween-20 for 30 min, then dipped in boiling water for 10 s to inactivate endogenous wall enzymes and expansins. The sample was mounted on a glass slide (75 mm × 25 mm) with the innermost wall surface facing up and wetted with 20 mM sodium acetate buffer, pH 4.5. With the fixed and movable stages of the extensometer (Extended Data Figure 1) brought into contact (position 0 mm), the epidermal strip was gently transferred onto the stages with tweezers, aligned to extend the long axis, and wrinkles and air bubbles were removed. The two ends (5 mm) were blotted dry and secured with cyanoacrylate glue (#GPMR6069, Great Planes, USA) onto the two stages and cover slips (cut to 5×10 mm), leaving 20 mm between the fixed ends. Cyanoacrylate accelerator (Great Planes, USA) was used to cure the glue immediately. The epidermal strip was kept moist throughout the transfer and fixing process and was completely submerged under buffer throughout the extension and imaging process. The extensometer stage with the cell wall strip was mounted under the AFM scanner head and a liquid column was formed between the AFM probe and the sample by addition of acetate buffer. The imaged region was 7 mm from the fixed end. Visual inspection indicated that transverse mechanical constraint by the fixed ends was limited to regions <2 mm from the glued ends.
AFM imaging and nanomechanical analysis
AFM images were collected with a Dimension Icon AFM (Bruker, CA, USA) with ScanAsyst in Peakforce Tapping mode and with Quantitative Nanomechanical Property Mapping (QNM). The AFM tip had a radius of ~1.5 nm and a spring constant between 0.2 and 0.7 N/m (see18 for details).
Cell wall extensions
Our protocol for extending the onion wall was distilled from previous studies of plant cell wall biomechanics which showed that large unilateral mechanical extension includes an irreversible (plastic) component and a reversible (elastic) component31–33 and that wall-loosening by Cel12A22 mimics the in-vivo wall-loosening effects of auxin treatment34. Our tests (Extended Data Figure 2) confirmed that the macro-scale mechanical behavior of these onion epidermal strips is similar to that reported for other growing cell walls.
Initial slack in the wall strip was removed by extending the sample until a holding force of 5 mN was reached. An initial (IN) AFM image (2 μm × 2 μm) was collected at this point and the specimen was then extended to a holding force of 100 mN, followed by return to a force of 5 mN, with only partial recovery of the initial length (Figure 1b,c). The initial image area was located and a second AFM image (PL) was collected. The sample was extended a second time until the holding force reached 80 mN and a third AFM image (EL) of the initial area was collected. Parallel experiments showed this second extension to be reversible and thus elastic (Extended Data Figure 2). Thereafter the moveable stage (connected to the force sensor) was locked to hold the sample at constant length and 30 μg/ml Cel12A in 20 mM sodium acetate buffer (pH 4.5) was added to the cell wall sample to induce stress relaxation. Endoglucanase Cel12A – which can hydrolyze both xyloglucan and cellulose and thereby loosen key cellulose-cellulose junctions20,21 - was expressed in Escherichia coli Rosseta-gami (DE3; Novagen), and purified as described20. After 2.5 h of Cel12A treatment at constant wall length, a fourth AFM image (Cel12A-relaxed) was collected. Thereafter the moveable stage was released, enabling the force sensor to register the reduced holding force on the wall sample and the wall to lengthen. The stage was slowly extended to restore the holding force to 80 mM, followed by a fifth AFM image (Cel12A creep) of the initial area. We estimated that the applied axial forces in this experiment are similar to the value for the axial component of turgor-induced wall tension (turgor x cross-sectional area of the 5-mm wide strip of epidermal cell wall = 108 mN; this assumes turgor pressure of 0.6 MPa and epidermal cell depth measured as 36 μm; it also assumes that the axial force is largely borne by the outer epidermal wall because it is >10x thicker than the inner walls; tissues tensions are not included in the calculation; if they exist, they would increase forces on the outer epidermal wall).
From the two step changes in length after stress relaxation (Figure 1c), we estimate that the reduction in force measured after the moveable stage was released (Figure 1b) was ~half of the actual force decay during the relaxation period. From this estimate and from the kinetics of Cel12A action (Extended Data Figure 2), we estimated the force decay with the red broken line in Figure 1b.
AFM imaging of the same cell wall area for the full experimental series was technically challenging because of time-dependent fouling of the AFM tip or loss of support under the imaged area. The experiment was successfully repeated three times using a total of four wall samples: The full five-image series was carried out with two samples; a third sample was used for the first three imaged points and a fourth sample was used for the last three imaged points. These data sets are shown in different colors in Figure 1e,f.
Image analysis
AFM images were exported in TIFF format by Nanoscope Analysis (v 1.5). To remove shift due to sample movement during wall extension or thermal drift during AFM imaging, sets of images were aligned by the ImageJ plugin StackReg35. To calculate axial or transverse strains from the AFM images, the axial or transverse distances between five to ten pairs of stable (nonsliding) microfibril vertices were measured in ImageJ for each set of experiments. To analyze microfibril orientation, microfibrils were automatically detected by SOAX software36 as ‘snakes’ (segments), which are active contours represented by a series of points that align along the intensity ridges of the image. The SOAX parameters were manually adjusted, using a snake point separation of 0.7–1 pixel. The orientation histogram was calculated by evaluating snake orientation over 8 snake points for more than 28,000 snakes per image. Since long snakes contribute to the orientation histogram in proportion to their length, the contribution of short snakes in noisy parts of the image was negligible. The snakes were cut at detected snakes junctions36 prior to evaluating their orientation, to eliminate the very small contribution of sharp angle changes at intersections. The mean snake orientations were compared at each time point by paired t-test from three sets of experiments. Kink angles of microfibrils were measured by the ‘Angle’ tool of ImageJ.
To identify axial shearing (side-by-side gliding) between aligned or bundled microfibrils, we looked for microfibrils with two vertices where three microfibrils intersect (Figure 2e). When axial shearing occurs during extension, the three microfibrils should still intersect at the vertices and the distance between the two vertices should increase. Candidates for axial shearing were excluded when evidence of microfibril sliding at the vertices was seen (e.g. the three microfibrils no longer intersected at a common point after extension). The microfibrils were traced on an iPad (Apple) with the “Forge” software app. Color coded or grayscale DMT modulus images were exported with Nanoscope software (v 1.5; Bruker). To analyze the response of microfibrils and matrix separately, we used profiles of microfibril segments generated by SOAX from the Peakforce error images that were collected simultaneously with the modulus images. After blacking out 4-pixel wide snakes detected by SOAX, which correspond to the microfibrils in the modulus images, the residual modulus image represents the matrix. Subtracting the matrix image from the original modulus image gave the information for microfibrils. Histograms of the grayscale modulus images were then generated in ImageJ to analyze the stiffness responses of microfibrils and matrix to wall extension.
Data availability
The data that support the finding of this study are available from the corresponding author upon request.
Extended Data
Extended Data Figure 1. Extensometer design and axial extension of onion walls.
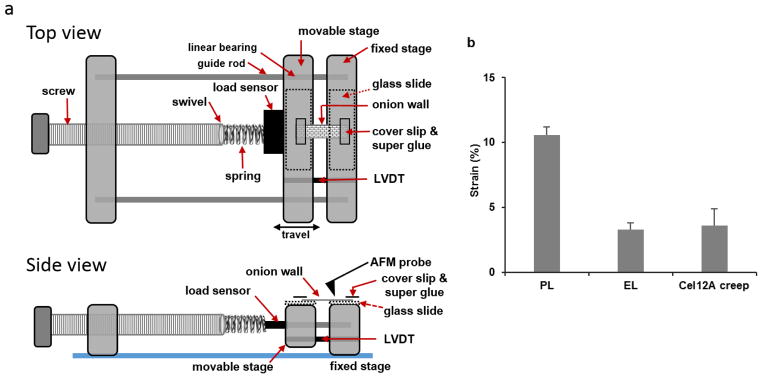
a, Schematic design of the AFM extensometer. Glass slides (75 mm × 25 mm) were fixed on top of the Plexiglas stages to provide a smooth, flat surface to support the wall specimen. Extension was measured by a linear variable differential transformer (LVDT, Microstrain NC-DVRT-2.5; LORD Corp.) attached to the movable stage whose displacement was controlled by a screw, connected to the stage by a spring and a load sensor (LSB200; Futek Inc.) that measured the tensile force applied to the wall. A swivel connects the spring to the screw, allowing the screw to rotate freely. Position and force were recorded with a USB Data Acquisition Module and QuickDAQ software (Data Translation). The positions at selected time points were used to calculate whole-wall strains. At high holding forces, the moveable stage tended to bind or lock in position. This locking feature was used to implement stress relaxation conditions (constant holding length) prior to addition of Cel12A. At the end of the relaxation period, the binding of the movable stage was gently released, coupling position and force again (and resulting in slight wall extension and restoration of nominal holding force). For AFM measurements the AFM probe was lowered onto the PCW surface ~7 mm from the glued coverslip on the fixed stage. b, Average axial strains of onion epidermal strips measured by the position sensor: PL: plastic initial length; EL: elastic plastic length; Cel12A creep: length after Cel12A creep elastic length. Error bar = SE, n=3.
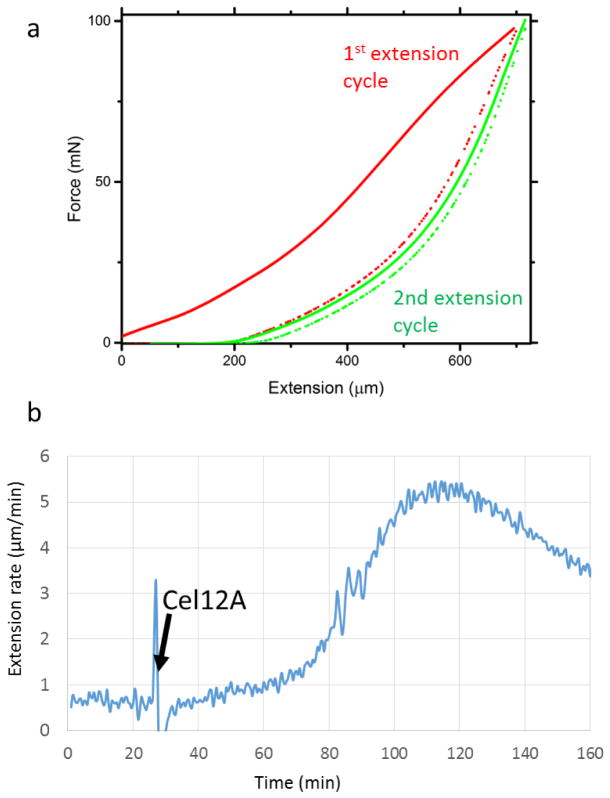
Extended Data Figure 2. Representative macroscopic behavior of onion epidermal cell wall strips during two force-extension cycles (a) and after endoglucanase Cel12A addition in a constant-force creep experiment (b).
(a) shows that the second extension is reversible (elastic) and the first extension results in plastic extension (approximately 200 μm in this example). Force-extension curves of this type are typical of primary cell walls31–34. (b) shows that addition of Cel12A stimulated onion wall creep after a lag of 30–40 min. Similar creep responses were reported for cucumber and Arabidopsis walls20. Experimental conditions: Onion epidermal wall strips (3 mm wide) were prepared as described in Methods (including 10-s heat inactivation), and incubated in 20 mM sodium acetate buffer, pH 4.5. In (a) the wall strip (3 mm between clamps) was stretched in two cycles at a rate of 3 mm/min until a holding force of 98 mN was reached. In (b) the epidermal was clamped at a constant force of 98 mN. At the time indicated by the arrow the buffer was exchanged for one containing 1 μg/mL Cel12A. These two experiments were carried out at least 3 times with similar results.
Extended Data Figure 3. Increased correlation between height and modulus values after plastic and elastic extensions.
a, A height map (false colored red) collected simultaneously with b, a DMT modulus map (false colored green). Height maps of these cell walls emphasize microfibrils over matrix18, so height correlates with the probability that a pixel is located on a microfibril. c, Merged a and b maps generated by co-localization with RG2B an ImageJ plugin, (http://rsb.info.nih.gov/ij/plugins/rg2bcolocalization.html), with co-localization indicated in lavender. d, Pearson’s Correlation Coefficient between modulus and height values at initial, plastic and elastic points in the extension series. The images were split into nine grids for larger statistical sampling. Means with different letters (A, B, C) indicate significant differences (One way ANOVA followed by Tukey test, P < 0.01, n = 27). Correlation increased after plastic extension and decreased during elastic extension, indicating the matrix is softer after the first extension, leading to more prominent microfibril features in the modulus map. The Pearson’s correlation coefficient was calculated by JACoP, an ImageJ plugin (https://imagej.nih.gov/ij/plugins/track/jacop.html).
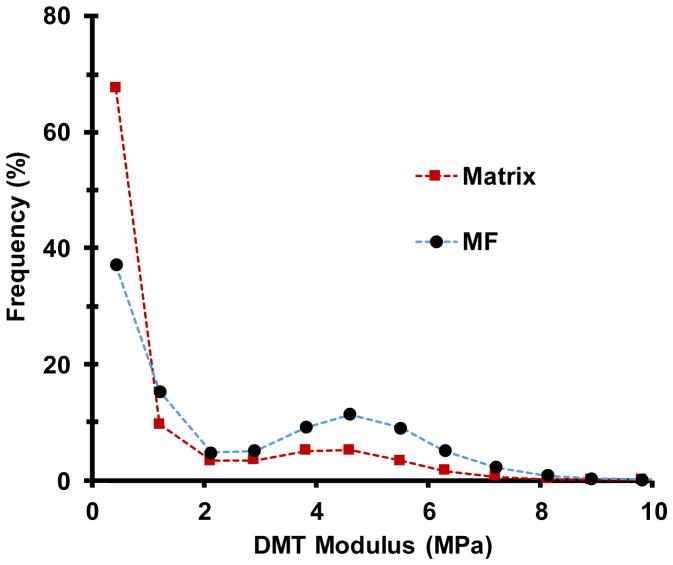
Extended Data Figure 4. Distribution of indentation modulus for pixels assigned to microfibril and matrix categories, for an unstretched (initial) onion cell wall.
The complete histogram shows the frequency of DMT modulus values (bin size = 0.78 MPa) for a single image measured by Bruker Nanoscope software. The dotted lines are provided for graphical use and not intended to imply a continuous variable. Points are plotted at the midpoint of each bin interval. This distribution is representative of three images.
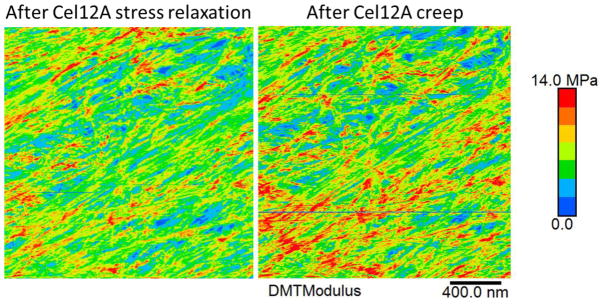
Extended Data Figure 5. Comparison of indentation modulus maps of the same onion wall surface after Cel12A stress relaxation (left) and Cel12A creep (right).
The higher modulus in the right image is a result of restoring of the wall holding force to the original value of 80 mN. Representative of three replicates.
Supplementary Material
The movie alternately displays Peakforce error images of the same cell wall surface area captured during elastic extension (frame labeled EL) and after Cel12A stress relaxation (no label). Some microfibrils disappear from the Cel12A-relaxed image, but are seen in the height map, indicating they lost their tight binding to the wall surface. The width of the image is 1.94 μm. Representative of three replicates.
Hollow arrow heads point to separating microfibrils and solid arrow heads point to cross-sliding microfibrils. Red arrows point to kinked/bent microfibrils. Yellow dots mark vertices where microfibrils intercept. The distance between these vertices were used to calculate the axial shearing (side-by-side gliding) between microfibrils. Representative of three replicates.
Solid arrow heads point to cross-sliding microfibrils. Red arrows point to kinked/bent microfibrils. Yellow dots mark vertices where microfibrils intercept. The distance between these vertices were used to calculate the axial shearing (side-by-side gliding) between microfibrils. Representative of three replicates.
White arrow heads point to cross-sliding microfibrils. Green arrows point to microfibril kinks that were reduced after Cel12A creep. Kink microfibrils become straighter. Some microfibrils disappear from the Cel12A-creep image, but are seen in the height map, indicating they lost their tight binding to the wall surface. Representative of three replicates.
Acknowledgments
This work was supported as part of The Center for LignoCellulose Structure and Formation, an Energy Frontier Research Center funded by the U.S. Department of Energy, Office of Science, Basic Energy Sciences under Award # DE-SC0001090. D.V. was supported by NIH grant R01GM098430. We thank Edward Wagner, Xuan Wang, Sarah Kiemle and Yong Bum Park for technical assistance.
Footnotes
Supplementary Information is available in the online version of the paper.
Author Contributions T.Z. carried out the AFM experiments and analyzed the data. D.V. assisted with SOAX analysis of microfibril orientations. D.M.D. designed and built the AFM extensometer. D.J.C. designed the research and analyzed the data. T.Z., D.J.C. and D.V. wrote the manuscript.
The authors declare no competing financial interests.
Readers are welcome to comment on the online version of the paper.
References
- 1.Burton RA, Gidley MJ, Fincher GB. Heterogeneity in the chemistry, structure and function of plant cell walls. Nature Chem Biol. 2010;6:724–732. doi: 10.1038/nchembio.439. [DOI] [PubMed] [Google Scholar]
- 2.Baskin TI. Anisotropic expansion of the plant cell wall. Annu Rev Cell Dev Biol. 2005;21:203–222. doi: 10.1146/annurev.cellbio.20.082503.103053. [DOI] [PubMed] [Google Scholar]
- 3.Cosgrove DJ. Growth of the plant cell wall. Nature Reviews. Molecular Cell Biology. 2005;6:850–861. doi: 10.1038/nrm1746. [DOI] [PubMed] [Google Scholar]
- 4.Bidhendi AJ, Geitmann A. Relating the mechanics of the primary plant cell wall to morphogenesis. J Exp Bot. 2016;67:449–461. doi: 10.1093/jxb/erv535. [DOI] [PubMed] [Google Scholar]
- 5.Louveaux M, Julien JD, Mirabet V, Boudaoud A, Hamant O. Cell division plane orientation based on tensile stress in Arabidopsis thaliana. Proc Natl Acad Sci U S A. 2016;113:E4294–4303. doi: 10.1073/pnas.1600677113. [DOI] [PMC free article] [PubMed] [Google Scholar]
- 6.Sampathkumar A, et al. Subcellular and supracellular mechanical stress prescribes cytoskeleton behavior in Arabidopsis cotyledon pavement cells. eLife. 2014;3:e01967. doi: 10.7554/eLife.01967. [DOI] [PMC free article] [PubMed] [Google Scholar]
- 7.Braybrook SA, Jonsson H. Shifting foundations: the mechanical cell wall and development. Current Opinion in Plant Biology. 2016;29:115–120. doi: 10.1016/j.pbi.2015.12.009. [DOI] [PubMed] [Google Scholar]
- 8.Peaucelle A, et al. Pectin-induced changes in cell wall mechanics underlie organ initiation in Arabidopsis. Current Biology. 2011;21:1720–1726. doi: 10.1016/j.cub.2011.08.057. [DOI] [PubMed] [Google Scholar]
- 9.Kierzkowski D, et al. Elastic domains regulate growth and organogenesis in the plant shoot apical meristem. Science. 2012;335:1096–1099. doi: 10.1126/science.1213100. [DOI] [PubMed] [Google Scholar]
- 10.Bassel GW, et al. Mechanical constraints imposed by 3D cellular geometry and arrangement modulate growth patterns in the Arabidopsis embryo. Proc Natl Acad Sci U S A. 2014 doi: 10.1073/pnas.1404616111. [DOI] [PMC free article] [PubMed] [Google Scholar]
- 11.Yanagisawa M, et al. Patterning mechanisms of cytoskeletal and cell wall systems during leaf trichome morphogenesis. Nat Plants. 2015;1:15014. doi: 10.1038/nplants.2015.14. [DOI] [PubMed] [Google Scholar]
- 12.Nakayama N, et al. Mechanical regulation of auxin-mediated growth. Current Biology. 2012;22:1468–1476. doi: 10.1016/j.cub.2012.06.050. [DOI] [PubMed] [Google Scholar]
- 13.Preston RD. The case for multinet growth in growing walls of plant cells. Planta. 1982;155:356–363. doi: 10.1007/BF00429465. [DOI] [PubMed] [Google Scholar]
- 14.Suslov D, Verbelen JP, Vissenberg K. Onion epidermis as a new model to study the control of growth anisotropy in higher plants. J Exp Bot. 2009;60:4175–4187. doi: 10.1093/jxb/erp251. [DOI] [PubMed] [Google Scholar]
- 15.Anderson CT, Carroll A, Akhmetova L, Somerville C. Real-time imaging of cellulose reorientation during cell wall expansion in Arabidopsis roots. Plant Physiology. 2010;152:787–796. doi: 10.1104/pp.109.150128. [DOI] [PMC free article] [PubMed] [Google Scholar]
- 16.Hepworth DG, Bruce DM. Relationships between primary plant cell wall architecture and mechanical properties for onion bulb scale epidermal cells. J Texture Stud. 2004;35:586–602. doi: 10.1111/j.1745-4603.2004.35511.x. [DOI] [Google Scholar]
- 17.Wilson RH, et al. The mechanical properties and molecular dynamics of plant cell wall polysaccharides studied by Fourier-transform infrared spectroscopy. Plant Physiology. 2000;124:397–405. doi: 10.1104/pp.124.1.397. [DOI] [PMC free article] [PubMed] [Google Scholar]
- 18.Zhang T, Zheng Y, Cosgrove DJ. Spatial organization of cellulose microfibrils and matrix polysaccharides in primary plant cell walls as imaged by multichannel atomic force microscopy. Plant J. 2016;85:179–192. doi: 10.1111/tpj.13102. [DOI] [PubMed] [Google Scholar]
- 19.Burgert I, Keplinger T. Plant micro- and nanomechanics: experimental techniques for plant cell-wall analysis. J Exp Bot. 2013;64:4635–4649. doi: 10.1093/jxb/ert255. [DOI] [PubMed] [Google Scholar]
- 20.Park YB, Cosgrove DJ. A revised architecture of primary cell walls based on biomechanical changes induced by substrate-specific endoglucanases. Plant Physiol. 2012;158:1933–1943. doi: 10.1104/pp.111.192880. [DOI] [PMC free article] [PubMed] [Google Scholar]
- 21.Cosgrove DJ. Catalysts of plant cell wall loosening. F1000Research. 2016;5 doi: 10.12688/f1000research.7180.1. [DOI] [PMC free article] [PubMed] [Google Scholar]
- 22.Yuan S, Wu Y, Cosgrove DJ. A fungal endoglucanase with plant cell wall extension activity. Plant Physiol. 2001;127:324–333. doi: 10.1104/pp.127.1.324. [DOI] [PMC free article] [PubMed] [Google Scholar]
- 23.Schopfer P. Biomechanics of plant growth. Amer J Bot. 2006;93:1415–1425. doi: 10.3732/ajb.93.10.1415. [DOI] [PubMed] [Google Scholar]
- 24.Hamant O, Traas J. The mechanics behind plant development. New Phytologist. 2010;185:369–385. doi: 10.1111/j.1469-8137.2009.03100.x. [DOI] [PubMed] [Google Scholar]
- 25.Greaves GN, Greer AL, Lakes RS, Rouxel T. Poisson’s ratio and modern materials. Nature Materials. 2011;10:823–837. doi: 10.1038/nmat3134. [DOI] [PubMed] [Google Scholar]
- 26.Marga F, Grandbois M, Cosgrove DJ, Baskin TI. Cell wall extension results in the coordinate separation of parallel microfibrils: evidence from scanning electron microscopy and atomic force microscopy. Plant Journal. 2005;43:181–190. doi: 10.1111/j.1365-313X.2005.02447.x. [DOI] [PubMed] [Google Scholar]
- 27.Fayant P, et al. Finite element model of polar growth in pollen tubes. Plant Cell. 2010;22:2579–2593. doi: 10.1105/tpc.110.075754. [DOI] [PMC free article] [PubMed] [Google Scholar]
- 28.Park YB, Cosgrove DJ. Xyloglucan and its interactions with other components of the growing cell wall. Plant Cell Physiol. 2015;56:180–194. doi: 10.1093/pcp/pcu204. [DOI] [PubMed] [Google Scholar]
- 29.Milani P, Braybrook SA, Boudaoud A. Shrinking the hammer: micromechanical approaches to morphogenesis. J Exp Bot. 2013;64:4651–4662. doi: 10.1093/jxb/ert169. [DOI] [PubMed] [Google Scholar]
- 30.Eichhorn SJ. Stiff as a Board: Perspectives on the Crystalline Modulus of Cellulose. Acs Macro Lett. 2012;1:1237–1239. doi: 10.1021/Mz300420k. [DOI] [PubMed] [Google Scholar]
- 31.Spatz H, Kohler L, Niklas KJ. Mechanical behaviour of plant tissues: composite materials or structures? J Exp Biol. 1999;202:3269–3272. doi: 10.1242/jeb.202.23.3269. [DOI] [PubMed] [Google Scholar]
- 32.Cleland RE. The Instron Technique as a Measure of Immediate-Past Wall Extensibility. Planta. 1984;160:514–520. doi: 10.1007/Bf00411139. [DOI] [PubMed] [Google Scholar]
- 33.Abasolo W, et al. Pectin may hinder the unfolding of xyloglucan chains during cell deformation: Implications of the mechanical performance of Arabidopsis hypocotyls with pectin alterations. Molecular Plant. 2009;2:990–999. doi: 10.1093/Mp/Ssp065. [DOI] [PubMed] [Google Scholar]
- 34.Cleland R. A Separation of Auxin-Induced Cell Wall Loosening into its Plastic and Elastic Components. Physiologia Plantarum. 1958;11:599–609. doi: 10.1111/j.1399-3054.1958.tb08255.x. [DOI] [Google Scholar]
- 35.Thevenaz P, Ruttimann UE, Unser M. A pyramid approach to subpixel registration based on intensity. IEEE Trans Image Process. 1998;7:27–41. doi: 10.1109/83.650848. [DOI] [PubMed] [Google Scholar]
- 36.Xu T, et al. SOAX: a software for quantification of 3D biopolymer networks. Sci Rep. 2015;5:9081. doi: 10.1038/srep09081. [DOI] [PMC free article] [PubMed] [Google Scholar]
Associated Data
This section collects any data citations, data availability statements, or supplementary materials included in this article.
Supplementary Materials
The movie alternately displays Peakforce error images of the same cell wall surface area captured during elastic extension (frame labeled EL) and after Cel12A stress relaxation (no label). Some microfibrils disappear from the Cel12A-relaxed image, but are seen in the height map, indicating they lost their tight binding to the wall surface. The width of the image is 1.94 μm. Representative of three replicates.
Hollow arrow heads point to separating microfibrils and solid arrow heads point to cross-sliding microfibrils. Red arrows point to kinked/bent microfibrils. Yellow dots mark vertices where microfibrils intercept. The distance between these vertices were used to calculate the axial shearing (side-by-side gliding) between microfibrils. Representative of three replicates.
Solid arrow heads point to cross-sliding microfibrils. Red arrows point to kinked/bent microfibrils. Yellow dots mark vertices where microfibrils intercept. The distance between these vertices were used to calculate the axial shearing (side-by-side gliding) between microfibrils. Representative of three replicates.
White arrow heads point to cross-sliding microfibrils. Green arrows point to microfibril kinks that were reduced after Cel12A creep. Kink microfibrils become straighter. Some microfibrils disappear from the Cel12A-creep image, but are seen in the height map, indicating they lost their tight binding to the wall surface. Representative of three replicates.
Data Availability Statement
The data that support the finding of this study are available from the corresponding author upon request.


