

Abstract
The soluble cytokine tumor necrosis factor-α (TNF-α) is an important target for many therapeutic proteins used in the treatment of rheumatoid arthritis. Biologics targeting TNF-α exert their pharmacologic effects through binding and neutralizing this cytokine and preventing it from binding to its cell surface receptors. The magnitude of their pharmacologic effects directly corresponds to the extent and duration of free TNF-α suppression. However, endogenous TNF-α is of low abundance, so it is quite challenging to assess the free TNF-α suppression experimentally. Here we have applied an experimental approach to bypass this difficulty by giving recombinant human TNF-α (rhTNF-α) to rats by s.c. infusion. This boosted TNF-α concentration enabled quantification of TNF-α in plasma. Free rhTNF-α concentrations were measured after separation from the infliximab-rhTNF-α complex using Dynabeads Protein A. The interrelationship of infliximab and TNF-α was assessed with minimal physiologically based pharmacokinetic models for TNF-α and infliximab with a target-mediated drug disposition component. Knowledge of TNF-α pharmacokinetics allows reliable prediction of the free TNF-α suppression with either free or total TNF-α concentration profiles. The experimental and modeling approaches in our study may aid in the development of next-generation TNF-α inhibitors with improved therapeutic effects.
Introduction
Proinflammatory soluble cytokines, including tumor necrosis factor-α (TNF-α), are key players in the pathogenesis of rheumatoid arthritis (RA). These cytokines, along with immune cells, form an interconnected network. In inflammatory conditions, these cytokines exhibit elevated and sustained expression, and their production is dysregulated (Buchan et al., 1988). TNF-α is at the apex of this network and fulfills its mission through binding to its cell surface receptors, activating downstream inflammatory response cascades and promoting expression of other cytokines (Fong et al., 1989). Previous work showed that blocking TNF-α itself led to substantial inhibitory effects on the expression of other proinflammatory cytokines (Brennan et al., 1989) and reduced leukocyte trafficking into the joints (Taylor et al., 2000), thus highlighting the importance of TNF-α as a therapeutic target for the treatment of RA (Monaco et al., 2015).
Anti-TNF-α therapy is now the standard of care for RA. The TNF-α antagonists, including infliximab, etanercept, and adalimumab, alone or in combination with methotrexate, are quite efficacious in the treatment of RA (Upchurch and Kay, 2012). The great success of current anti-TNF-α biologics has triggered efforts in seeking new biologic agents targeting TNF-α with improved features using advanced protein engineering techniques. Biologics targeting TNF-α exert their pharmacologic effects through binding and neutralizing this cytokine and preventing it from binding to its cell surface receptors. The magnitude of their pharmacologic effects directly corresponds to the extent and duration of free TNF-α suppression. Quantitative characterization of the mechanistic cascades that lead to TNF-α suppression by therapeutic proteins would help in better understanding the exposure–response relationship, thus aiding identification of desired pharmacokinetic (PK) and target-binding features for next generation anti-TNF-α biologic agents.
TNF-α, as a soluble cytokine protein, exhibits rapid turnover, with a plasma half-life in minutes. This feature leads to substantial accumulation of TNF-α in circulation when biologics bind to TNF-α as a carrier and increases its retention time in blood. In such cases, receptor occupancy obtained based on the PK of the biologic alone does not correlate with the duration of TNF-α suppression. The target-mediated drug disposition (TMDD) kinetics (Mager, 2006) characterizing the interaction between anti-TNF-α agents and their targets serve as an alternative to assess TNF-α suppression.
The second-generation minimal physiologically based pharmacokinetic (mPBPK) models with implemented TMDD features proposed and assessed by Cao and Jusko (Cao et al., 2013; Cao and Jusko, 2014a) offer a suitable modeling platform to assess the PK of monoclonal antibodies (mAbs) and other therapeutic proteins as well as their interplay with antigenic targets in either plasma or tissues. With essential components for mAb PK inherited from full PBPK models, the mPBPK model is structured in an anatomic manner with plasma, lymph, and lumped tissue compartments. Paravascular convection and lymph drainage are the dominant pathways for mAb movement from plasma to tissue sites and return to plasma. Tissue interstitial space is assumed to be the major extravascular distribution space.
Of importance, TMDD features can be readily implemented in both plasma and tissues for assessment of the mAb interaction with antigenic targets. In addition, the physiologic and anatomic layouts of the mPBPK model allow it to be feasibly overlaid with other PBPK models, thus enabling assessment of two or more protein compounds and their interactions. We have previously applied such models for the characterization of the suppression of interleukin-6 (IL-6) by an anti-IL-6 mAb in serum as well as in joint synovial fluid in collagen-induced arthritic (CIA) mice (Chen et al., 2016).
Our present study examined the interaction of infliximab and TNF-α in rats and applied mPBPK models to quantitatively describe the time-course of TNF-α suppression by infliximab. To fully characterize the TMDD kinetics, measurements of both infliximab and TNF-α are required. However, the low abundance of endogenous TNF-α makes its measurement technically challenging (Manicourt et al., 1993; Gratacos et al., 1994). To overcome this problem, we administered recombinant human TNF-α (rhTNF-α) to the rats as an infusion, which boosted the baseline of TNF-α and enabled its quantification. Infliximab is a chimeric mAb and does not cross-react with rodent TNF-α, so interference with endogenous rat TNF-α was avoided.
Materials and Methods
Test Articles.
Infliximab (Janssen Biotech, Horsham, PA) was first reconstituted with 10 ml of sterile water at 10 mg/ml, and was further diluted with sterile saline when needed. The reconstituted infliximab was stored at 2–8°C before use. We obtained rhTNF-α (cat. no. 210-TA-02M/CF) from R&D Systems (Minneapolis, MN), which was reconstituted with sterile phosphate-buffered saline solution (pH 7.4) containing 0.1% bovine serum albumin at 2 mg/ml. The reconstituted rhTNF-α was stored in aliquots at −80°C before use.
Animals.
Male Lewis rats (300 g) were purchased from Harlan (Indianapolis, IN). The animals were housed individually in the university laboratory animal facility and acclimatized for 1 week with free access to food and water at constant environmental conditions (22°C, 72% humidity, and 12-hour light/dark cycles). All animal study protocols followed the Principles of Laboratory Animal Care (NRC, 1996) and were approved by the University at Buffalo Institutional Animal Care and Use Committee.
Assays.
Infliximab concentrations in plasma were measured using an anti-human IgG enzyme-linked immunosorbent assay (ELISA) kit (Bethyl Laboratories, Montgomery, TX), as previously described elsewhere (Lon et al., 2012). The lack of interference of TNF-α in infliximab measurements was confirmed by setting up in vitro plasma samples containing infliximab together with various concentrations of rhTNF-α. The concentrations of infliximab in the in vitro plasma samples were set to match the lower and higher end of infliximab PK profiles in the animal studies.
Plasma concentrations of rhTNF-α were assayed with the human TNF-α Quantikine HS ELISA kit (R&D Systems) following the instructions of the manufacturer. The standard curve was fitted to a four-parameter logistic model (range: 0.5–32 pg/ml). Between-assay variability was tested with quality control samples (2 and 20 pg/ml) prepared by adding rhTNF-α to blank rat plasma, and was typically less than 15%. The cross-species reactivity was minimal with rat plasma.
Dynabeads Protein A (Life Technologies, Grand Island, NY) was used to remove infliximab and infliximab-bound TNF-α and thus obtain free rhTNF-α in the plasma samples. These magnetic beads have Protein A (a bacterial protein with strong binding affinity to IgG) covalently coupled to their surface. The capacity of Dynabeads Protein A (30 mg/ml) is approximately 8 μg human IgG per mg beads; infliximab in both free and bound forms binds tightly in this matrix. Aliquots of the beads (100 µl) were transferred to 0.5-ml microfuge tubes, and separation achieved using a magnetic rack. After the buffer solution was removed, plasma samples of 50 µl were added into the tube and incubated for 10 minutes with gentle rotation at room temperature. After incubation, the tube was placed on the magnet rack, and the supernatant containing only free rhTNF-α was collected for quantification. Assay optimization and validation were performed by running a set of blank plasma samples containing infliximab (2 μg/ml) with various volumes of Dynabeads Protein A and testing the obtained supernatants for residual infliximab.
Animal Study.
The PK of infliximab in healthy Lewis rats (i.v. at 1 and 10 mg/kg) were previously examined in our laboratory. Lewis rats (n = 2) received an i.v. bolus dose of infliximab at 0.1 mg/kg, and serial blood samples were collected at 0.5, 2, 5, and 10 hours, and 1, 2, 4, 6, and 10 days from the saphenous vein under short-term anesthesia by inhalation of 3% isoflurane and at 14 days from the abdominal aorta by exsanguination upon sacrifice.
Another group of rats (n = 6) were used for assessing the suppression of rhTNF-α by infliximab. Animals received an i.v. bolus dose of infliximab (0.1 mg/kg). In addition s.c. infusion of rhTNF-α at 117.4 μg/kg per day for 48 hours began at the time of infliximab injection, using the Alzet micro-osmotic pumps (Model 1003D, infusion rate 1 μl/hour; Durect Corporation, Cupertino, CA). The pumps were implanted into a skin pocket on the animals’ back under isoflurane anesthesia. The rats were monitored for allergic or toxic reactions, and rectal temperatures were recorded periodically. Serial blood samples were collected at 2, 5, 7, 10, 13, 16, 20, 25, and 35 hours from the saphenous vein under short-term anesthesia by inhalation of 3% isoflurane, and at 40 and 48 hours from the abdominal aorta by exsanguination upon sacrifice. Three animals were sampled for blood at each time point. Blood samples were immediately centrifuged at 2000g, 4°C, for 15 minutes. The plasma fraction was aliquoted and stored at −80°C.
Mathematical Modeling.
To quantitatively capture the interrelationship between infliximab and rhTNF-α in plasma, a stepwise modeling strategy was performed. The PK of infliximab and rhTNF-α were first characterized with mPBPK models, and then both mPBPK models were combined and TMDD kinetic features added to assess the suppression of rhTNF-α by infliximab. The PK-related parameters for infliximab estimated from the initial modeling step and for rhTNF-α obtained from our companion study (Chen et al., 2017) were fixed in the subsequent model fitting for assessment of the interaction of infliximab and rhTNF-α.
The PK of infliximab was captured with the second-generation mPBPK model. We assessed the mean concentration-time profiles of infliximab at 1 and 10 mg/kg and naïve-pooled concentration–time profiles of infliximab at 0.1 mg/kg in plasma. The model includes plasma, lymph, and two lumped tissue compartments connected in an anatomic manner, as shown in Fig. 1 (Cao et al., 2013). Clearance of infliximab is assumed from the systemic circulation. The model is described as:
 |
(1) |
 |
(2) |
 |
(3) |
 |
(4) |
where Cp_D is the plasma concentration of infliximab in Vp (plasma volume); Ctight and Cleaky are interstitial fluid (ISF) concentrations of infliximab in two types of lumped tissues categorized by the leakiness of vasculature, Vtight (0.65 • ISF • Kp, where Kp is the available fraction of ISF for antibody distribution) and Vleaky (0.35 • ISF • Kp) are ISF volumes of the two lumped tissues; Vlymph is the lymph volume, which equals blood volume; L is the total lymph flow rate and L1 and L2 account for 1/3 and 2/3 of the total lymph flow; σ1 and σ2 are vascular reflection coefficients for leaky and tight tissues; σL is the lymphatic capillary reflection coefficients and is assumed to be 0.2; and CLmAb is the linear clearance of infliximab.
Fig. 1.

Second-generation mPBPK model for characterization of infliximab plasma PK. Symbols are defined in Table 1.
The PK of rhTNF-α was previously described by Chen et al. (2017) with an extended first-generation mPBPK model and a semimechanistic model for s.c. absorption. The model structure (Fig. 2) as well as the parameter values that were estimated were then used as shown here. The s.c. absorption kinetics are:
 |
(5) |
 |
(6) |
 |
(7) |
 |
(8) |
where Add, ALym, AOT1, and AOT2 are the amounts of rhTNF-α at the s.c. injection site, lymph, and two transit compartments (OT1 and OT2); VLym is the lymph volume and equals blood volume; La is the lymph flow rate measured by thoracic duct cannulation (0.6 ml/h; Kojima et al., 1988); kaL and kaO are absorption rate constants for rhTNF-α for lymph uptake and other routes; Kmax and KD50 represent the saturable presystemic degradation at the s.c. injection site; and kinf is the s.c. infusion rate.
Fig. 2.

Extended first-generation mPBPK model for characterization of rhTNF-α plasma PK and s.c. absorption kinetics. Model includes the absorption site, lymph, plasma, and two transit compartments (OT1 and OT2) for the characterization of rhTNF-α s.c. absorption and plasma compartment (Vp), two types of tissue compartments (V1 and V2), and the kidney (Vk) for the characterization of rhTNF-α distribution and disposition. Symbols are defined in Table 1.
The amount of rhTNF-α entering the systemic circulation (Input) is:
 |
(9) |
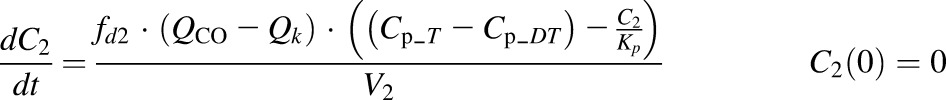
Plasma PK of rhTNF-α are:
 |
(10) |
 |
(11) |
 |
(12) |
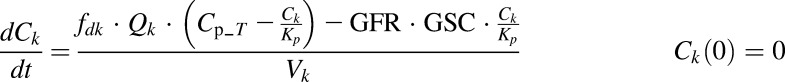 |
(13) |
where Cp_T, C1, C2, and Ck are concentrations of rhTNF-α in plasma (Vp), two tissue interstitial fluid (ISF) compartments (V1 and V2), and kidney ISF (Vk); QCO is cardiac plasma output; Qk is the kidney plasma flow; fd1 and fd2 are the fractions of QCO for V1 and V2; fdk is the fraction of Qk for Vk; Kp is the tissue partition coefficient; GFR is the glomerular filtration rate, GSC is the glomerular sieving coefficient, and Vmax and Km terms account for the nonlinear elimination.
In the last step, the second- and first-generation mPBPK models were overlaid, and the TMDD component was included in the plasma (Fig. 3). The model includes infliximab plasma PK (section A), rhTNF-α plasma PK (section B), rhTNF-α s.c. absorption kinetics (section C), and the interrelationship between infliximab and rhTNF-α (section D). All PK-related parameters of infliximab and rhTNF-α were fixed. Plasma concentration–time profiles of total infliximab and free rhTNF-α were applied for simultaneous model fitting. Together with eqs. 5–9, the model is:
 |
(14) |
 |
(15) |
 |
(16) |
 |
(17) |
 |
(18) |
 |
(19) |
 |
(20) |
 |
(21) |
where Cp_fD is the free infliximab concentration in plasma; Cp_DT is the concentration of the infliximab-rhTNF-α complex; kint is the elimination rate constant for infliximab-rhTNF-α complex; and other symbols are as previously defined.
Fig. 3.

Conjoined mPBPK models for infliximab and rhTNF-α with TMDD features implemented to assess the interrelationship between infliximab and rhTNF-α. Overall model structure includes: plasma PK of infliximab in section A, plasma PK and s.c. absorption kinetics of rhTNF-α in sections B and C, and interrelationship between infliximab and rhTNF-α in section D. Symbols are defined in Table 1.
The model assumes that the infliximab-rhTNF-α complex will distribute into tissues in the same manner as free infliximab, and returns to plasma from tissues as free infliximab. This assumption is based on the fact that infliximab is largely diluted in tissues and the complex will thus dissociate. Also, the proteases that are present in the ISF space are expected to be constantly degrading the rhTNF-α freed from the dissociation of the complex.
Long-term rhTNF-α infusion caused mild fever and inflammatory reactions in the animals, which led to increased plasma clearances of infliximab and the infliximab-rhTNF-α complex. Therefore, CLmAb and kint were described with sigmoid functions to account for acute changes over a short time:
 |
(22) |
 |
(23) |
where CLmAb_ctrl and CLmAb_dis are the infliximab plasma clearances in healthy and TNF-α induced inflammation conditions; kint_ctrl and kint_dis are the elimination rate constants for infliximab-rhTNF-α complex in healthy and TNF-α induced inflammation conditions; and Tdis represents the time when TNF-α induced inflammation occurs.
Assuming quasi-equilibrium conditions, Cp_fD is (Gibiansky et al., 2008):
 |
(24) |
The Kss is the steady-state constant defined as:
 |
(25) |
where the kon and koff refer to the binding association and dissociation rate constants of infliximab with rhTNF-α. The binding association rate constant (kon) of infliximab was fixed to 105 M−1 ⋅ S−1 (Kim et al., 2007; Song et al., 2008). Then Cp_DT can be described as:
 |
(26) |
The free rhTNF-α concentration (Cp_sfT) measured in plasma samples is:
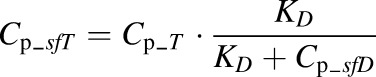 |
(27) |
where KD is the binding dissociation constant defined as:
 |
(28) |
The KD instead of Kss was applied for representation of free rhTNF-α concentration in plasma because plasma samples taken from animals are considered in vitro environments for the interaction of rhTNF-α and infliximab. The free concentration of infliximab is:
 |
(29) |
Data Analysis.
Noncompartmental analysis was performed with WinNonlin 6.1 (Phoenix; Pharsight Corporation, Palo Alto, CA). The areas under the concentration–time curves of infliximab in plasma were estimated by the trapezoidal rule. All model fittings were performed with the ADAPT 5 computer program (Biomedical Simulations Resource; USC, Los Angeles, CA). Data were naïve pooled and fitted using the maximum likelihood algorithm. The variance model was defined as:
where Vi is the variance of the ith observation, σ1 and σ2 are additive and proportional variance model parameters, and Yi is the ith model prediction. The model performance was assessed by goodness-of-fit plots and the Akaike Information Criterion values. Graphs were generated with the GraphPad Prism (GraphPad Software, San Diego, CA).
Results
Analysis of Infliximab and rhTNF-α.
Infliximab concentrations in plasma were assayed by ELISA. The concurrent presence of rhTNF-α, which binds to infliximab, could possibly interfere with infliximab measurements. To test this, blank plasma samples were prepared containing known concentrations of infliximab and rhTNF-α. The measured infliximab concentrations in the presence of rhTNF-α were consistent with the known infliximab concentrations present in the sample (data not shown), demonstrating that rhTNF-α does not affect the ELISA measurement of infliximab.
Free rhTNF-α in plasma was separated using Dynabeads Protein A. The Protein A coated on the magnetic beads binds to the Fc-region of human mAbs with high affinity, so it can be applied to remove infliximab in either free or rhTNF-α bound forms. Although the Dynabeads have a large capacity for removing human IgG (8 μg per mg beads), Protein A also binds to different forms of rodent IgGs that are present in the rat plasma samples with great abundance. Our assay optimization showed that a volume 100 μl of Dynabeads could efficiently remove over 95% of infliximab at a concentration of 2 μg/ml from 50 μl of rat plasma.
Quantification of total rhTNF-α was attempted with acid/alkaline dissociation approaches (Salimi-Moosavi et al., 2010), but failed due to low recovery (<10%). TNF-α exists as homotrimer in the biologic fluid but can dissociate into monomers at higher temperatures, acidic pH, and in the presence of nonionic detergents or surfactants (Smith and Baglioni, 1987; Corti et al., 1992; Poiesi et al., 1993). Also, the activity of TNF-α is sensitive to pH and is rapidly destroyed outside the pH range 5.5–10.0 (Haranaka et al., 1986). Acid/alkaline dissociation approaches require extreme pH conditions and lead to dissociation of the trimeric form of TNF-α or loss of activity, which likely explained the observed low recovery.
Plasma Pharmacokinetics of Infliximab.
Noncompartmental analysis showed that infliximab exhibited linear PK in healthy rats across the dosage range of 0.1–10 mg/kg. The second-generation mPBPK model was applied to describe the plasma PK of infliximab. The model-fitted plasma concentrations of infliximab were overlaid with experimental measurements as shown in Fig. 4. The parameter estimates are listed in Table 1, section A. Overall, the model well captured the plasma concentration–time profiles of infliximab at all doses. The estimated vascular reflection coefficients of tight and leaky tissue (σ2 and σ2) are 0.96 and 0.48, respectively, which correspond well to most therapeutic mAbs (Cao and Jusko, 2014b) and suggest modest tissue distribution. The plasma clearance of infliximab (CLmAb_ctrl) is 0.069 ml/h, which translates to an elimination half-life around 3.8 days in rats.
Fig. 4.

Infliximab concentration versus time profiles in plasma after i.v. administration at 0.1, 1.0, and 10.0 mg/kg. Symbols are observed concentrations, and lines depict model-fitted profiles.
TABLE 1.
Summary of model parameters and estimates
| Parameter (Units) | Definition | Estimate | CV% |
|---|---|---|---|
| Section A: Plasma PK of infliximaba | |||
| σ1 | Vascular reflection coefficient of tight tissue | 0.9650 | 13.1 |
| σ2 | Vascular reflection coefficient of leaky tissue | 0.4806 | 24.0 |
| CLmAb_ctrl (ml/h) | Plasma clearance before Tdis | 0.06934 | 14.3 |
| CLmAb_dis (ml/h)b | Plasma clearance after Tdis | 3.463 | 4.79 |
| Section B: Plasma PK of rhTNF-αc | |||
| fd1 | Fraction of (QCO − Qk) for V1 | 0.6663 | |
| fd2 | Fraction of (QCO − Qk) for V2 | 0.007463 | |
| fdk | Fraction of Qk for Vk | 0.8 | |
| Kp | Partition coefficient | 0.5172 | |
| V1 (ml) | ECF volume for tissue compartment 1 | 13.10 | |
| Vmax (ng/h) | Michaelis-Menten capacity constant | 3152 | |
| Km (ng/ml) | Michaelis-Menten affinity constant | 31.72 | |
| GSC | Glomerular sieving coefficient | 0.1031 | |
| fd1 | Fraction of (QCO − Qk) for V1 | 0.6663 | |
| Section C: s.c. absorption of rhTNF-αc | |||
| kaO (1/h) | First-order absorption rate constant via other routes | 0.4114 | |
| kaL (1/h) | First-order absorption rate constant via lymph | 0.0007969 | |
| Kmax (ng/h) | Maximum degradation capacity at dose depot | 899.9 | |
| KD50 (ng) | Dose amount causing 50% of Kmax | 137.0 | |
| kaO (1/h) | First-order absorption rate constant via other routes | 0.4114 | |
| Section D: Interaction between infliximab and rhTNF-α | |||
| kint_ctrl (1/h) | Elimination rate constant of the complex before Tdis | 0.01979 | 6.70 |
| kint_dis (1/h) | Elimination rate constant of the complex after Tdis | 9.300 | 14.8 |
| Tdis (h) | Time when rhTNF-α induced changes occurred | 7.474 | 2.92 |
| KD (nM) | Binding dissociation constant | 0.4297 | 7.84 |
| Physiologic values for rats (280 g)d | |||
| Vp (ml) | Plasma volume | 9.06 | |
| VECF (ml) | Tissue extracellular fluid (ECF) volume | 48.72 | |
| QCO (ml/h) | Cardiac plasma output flow | 2945 | |
| Qk (ml/h) | Renal plasma flow | 365 | |
| Vk (ml) | Kidney ECF volume | 0.361 | |
| GFR (ml/h) | Glomerular filtration rate | 78.6 | |
| Vlymph (ml) | Lymph volume | 16.47 | |
| L (ml/h) | Lymph flow rate | 1.86 |
Parameters related to PK of infliximab were estimated first and fixed for model assessment of infliximab and rhTNF-α interactions.
Parameter estimated during the model assessment of infliximab and rhTNF-α interactions.
Parameters related to PK of rhTNF-α obtained from previous studies fixed for model assessment of infliximab and rhTNF-α interactions.
Literature sources: all parameter values except GFR were from Shah and Betts (2012), and GFR values are from Davies and Morris (1993).
Interrelationship between Infliximab and rhTNF-α.
To assess interactions between infliximab and rhTNF-α and examine free rhTNF-α suppression by the drug, infliximab and rhTNF-α were dosed concurrently by i.v. bolus and s.c. infusion, respectively. The s.c. infusion of rhTNF-α allowed continuous introduction of rhTNF-α into plasma, which resembles the production of endogenous TNF-α but at much higher rates. The rats were monitored for signs of inflammatory reactions after rhTNF-α administration and exhibited mild fever at 5 to 10 hours.
Comparison of the plasma concentration–time profiles of infliximab at 0.1 mg/kg alone and with concurrent dosing of rhTNF-α as shown in Fig. 5 showed a dramatic decline of infliximab concentrations after 5 to 10 hours in rats receiving s.c. infusion of rhTNF-α. This indicates a rapid increase of plasma clearance of infliximab, which is likely due to the pathophysiologic changes (inflammatory reactions or immunogenicity) after rhTNF-α administration.
Fig. 5.

Plasma concentration versus time profiles of infliximab in animals receiving infliximab alone and with concurrent rhTNF-α s.c. infusion. Symbols are the individual and lines the model-fitted infliximab plasma concentrations.
On the other hand, the plasma concentration-time profile of rhTNF-α exhibited multiphasic characteristics (Fig. 6). The free rhTNF-α 1) showed a rapid increase during the initial phase due to the s.c. infusion as well as the substantial accumulation of total rhTNF-α upon binding to infliximab; 2) reached a steady state starting from 5 to 10 hours, which is likely attributed to the rapid increase of infliximab-rhTNF-α complex clearance and the resulting faster elimination of total rhTNF-α; and 3) increased rapidly again at ∼16 hours, eventually reaching a new steady state because infliximab was almost all cleared from plasma.
Fig. 6.

Plasma concentration versus time profiles of infliximab and free rhTNF-α in animals receiving an i.v. bolus of infliximab and s.c. infusion of rhTNF-α. Symbols are observed concentrations, and lines depict model-fitted concentration profiles.
The second- and first-generation mPBPK models for infliximab and rhTNF-α were joined, and the TMDD component was implemented in the plasma to examine the interrelationship of the two compounds. The concurrent treatment with rhTNF-α led to rapid elimination of infliximab starting from 5 to 10 hours, which could be possibly attributed to pathophysiologic changes (inflammatory reaction and/or immunogenicity) induced by rhTNF-α s.c. infusion. The model accounted for the change in clearance of infliximab as well as formation of a binding complex as reflected in their sigmoidal functions. The tissue distribution of infliximab was also likely altered corresponding to the pathophysiologic changes. However, because changes in infliximab PK occurred several hours after dosing, it is challenging to identify a change in tissue distribution from the PK profile, as the initial phase of the profile was compromised. Therefore, we assumed that tissue distribution of infliximab remains constant. The model also assumed no change on rhTNF-α PK, as suggested by previous reports that high dose rhTNF-α infusions show stationary PK (Greischel and Zahn, 1989).
The model-fitted concentration–time profiles of infliximab and rhTNF-α were overlaid with the experimental measurements. In general, the model well captured the infliximab plasma concentration profile as well as the trend of the free rhTNF-α concentration curve, but it showed an overestimation of free rhTNF-α at the early time points. Because the change in clearances of infliximab and its binding complex occurred quite early, the data are rather limited at the initial phase of the PK profiles for precise characterization of the binding and disposition of infliximab before the change of clearances happened.
The parameter estimates are listed in Table 1. The estimated time when rhTNF-α-induced pathophysiologic changes occurred (Tdis) is 7.5 hours, corresponding with the time window when fever was observed. The plasma clearance of infliximab after Tdis (CLmAb_dis) is 3.46 ml/h, which is a 50-fold increase in comparison with that (CLmAb_ctrl) before Tdis. On the other hand, the elimination rate constants of infliximab-rhTNF-α complex (kint) before and after Tdis are 0.020 and 9.3 hours−1 (kint_ctrl and kint_dis), which translate to the plasma clearances of 0.18 and 84 ml/hour and suggest an increase by 500-fold. The clearance of the complex in healthy conditions resembles the clearance of infliximab (0.18 versus 0.07 ml/hour), whereas in the case of rhTNF-α-induced changes, the clearance of the complex is closer to the clearance of rhTNF-α (84 versus 100 ml/hour). This explains the accumulation of total rhTNF-α and the rapid rise of free rhTNF-α at the beginning, but more sustained rhTNF-α suppression at later times when bound rhTNF-α was also quickly eliminated. The estimated KD value is 0.43 nM, which agrees well with the literature-reported affinity measurements for infliximab (Kim et al., 2007; Song et al., 2008).
Discussion
Soluble proinflammatory cytokines, including TNF-α, IL-1, and IL-6, are targets of many therapeutic proteins for the treatment of RA. The magnitude of the pharmacologic response of therapeutic proteins directly correlates with free cytokine suppression. The soluble cytokines commonly exhibit rapid turnover rates and short plasma half-lives (in minutes). Therapeutic proteins targeting soluble cytokines lead to free cytokine suppression but also serve as carriers, extending their plasma retention and causing substantial accumulation of total cytokines. In such cases, the duration and extent of free cytokine suppression do not correspond with the receptor occupancy; rather, requires quantitative understanding of the interplay of cytokines with therapeutic proteins using PK/pharmacodynamic modeling approaches is required.
The interaction between cytokines and therapeutic proteins can be quantitatively characterized with PK/pharmacodynamic modeling when PK measurements of both the protein drugs and the cytokine targets are available (Wang et al., 2014; Chen et al., 2016). However, measurement of TNF-α is extremely challenging.
First, endogenous TNF-α is present at low abundance (Manicourt et al., 1993; Gratacos et al., 1994), and binding to infliximab will further lead to the lowering of the free rhTNF-α concentrations. This causes difficulties in TNF-α quantification with most commercially available assay kits, which do not meet the high sensitivity requirements. Our study provides a means to bypass this difficulty by giving the animals rhTNF-α through s.c. infusion. This boosted TNF-α concentration enables quantification of TNF-α in plasma. More importantly, doses of rhTNF-α through systemic infusion can be adjusted to resemble the differences of TNF-α exposure in plasma and tissue sites.
Assessing the tissue distribution and suppression of TNF-α by therapeutic proteins at the site of action is usually technically more demanding, and PK measurements at the tissue sites are subject to large variabilities. By providing an infusion of rhTNF-α, it is possible to examine the suppression of TNF-α in blood. In addition, infliximab has minimal binding affinity to rat TNF-α, so there will be low interference of rat endogenous TNF-α with infliximab binding.
Second, the measurements of total and free TNF-α are fairly difficult, especially when specific capture and detection antibodies for free and total TNF-α are not available. Therefore, pretreatments to dissociate bound TNF-α and/or separate free TNF-α are required before the bioanalytical assays. The dissociation methods are dependent on the relative denaturation and stability of therapeutic proteins and the ligand (Salimi-Moosavi et al., 2010). The TNF-α is more sensitive to pH, temperature, and surfactants compared with infliximab (Smith and Baglioni, 1987; Corti et al., 1992; Poiesi et al., 1993), so acid/alkaline treatments produce substantial loss of TNF-α and yield low recoveries.
Several approaches are available for free ligand separation, including molecular sieving, solid-phase extraction, and affinity separations with Protein A/G resin columns (Lee et al., 2011; Wang et al., 2014). All these methods cause sample dilution, which leads to the shift of the binding equilibrium and will bias the measurement of free ligand (Lee et al., 2011). Our study applied the Dynabeads Protein A for separation of free TNF-α. This method is very rapid, requires small sample volumes, and, most importantly, minimizes sample dilution, which makes it a useful approach for free ligand separation from mAb-bound complex.
The first- and second-generations of mPBPK models provide suitable modeling platforms for smaller proteins such as cytokines and other therapeutic proteins. Here we have extended the applications of mPBPK modeling by combining the two mPBPK models to assess the interaction of the mAb and the cytokine. The mPBPK models are constructed in an anatomic manner and use physiologic volume and flows for drug PK behaviors, thus enabling the assessment of the interaction of two or more molecules with distinctive tissue distributions and elimination properties.
The step-wise modeling strategy was applied by characterizing the PK of infliximab and rhTNF-α independently and applying the information in the subsequent assessment of their interrelationship. The data set includes the PK of infliximab and rhTNF-α as well as their interaction, which are subject to different degrees of variability. Having PK-related parameters estimated first allowed characterization of infliximab binding and disposition with rhTNF-α (Chen et al., 2017).
Only free rhTNF-α concentration profiles were applied for model fitting and yielded reasonable estimates of the KD values consistent with literature reports. In many cases, free and total ligand concentration profiles are not both available, and it is questionable whether a reliable prediction can be obtained when only free or total ligand profiles are applied for model fitting. As discussed by Zheng et al. (2015), when only free or total ligand concentrations are available, knowledge of either the free ligand turnover rate or the in vivo KD value would allow better prediction of free ligand suppression. A priori knowledge of TNF-α PK is fairly important for characterizing free TNF-α suppression by mAbs, especially because total TNF-α quantification is extremely challenging.
The s.c. infusion of rhTNF-α at a relatively high dose resulted in pathophysiologic changes in the rats. Therefore, to characterize the suppression of free TNF-α we must consider the impact of these disturbances on the PK of infliximab and rhTNF-α. A dramatic increase in infliximab and the binding complex clearances was observed. Our data do not reflect the suppression of endogenous TNF-α with infliximab, probably due to the aforementioned pathophysiologic changes; a lower dose might avoid this change. Despite this, the data are informative regarding the impact of the relative clearance time scales of infliximab, TNF-α, and the formed complex on the pattern of free TNF-α suppression. When the complex clearance is close to the clearance of infliximab (before Tdis), free TNF-α rapidly returns to baseline with substantial accumulation of total TNF-α. This is likely to represent TNF-α suppression in plasma where TNF-α is rapidly cleared while infliximab and complex are sustained for longer times. On the other hand, when the complex clearance is similar to the clearance of TNF-α (after Tdis), the duration of free TNF-α suppression is prolonged, which resembles the situation in tissues where both TNF-α and complex are assumed to be eliminated by lymph drainage.
In conclusion, the present study provides an experimental approach to examine the interrelationship between anti-TNF-α therapeutic proteins and endogenous TNF-α of low abundance in vivo by giving the animal an infusion of TNF-α that boosts the baseline of TNF-α. The PK of infliximab and TNF-α were assessed with the first- and second-generation mPBPK models for TNF-α and infliximab with a TMDD component. Knowledge of TNF-α PK allows reliable assessment of the free TNF-α suppression with either free or total TNF-α concentration profiles. The first- and second-generation mPBPK models developed for rhTNF-α and infliximab were overlaid with a TMDD component in the plasma compartment to examine the interaction of TNF-α and infliximab. This modeling framework could serve for extrapolation purposes with other TNF-α antagonists, with substitution of their binding parameters for the ligands along with the independent measurements or predictions of the PK of the mAb and the PK of the ligand. However, this remains to be directly examined and proven experimentally.
Abbreviations
- CL
clearance
- ELISA
enzyme-linked immunosorbent assay
- GFR
glomerular filtration rate
- GSC
glomerular sieving coefficient
- IL
interleukin
- ISF
interstitial fluid
- mAb
monoclonal antibody
- mPBPK
minimal physiologically based pharmacokinetic model
- PK
pharmacokinetics
- RA
rheumatoid arthritis
- rhTNF-α
recombinant tumor necrosis factor-α
- TMDD
target-mediated drug disposition
- TNF-α
tumor necrosis factor-α
Authorship Contributions
Participated in research design: Chen, DuBois, Almon, Jusko.
Conducted experiments: Chen, DuBois.
Performed data analysis: Chen, Jusko.
Wrote or contributed to the writing of the manuscript: Chen, DuBois, Almon, Jusko.
Footnotes
This work was supported by the National Institutes of Health National Institute of General Medical Sciences, [Grant GM24211] and by the UB Center for Protein Therapeutics.
References
- Brennan FM, Chantry D, Jackson A, Maini R, Feldmann M. (1989) Inhibitory effect of TNF alpha antibodies on synovial cell interleukin-1 production in rheumatoid arthritis. Lancet 2:244–247. [DOI] [PubMed] [Google Scholar]
- Buchan G, Barrett K, Turner M, Chantry D, Maini RN, Feldmann M. (1988) Interleukin-1 and tumour necrosis factor mRNA expression in rheumatoid arthritis: prolonged production of IL-1 alpha. Clin Exp Immunol 73:449–455. [PMC free article] [PubMed] [Google Scholar]
- Cao Y, Balthasar JP, Jusko WJ. (2013) Second-generation minimal physiologically-based pharmacokinetic model for monoclonal antibodies. J Pharmacokinet Pharmacodyn 40:597–607. [DOI] [PMC free article] [PubMed] [Google Scholar]
- Cao Y, Jusko WJ. (2014a) Incorporating target-mediated drug disposition in a minimal physiologically-based pharmacokinetic model for monoclonal antibodies. J Pharmacokinet Pharmacodyn 41:375–387. [DOI] [PMC free article] [PubMed] [Google Scholar]
- Cao Y, Jusko WJ. (2014b) Survey of monoclonal antibody disposition in man utilizing a minimal physiologically-based pharmacokinetic model. J Pharmacokinet Pharmacodyn 41:571–580. [DOI] [PMC free article] [PubMed] [Google Scholar]
- Chen X, Jiang X, Jusko WJ, Zhou H, Wang W. (2016) Minimal physiologically-based pharmacokinetic (mPBPK) model for a monoclonal antibody against interleukin-6 in mice with collagen-induced arthritis. J Pharmacokinet Pharmacodyn 43:291–304. [DOI] [PMC free article] [PubMed] [Google Scholar]
- Chen X, DuBois DC, Almon RR, Jusko WJ. (2017) Characterization and interspecies scaling of recombinant tumor necrosis factor-α pharmacokinetics with minimal physiologically-based pharmacokinetic models. Drug Metab Dispos 45:798–806. [DOI] [PMC free article] [PubMed] [Google Scholar]
- Corti A, Fassina G, Marcucci F, Barbanti E, Cassani G. (1992) Oligomeric tumour necrosis factor alpha slowly converts into inactive forms at bioactive levels. Biochem J 284:905–910. [DOI] [PMC free article] [PubMed] [Google Scholar]
- Davies B, Morris T. (1993) Physiological parameters in laboratory animals and humans. Pharm Res 10:1093–1095. [DOI] [PubMed] [Google Scholar]
- Fong Y, Tracey KJ, Moldawer LL, Hesse DG, Manogue KB, Kenney JS, Lee AT, Kuo GC, Allison AC, Lowry SF, et al. (1989) Antibodies to cachectin/tumor necrosis factor reduce interleukin 1 beta and interleukin 6 appearance during lethal bacteremia. J Exp Med 170:1627–1633. [DOI] [PMC free article] [PubMed] [Google Scholar]
- Gibiansky L, Gibiansky E, Kakkar T, Ma P. (2008) Approximations of the target-mediated drug disposition model and identifiability of model parameters. J Pharmacokinet Pharmacodyn 35:573–591. [DOI] [PubMed] [Google Scholar]
- Gratacós J, Collado A, Filella X, Sanmartí R, Cañete J, Llena J, Molina R, Ballesta A, Muñoz-Gómez J. (1994) Serum cytokines (IL-6, TNF-alpha, IL-1 beta and IFN-gamma) in ankylosing spondylitis: a close correlation between serum IL-6 and disease activity and severity. Br J Rheumatol 33:927–931. [DOI] [PubMed] [Google Scholar]
- Greischel A, Zahn G. (1989) Pharmacokinetics of recombinant human tumor necrosis factor alpha in rhesus monkeys after intravenous administration. J Pharmacol Exp Ther 251:358–361. [PubMed] [Google Scholar]
- Haranaka K, Carswell EA, Williamson BD, Prendergast JS, Satomi N, Old LJ. (1986) Purification, characterization, and antitumor activity of nonrecombinant mouse tumor necrosis factor. Proc Natl Acad Sci USA 83:3949–3953. [DOI] [PMC free article] [PubMed] [Google Scholar]
- Kim MS, Lee SH, Song MY, Yoo TH, Lee BK, Kim YS. (2007) Comparative analyses of complex formation and binding sites between human tumor necrosis factor-alpha and its three antagonists elucidate their different neutralizing mechanisms. J Mol Biol 374:1374–1388. [DOI] [PubMed] [Google Scholar]
- Kojima K, Takahashi T, Nakanishi Y. (1988) Lymphatic transport of recombinant human tumor necrosis factor in rats. J Pharmacobiodyn 11:700–706. [DOI] [PubMed] [Google Scholar]
- Lee JW, Kelley M, King LE, Yang J, Salimi-Moosavi H, Tang MT, Lu JF, Kamerud J, Ahene A, Myler H, et al. (2011) Bioanalytical approaches to quantify “total” and “free” therapeutic antibodies and their targets: technical challenges and PK/PD applications over the course of drug development. AAPS J 13:99–110. [DOI] [PMC free article] [PubMed] [Google Scholar]
- Lon HK, Liu D, Jusko WJ. (2012) Pharmacokinetic/pharmacodynamic modeling in inflammation. Crit Rev Biomed Eng 40:295–312. [DOI] [PMC free article] [PubMed] [Google Scholar]
- Mager DE. (2006) Target-mediated drug disposition and dynamics. Biochem Pharmacol 72:1–10. [DOI] [PubMed] [Google Scholar]
- Manicourt DH, Triki R, Fukuda K, Devogelaer JP, Nagant de Deuxchaisnes C, Thonar EJ. (1993) Levels of circulating tumor necrosis factor alpha and interleukin-6 in patients with rheumatoid arthritis. Relationship to serum levels of hyaluronan and antigenic keratan sulfate. Arthritis Rheum 36:490–499. [DOI] [PubMed] [Google Scholar]
- Monaco C, Nanchahal J, Taylor P, Feldmann M. (2015) Anti-TNF therapy: past, present and future. Int Immunol 27:55–62. [DOI] [PMC free article] [PubMed] [Google Scholar]
- National Research Council (NRC) (1996) Guide for the Care and Use of Laboratory Animals. 7th ed. National Academies Press, Washington, DC. [Google Scholar]
- Poiesi C, Albertini A, Ghielmi S, Cassani G, Corti A. (1993) Kinetic analysis of TNF-alpha oligomer-monomer transition by surface plasmon resonance and immunochemical methods. Cytokine 5:539–545. [DOI] [PubMed] [Google Scholar]
- Salimi-Moosavi H, Lee J, Desilva B, Doellgast G. (2010) Novel approaches using alkaline or acid/guanidine treatment to eliminate therapeutic antibody interference in the measurement of total target ligand. J Pharm Biomed Anal 51:1128–1133. [DOI] [PubMed] [Google Scholar]
- Shah DK, Betts AM. (2012) Towards a platform PBPK model to characterize the plasma and tissue disposition of monoclonal antibodies in preclinical species and human. J Pharmacokinet Pharmacodyn 39:67–86. [DOI] [PubMed] [Google Scholar]
- Smith RA, Baglioni C. (1987) The active form of tumor necrosis factor is a trimer. J Biol Chem 262:6951–6954. [PubMed] [Google Scholar]
- Song MY, Park SK, Kim CS, Yoo TH, Kim B, Kim MS, Kim YS, Kwag WJ, Lee BK, Baek K. (2008) Characterization of a novel anti-human TNF-alpha murine monoclonal antibody with high binding affinity and neutralizing activity. Exp Mol Med 40:35–42. [DOI] [PMC free article] [PubMed] [Google Scholar]
- Taylor PC, Peters AM, Paleolog E, Chapman PT, Elliott MJ, McCloskey R, Feldmann M, Maini RN. (2000) Reduction of chemokine levels and leukocyte traffic to joints by tumor necrosis factor alpha blockade in patients with rheumatoid arthritis. Arthritis Rheum 43:38–47. [DOI] [PubMed] [Google Scholar]
- Upchurch KS, Kay J. (2012) Evolution of treatment for rheumatoid arthritis. Rheumatology (Oxford) 51 (Suppl 6):vi28–vi36. [DOI] [PubMed] [Google Scholar]
- Wang W, Wang X, Doddareddy R, Fink D, McIntosh T, Davis HM, Zhou H. (2014) Mechanistic pharmacokinetic/target engagement/pharmacodynamic (PK/TE/PD) modeling in deciphering interplay between a monoclonal antibody and its soluble target in cynomolgus monkeys. AAPS J 16:129–139. [DOI] [PMC free article] [PubMed] [Google Scholar]
- Zheng S, McIntosh T, Wang W. (2015) Utility of free and total target measurements as target engagement and efficacy biomarkers in biotherapeutic development—opportunities and challenges. J Clin Pharmacol 55 (Suppl 3):S75–S84. [DOI] [PubMed] [Google Scholar]