

Abstract
Background
Microelectrode recordings along pre-planned trajectories are often used for accurate definition of the subthalamic nucleus (STN) borders during deep brain stimulation (DBS) surgery for Parkinson’s disease. Usually, the demarcation of the STN borders is detected manually by a neurophysiologist. The exact detection of the borders is difficult and especially detecting the transition between the STN and the substantia nigra pars reticulata. Consequently, demarcation may be inaccurate, leading to sub-optimal location of the DBS lead and inadequate clinical outcomes.
Methods
We present machine learning classification procedures that utilize microelectrode recordings power spectra and allow for real time, high accuracy discrimination between STN and substantia nigra pars reticulata.
Results
A support vector machine procedure was tested on microelectrode recordings from 58 trajectories that included both STN and substantia nigra pars reticulata that achieved a 97.6% consistency with human expert classification (evaluated by 10-fold cross validation). We used the same dataset as a training set to find the optimal parameters for a hidden Markov model using both microelectrode recordings features and trajectory history to enable a real-time classification of the ventral STN border (STN exit). Seventy-three additional trajectories were used to test the reliability of the learned statistical model in identifying the exit from the STN. The hidden Markov model procedure identified the STN exit with an error of 0.04 ± 0.18 mm and detection reliability (error < 1 mm) of 94%.
Conclusion
The results indicate that robust, accurate and automatic real-time electrophysiological detection of the ventral STN border is feasible.
Keywords: subthalamic nucleus, substantia nigra, deep brain stimulation, Parkinson’s disease, microelectrode recording
INTRODUCTION
Surgical treatment for advanced Parkinson’s disease (PD) includes high-frequency deep brain stimulation (DBS) of the subthalamic nucleus (STN), which has proven to be surgically safe and beneficial over time.1–4 In some patients, mood disorders such as depression5 or manic symptoms6–11 may be observed after stimulation as a result of suboptimally placed DBS leads. By contrast, the combined stimulation of the substantia nigra pars reticulata (SNr) and STN may improve freezing of gait in patients with advanced PD.10,11 Therefore, accurate differentiation of the STN from the SNr is essential for achieving optimal therapeutic benefit while avoiding psychiatric complications.
Microelectrode recordings (MERs) along pre-planned trajectories are often used for improved delineation of the location of the STN during DBS surgery for Parkinson’s disease. The detection of the dorsolateral region of the STN is based on clear-cut changes in electrical activity in the form of a sharp rise in the total power of the MER (as measured by the root mean square, RMS),12 the tremor-frequency, and the β-oscillatory activity (13–30 Hz).13 In contrast, several factors can make electrophysiological determination of the ventral STN border more difficult, and in particular an uninterrupted STN-SNr transition because in this case there is no drop in activity (or RMS). In addition, the cells in the STN ventral domain have firing characteristics (reduced β band and tremor frequency oscillations) resembling SNr cells.14–18 Finally, electrophysiological determination of the STN exit can be challenging because white matter gaps in the STN may lead to erroneous early detection of STN exit.12 Therefore, the electrophysiological determination of the STN ventral border can be ambiguous and occasionally difficult to define.
Although recent imaging studies have been able to improve the differentiation between the STN and the SNr,19 electrophysiology is still necessary to identify and verify the STN-SNr transition intraoperatively. To facilitate detection of the transition, this article describes a new automatic, reliable procedure for locating the STN exit. Earlier automatic methods that use RMS values12,20–23 are successful in identifying STN-white matter (STN-WM) transitions, but are not as good for the direct STN-SNr transition. To improve the STN-SNr transition and STN lower border detection, we developed a computational analysis procedure that capitalizes on several features from the power spectra of the MER and allows for high accuracy discrimination between the STN and the SNr.
PATIENTS AND METHODS
Patients and Surgery
MERs were analyzed from 131 microelectrode trajectories that passed through both the STN and SNr of 81 Parkinson’s disease patients undergoing bilateral STN DBS implantation. The patients’ demography and clinical state were as follows: mean age (62.1 years), mean disease duration (10.3 years), 36% female, mean unified Parkinson’s disease rating scale - part III (UPDRS III) score OFF/ON therapy before surgery (51.1/19.4), and mean levodopa equivalent dosage (LED) before surgery (849.6 mg/day). Patient demographic information appears in Supporting Information Table S4. This study was authorized and approved by the Institutional Review Board of Hadassah Hospital in accordance with the Helsinki Declaration (reference code: HMO-0064-12). All patients were awake during surgery. Further details on the surgical procedure and data acquisition can be found in our previous reports.12,23
Microelectrode recordings
For both the left and right hemispheres, one or two parallel microelectrodes were inserted and the recording started 10 mm above the calculated target. Our trajectories followed a double-oblique approach towards the dorsolateral STN target. In most cases, two microelectrodes were used (Fig. 1A): a ‘central’ electrode was directed at the center of the dorsolateral STN target (as per imaging) and often traversed STN and entered SNr without passing through the white matter. An ‘anterior’ electrode was advanced 2 mm anterior to the central electrode (in the parasagittal plane) and therefore crossed STN-SNr area in a more ventral plane. In contrast to the central electrode, the anterior electrode often passed through the white matter before it entered the SNr. Analysis was not based on continuous recordings during the entire advance towards the dorsolateral STN target, but rather on segments of data recorded at specific points (without electrode movement; Fig. 1B). Segments of data were recorded for at least 4 seconds, after 0.5 seconds of lowering the electrode. Further details on the microelectrode recordings and the intervals of the depths are presented as supporting information.
FIG. 1. Overview of STN targeting.

(A) Schematic diagram of a typical trajectory of two parallel microelectrodes showing subcortical structures. STN-Subthalamic nucleus, SNr- Substantia nigra reticulate, ZI – zona inccerta (B) One-second example of 14 representative raw signal traces (in descending order) out of the 82 recorded signal traces at various depths along the trajectory (a single DBS track) from a Parkinson’s disease patient. The signal at each position was recorded for at least 4 seconds. The segment at 2.55 mm estimated distance to target (EDT) was recorded for a longer period of time than the others because responses to active and passive limb movements are tested. The traces indicate regions of internal capsule (white matter), dorsalateral oscillatory region (DLOR) STN, ventral medial non oscillatory region (VMNR) STN, white matter between STN and substantia nigra pars reticulata (SNr); vertical bar indicates 256 μv, horizontal bar indicates 100 ms. (C) Functional state model represents the anatomy which is sequentially encountered during microelectrode recording of the STN detection. At all depths along the trajectory the electrode is in one of a finite set of states. Arrows between the states represent the possible state transitions. Solid lines depict a typical trajectory state sequence that proceeds through the first three states consecutively and then to the white matter between the STN and SNr. Dotted lines depict: 1) a trajectory that enters the SNr immediately after the STN, 2) a trajectory that starts in the white matter and enters the VMNR, 3) one that goes directly into the SNr without passing through the STN.
Neural Datasets
We divided our neuronal database into two parts. Training dataset was composed of 58 trajectories (obtained from 30 PD patients) containing 2678 stable MERs recorded in the white matter before the STN, STN dorsolateral oscillatory region (DLOR), STN ventromedial non-oscillatory region (VMNR), white matter after STN and SNr. A subset of this dataset, containing 1720 MERs from the dorsal and ventral STN as well as SNr, was used for the support vector machine (SVM) procedure. Training dataset of 58 trajectories was also used to find the optimal parameters for the hidden Markov model (HMM). Seventy-three additional trajectories recorded from 51 other patients, and yielding 4526 stable MERs (test dataset) were used solely to test the robustness of the HMM detection.
Root Mean Square (RMS)
The RMS estimate was calculated from the multi-unit activity recorded by the microelectrode at each electrode depth. RMS values are susceptible to electrode properties (e.g., electrode impedance);12 hence, the RMS was normalized by the pre-STN (white matter) baseline RMS,12,23 creating what we term the normalized RMS (NRMS).
Power spectral density (PSD)
Visual inspection of the average STN and SNr power spectra revealed significant differences in the 5–300 Hz domain. To identify the frequency band that contained the largest difference between the STN and the SNr we divided the 5–300 Hz range of the power spectra into 10 approximately logarithmically spaced bands. For each band we calculated the mean power for each MER, and then evaluated the difference in the mean power between the STN and the SNr. Using this method we identified which frequency bands had the largest difference between the STN and the SNr. Additional details are presented in the supporting information.
Support vector machine (SVM) discrimination of STN and SNr MERs
In machine learning, SVMs are supervised learning models that are specifically designed to solve a classification problem offline, after all the data have been collected. For our SVM analysis, measurements in both time and frequency domains (based on the NRMS and power spectra of the MERs) were used as features for the SVM classification. The classification procedure used the NRMS and the “100–150 Hz/5–25 Hz Power Ratio” features, as well as their class label (STN or SNr) for each of the 1720 MERs in the training dataset. The performance of the SVM classifier was evaluated by 10-fold cross validation. Additional details are presented in the supporting information.
The SVM requires labeling the MERs of each region, which is not amenable to real time use. Here we used the SVM to identify which features had the most information in terms of discriminating regions. However, once the optimal features had been selected, the SVM was no longer needed or used.
The Hidden Markov Model
The HMM takes the set of features extracted from the raw data as input, and provides the output clustering in real time. In previous reports,23,24 the HMM procedure was used to discriminate the STN from the white matter. This study goes beyond these previous works by designing a HMM procedure with improved ability to detect the STN-exit by delineating the borders between the STN-SNr (even for cases without a WM gap between the STN and the SNr). Details on the HMM are provided in the supporting information.
All statistical analyses were performed using custom-made MATLAB 7.5 routines (Mathworks, Natick, MA). The statistics presented in this report, if not specified otherwise, are the mean ± standard error of the mean (SEM); the criterion for statistical significance was set at P < 0.05 for all statistical tests.
RESULTS
Power Spectra features help to discriminate STN from SNr recordings
The NRMS values calculated from the MERs were very effective in detecting the STN border with the white matter. As presented in the three examples in Figure 2A, top panels, the STN-entry and STN-exit borders appear as a sharp increase and decrease in the NRMS, respectively.23,12 In these “easy” cases the electrode traversed the STN and entered the SNr after passing through the white matter. The power spectra of these SNr (Fig 2A bottom panels) depict a unique signature: blue vertical lines indicating a reduction in relative power at lower frequencies. However, some trajectories lacked a clearly defined STN-exit (e.g., Fig. 2B). These are the “hard” cases in which there is no clear transient reduction in the NRMS (NRMS gap), most probably because the electrode traversed the STN and entered the SNr without passing through the white matter after the STN. Though the SNr cannot be identified by the NRMS in these cases, the SNr was identified by the electrophysiologist and can be seen in the power spectra (Fig. 2B bottom) as depicted by the vertical blue lines. These examples suggest that power spectra characteristics can be used to assist in detection of the STN exit, especially for cases without a STN-WM transition and NRMS gap.
FIG. 2. STN-white matter transition versus STN-SNr transition.

(A) Clearly defined STN-WM transition in three example trajectories (from three patients). The top three graphs represent the normalized root mean square (NRMS) analysis as a function of EDT. The bottom three graphs represent the power spectral distribution (PSD) spectrogram of the data, in relation to EDT on the x-axis. The arrow on each trajectory points to the transition between the STN and the WM (determined by an expert neuorophysiologist). The green dashed lines represent the baseline of the NRMS (i.e., WM). (B) The same as in A, but for the STN-SNr transition. The power spectral density color-scale represents 10 log10 (power spectral density/average power spectral density). The arrow on each trajectory points tothe transition between the STN and the SNr (determined by an expert neuorophysiologist). EDT = estimated distance to target (defined as the dorsolateral STN target according to preoperative imaging).
To evaluate the ability of the NRMS to distinguish the STN from the SNr, we calculated the distribution of their NRMS values. Figure 3A shows the overlap in the NRMS distribution of 660 MERs in STN DLOR, 990 MERs in the STN VMNR, and 155 MERs in the SNr (training dataset). The significant overlap between the different distributions suggests that there is no clear separation between the STN and the SNr using NRMS. In contrast, Fig 3B, illustrating the mean PSD of the STN and SNr recordings, suggests that features from the PSD could be used to discriminate STN from SNr. In line with the characteristic signature of the STN and SNr in the spectrograms (Fig 2), the average PSDs of the two STN domains and the SNr revealed different non-overlapping features. The mean SNr PSD (Fig. 3B, green trace) presented decreased activity in the 5–25 Hz band as compared to the mean PSD of the STN DLOR, and VMNR (Fig. 3B, red and blue traces). In addition, the mean PSD in the SNr displayed increased activity in the 85–300 Hz band (Fig. 3B, green trace).
FIG. 3. “100–150 Hz/5–25 Hz Power Ratio” separates STN from SNr better than NRMS.

(A) The left hand figure illustrates the NRMS distribution for dorsal STN (red), ventral STN (blue), SNr (green), white matter before STN (white), white matter after STN (gray). Right hand figure same as left, but three subcortical structures are superimposed on the x-axis, and show the overlap in NRMS distribution of the STN and the SNr. (B) The left hand figure illustrates the power spectral density as a function of the frequency, with a linear scale plot in the DLOR STN (red), VMNR STN (blue), SNr (green). The right hand figure is the same as left, but with a logarithmic scale plot of the x-axis. The shaded regions mark SEMs. (C) The left hand figure illustrates “100–150 Hz/5–25 Hz Power Ratio” distribution in five regions. Right figure same as left, but has the three subcortical structures superimposed on the x-axes.
To determine quantitatively which part of the power spectra enables the best discrimination of the STN from the SNr, we examined 10 (approximately logarithmically distributed) bands along the frequency axis in the power spectra. The mean power in two different frequency bands - high frequency (100–150 Hz) and low frequency (5–25 Hz) - provided the greatest discrimination between STN and SNr (discrimination matrix of 10 bands presented in the Supporting Information Table S1). We therefore calculated the ratio of the power of these two frequency bands and termed this new feature the “100–150 Hz/5–25 Hz Power Ratio”. Figure 3C shows very little overlap in the distributions of STN and SNr power ratio values.
Support vector machine (SVM) analysis confirms the utility of the power ratio for STN-SNr discrimination
An SVM classifier was used to examine the ability of the “100–150 Hz/5–25 Hz Power Ratio” to provide a robust discrimination between the SNr and STN. Figure 4 shows the result of an SVM classifier that was trained and tested on 155 randomly selected samples from the STN and all 155 samples from the SNr. A linear-kernel decision boundary was used to classify the training set as SNr (hollow square; green) or STN (hollow triangle; blue); then new data points were classified as SNr (solid square; green) or STN (solid triangle; blue). Yellow circles represent the support vectors defining the decision boundary between the STN and SNr samples. Figure 4 further demonstrates the absence of correlation between NRMS and the “100–150 Hz/5–25 Hz Power Ratio”. Both of these characteristics reinforce the utility of the power ratio feature as an additional attribute for classifying MERs. The discrimination performance of the SVM classifier for the entire training dataset using the two features, NRMS and “100–150 Hz/5–25 Hz Power Ratio” was evaluated by 10-fold cross validation and is presented as an error matrix in the Supporting Information Table S2. The overall classification accuracy rate was 97.6%.
FIG. 4. A linear support vector machine classifier provides high performance discrimination between the STN and SNr populations.
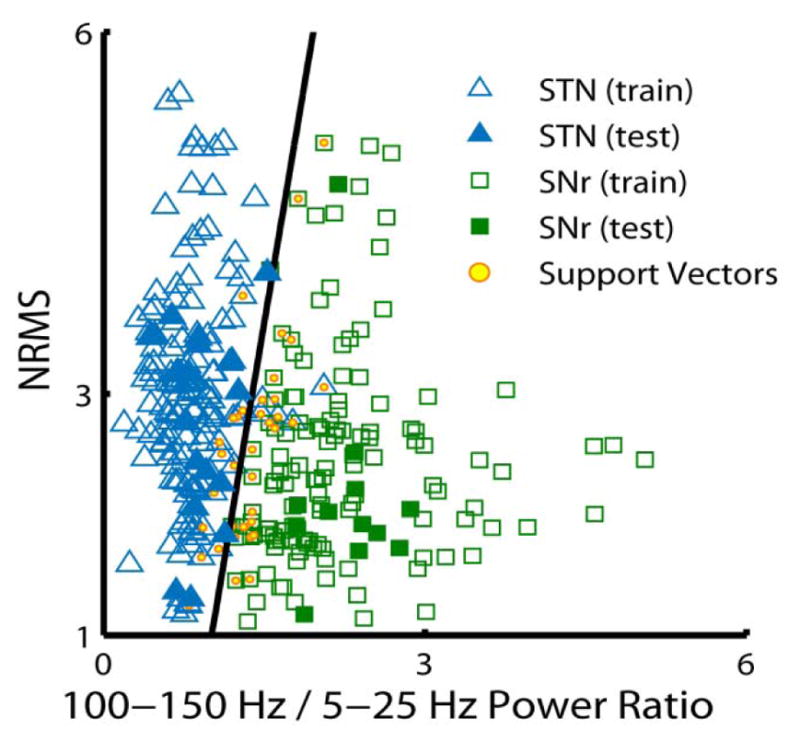
A support vector machine (SVM) classifier was trained and tested on 155 randomly selected samples from the STN and all 155 samples from the SNr, using NRMS and the “100–150 Hz/5–25 Hz Power Ratio” features. The linear-kernel decision boundary is used to classify the trained data for the SNr (hollow square; green) and the STN (hollow triangle; blue); then new data points are classified as SNr (solid square; green) or STN (solid triangle; blue). Yellow circles (within the hollow squares and triangles) represent the support vectors defining the decision boundary between the STN and SNr samples.
Hidden Markov model (HMM) analysis enables reliable detection of STN exit
The HMM procedure uses MER features and trajectory history to enable real time decisions as to electrode placement. The use of trajectory history in addition to the MER features enable the HMM procedure to “neglect” recording glitches that a classification method (e.g., SVM) would classify incorrectly. Our previous HMM procedures23 did not include the SNr as a possible state and did not use the high frequencies (100–150 Hz) of the power spectrum. Here we extended the HMM procedure to discriminate between the STN and SNr using the “100–150 Hz/5–25 Hz Power Ratio” and NRMS features, together with the depth of the trajectory (i.e., estimated distance to the target). The distribution of STN-exit borders was evaluated, and revealed that 77 out of 131 trajectories (59%) had STN-WM transitions, and 54 out of 131 trajectories (41%) had STN-SNr transitions.
Figure 5 presents three examples of a typical trajectory’s NRMS and PSD as well as the “100–150 Hz/5–25 Hz Power Ratio” feature. At each depth along the trajectory during the implant process the NRMS and power spectra features of the MERs are continually calculated and updated. Based on these calculations a new assessment by the HMM is made automatically in real time. An expert physiologist lowers the electrode along the trajectory until the red line appears (i.e., as determined by the real time HMM analysis). This indicates that the STN ventral border has been reached, followed by either the SNr or white matter. The three example trajectories illustrate the direct transition from the STN to SNr. The red line in the top panel illustrates the direct STN-SNr transition defined by the real time HMM analysis. It takes 99 ms in real time to process a new trajectory and determine whether it is STN or not, as illustrated by the HMM running time in Fig. 5. The time to analyze each subsequent MER is less than a ms per MER, making this a practical method for use during DBS surgery.
FIG. 5. Robust detection of the STN-SNr transition by the “100–150 Hz/5–25 Hz Power Ratio” feature.

Top and middle panels illustrate a typical trajectory’s NRMS and PSD, respectively. Bottom panel represents the “100–150 Hz/5–25 Hz Power Ratio” feature as a function of the estimated distance to target (EDT). The three sample trajectories illustrate the direct transition from the STN to SNr. The red line in the top panel illustrates the STN-SNr transition defined by the real time HMM analysis. The dashed green lines represent the baseline of the NRMS (i.e., WM). Each segment along the trajectory was recorded for at least 4 seconds, except for a few segments where responses to active and passive limb movements were tested. The data acquisition arrow marks the real duration of a single track of the example trajectories as a function of EDT. The total recording time of a single DBS track of the example trajectories from the left to the right column: 992 seconds, 622 seconds and 608 seconds. The HMM running time arrow shows the duration of the HMM processing as a function of the number of MERs (lower arrow). MERs = micro-electrode recordings.
For each of the 58 trajectories in the training dataset, the HMM parameters (transition and emission matrices) were estimated from the other 57 trajectories (leave-one-out cross-validation). The resulting mean (of all 58 trajectories) HMM transition and emission matrices are presented in the Supporting Information Table S3.
The performance of the HMM was assessed with two measures. The first is the mean OUT location error. It is defined as the difference between the location (Human Expert’s Classification), which is the location of the transition defined by the neurophysiologist, and location(HMM), which is the HMM inferred location of the transition, both measured in mm of estimated distance to the target. The second measure is the OUT transition error which is defined as an OUT location error greater than 1 mm. Hits were the number of correctly detected OUT transitions. Misses were the number of OUT transitions (according to the human expert’s decision) that the HMM procedure did not detect.
The OUT location error for both STN-SNr and STN-WM demonstrated better mean and standard deviation than that found by previous methods.12,23 The performance of the OUT location error on the training dataset had an error of 0.1 ± 0.34 mm (mean ± standard deviation) with 2 misses out of 58 trajectories (97% Hits).
The HMM procedure has to deal with a heterogeneous variation of trajectories, as some transitions are from VMNR STN to SNr and others from white matter before STN to SNr. Because an automatic detection algorithm that can be used in the operating room needs to function on novel data without being continually adjusted, it is important to demonstrate that the HMM procedure can work with completely novel data. Therefore, 73 other trajectories (from 51 patients, all trajectories included both STN and SNr) were evaluated by the HMM procedure. The HMM procedure identified the STN-exit with error of 0.04 ± 0.18 mm. Using the 1 mm threshold, the OUT transition error of the novel dataset committed 4 misses out of 73 trajectories (94% Hits), which is better than that found when applying the previous HMM procedure23 and Bayesian method12 (12 misses out of 73 trajectories, 83% hits, and error = 0.50 ± 0.59 mm, respectively). The performance of the new HMM procedure was shown to be robust to the specified threshold because threshold values of 0.5 mm and 0.15 mm produced similar quantitative results (4 and 7 misses out of 73 trajectories, respectively).
DISCUSSION
We described a computational machine-learning procedure with a new feature; namely, the ratio of high frequency (100–150 Hz) power to low frequency (5–25 Hz) power, which enables high accuracy discrimination of the STN from SNr. We used a SVM procedure to verify that the “100–150 Hz/5–25 Hz Power Ratio” is a reliable feature for discriminating the STN and SNr populations. Then, we utilized an HMM procedure using the MER features, together with the trajectory history to detect the STN exit either to the white matter (WM) or SNr.
The MERs along pre-planned trajectories are commonly used to confirm the STN territory during DBS surgery for Parkinson’s disease; however, there is a lack of consensus on whether the MER allows for reliable separation between the STN exit point and the SNr entry point. Across the ventral region of the STN there are fewer kinesthetic neurons,22 and the STN VMNR neurons are characterized by consistently reduced β band and increased gamma (30–100 Hz) activity.13 Similarly, the discharge pattern of the neurons in the SNr (below the STN target) lack the β band and tremor frequency oscillations, but have increased gamma activity.14–18 In addition, islands of cells have been observed with firing characteristics of both SNr and STN cells.22 Therefore, the electrophysiological determination of the transition from the STN to SNr is ambiguous and difficult to evaluate.
Several studies have developed automatic detection and visualization not only for the STN, but also the SNr based on objective and quantitative MER features.12,20,22,25–27 Some of these studies have used features that require spike detection algorithms to identify the firing pattern.25–27 While these features may aid in detecting the STN ventral border near the SNr, it is still computationally challenging to calculate neuronal spike characteristics in a real-time intra-operative scenario.12 Moreover, the ideal isolation of single units requires 5–10 microns steps of electrodes and is very time-consuming. In contrast, NRMS values that are based on unsorted multi-unit activity are easy to measure. The STN-entry and STN-exit often manifest as a sharp increase and decrease in the NRMS, respectively.23,12 Some studies have used NRMS together with spectral features of the analog signal, which are computationally efficient to calculate.20,22,27 However, these spectral features do not lead to reliable or robust identification of the transition between the STN and the SNr. Here, we divided the 5–300 Hz range power spectra into frequency bands. This division allowed us to determine which frequency bands contained the largest difference between the STN and the SNr, and to accurately detect the STN ventral border.
When implementing the NRMS and features from the power spectra, there are several ways to differentiate the STN from the SNr using automatic detection methods. Some studies have proposed rule-based detection methods;22,27 however, they are unable to detect the direct STN-SNr transitions. For example, despite the fact that Cagnan et al.27 used the power spectra of tremor, and the alpha band (3–12 Hz), beta band (13–30 Hz) and gamma band (31–100 Hz) as features, their algorithm still required a white matter gap in the trajectory between the STN and the SNr to detect the SNr. Furthermore, rule-based detection systems tend to be overly complex and may not generalize to other surgical centers. Other studies12,23,25 have used machine learning techniques to automatically extract the “rules” or decision boundaries to discriminate between the STN and the SNr. These machine learning procedures are either unsupervised, and involve extracting patterns using unlabeled training data (that still require labeling of the output),25 or supervised, that require the labeling of the electrophysiological signals used for training.12,23 For example, Wong et al.25 used a clustering algorithm (unsupervised machine learning) that returns a pre-specified number of clusters, but then requires the human observer to label the clusters. The main drawback of these techniques is that they do not take the previous location of the MERs into account when determining the electrode’s current location. A supervised technique that uses the electrode’s location is HMM. For example, Zaidel et al.23 combined the power spectra of beta band features and NRMS to locate the STN and its sub-territories. The two advantages of the HMM procedure are the short recording time needed for location analysis and low computational cost. Our approach goes beyond this previous work by delineating the borders between the STN-SNr which thus enable intra-operative application with greater accuracy.
Accurate discrimination between the STN and the SNr is of crucial importance for achieving optimal therapeutic benefits while avoiding psychiatric complications for PD DBS procedures. The beneficial effects of bilateral STN DBS on motor symptoms and quality of life have been repeatedly confirmed in patients with advanced PD;28 however, psychiatric complications induced by STN DBS have also been reported.29,30 In some patients with PD with impulse control disorders, their abnormal behavior may be provoked by stimulation with a ventral contact of the DBS lead, and suppressed by switching off this contact.6–9 It also has been reported that manic31,32 and depressive5 symptoms are induced by stimulation of active contacts located in the SNr. On the other hand, the SNr is thought to be particularly involved in balance control during gait.33 The combined stimulation of the SNr and the STN has been reported to improve axial symptoms (including freezing of gait, balance, and posture) compared to standard STN stimulation.10,11 In summary, automatic and reliable localization of the direct STN-SNr transition and STN lower border detection could lead to improved localization of DBS leads and better DBS clinical outcomes. It takes 99 ms in real time to process a new trajectory and decide whether it is STN or not, making this a practical method for use during DBS surgery. This analysis tool can be easily learned and employed in the DBS operating room. Future studies might incorporate MER data from multiple centers to test the applicability of these algorithms for automatic navigation in DBS surgery.
Supplementary Material
Footnotes
Authors’ role: 1)Research project: A. Conception, B. Organization, C. Execution; 2)Statistical Analysis: A. Design, B. Execution, C. Review and Critique; 3)Manuscript Preparation: A. Writing of the first draft, B. Review and Critique;
D.V.: 1A, 1B, 1C, 2A, 2B, 2C, 3A, 3B
H.B.:1A, 1B, 2C, 3B
O.M.: 2C, 3B
R.E.: 1B, 3B
M.D.: 3B
K.B.: 1B, 2C, 3B
Z.I.: 1A, 1B, 3B
Full financial disclosures of all the authors for the past year
D.V received a Ph.D. fellowship from the Edmond and Lily Safra Center (ELSC). H.B. is a recipient of research grants from the Magnet program of the Office of the Chief Scientist (OCS) of the Ministry of Economy Israel, European Research Council (ERC), the Israel Science Foundation (ISF), the Israel-US Binational Science Foundation (BSF), the German Israel Science Foundation (GIF), the Gutmann chair for brain research and the Adelis, Rostrees and Vorst foundations. KTB is supported by the joint NIH-NSF CRCNS program through NIAAA grant R01 016022 and NIDA grant R01 038890.
Additional Supporting Information may be found in the online version of this article on the publisher’s website.
Financial disclosures/Conflict of interest: This study was supported by the Magnet program of the Office of the Chief Scientist (OCS) of the Israel Ministry of Economy. There is no conflict of interest on the part of any of the authors.
References
- 1.Benabid AL, Chabardes S, Mitrofanis J, Pollak P. Deep brain stimulation of the subthalamic nucleus for the treatment of Parkinson’s disease. Lancet Neurol. 2009;8(1):67–81. doi: 10.1016/S1474-4422(08)70291-6. [DOI] [PubMed] [Google Scholar]
- 2.Krack P, Batir A, Van Blercom N, et al. Five-year follow-up of bilateral stimulation of the subthalamic nucleus in advanced Parkinson’s disease. N Engl J Med. 2003;349(20):1925–1934. doi: 10.1056/NEJMoa035275. [DOI] [PubMed] [Google Scholar]
- 3.Limousin P, Pollak P, Benazzouz A, et al. Bilateral subthalamic nucleus stimulation for severe Parkinson’s disease. Mov Disord. 1995;10(5):672–674. doi: 10.1002/mds.870100523. [DOI] [PubMed] [Google Scholar]
- 4.Machado A, Rezai AR, Kopell BH, Gross RE, Sharan AD, Benabid A-L. Deep brain stimulation for Parkinson’s disease: surgical technique and perioperative management. Mov Disord. 2006;21(Suppl 1):S247–S258. doi: 10.1002/mds.20959. [DOI] [PubMed] [Google Scholar]
- 5.Bejjani B-P, Damier P, Arnulf I, et al. Transient Acute Depression Induced by High-Frequency Deep-Brain Stimulation. N Engl J Med. 1999;340(19):1476–1480. doi: 10.1056/NEJM199905133401905. [DOI] [PubMed] [Google Scholar]
- 6.Raucher-Chéné D, Charrel C-L, de Maindreville AD, Limosin F. Manic episode with psychotic symptoms in a patient with Parkinson’s disease treated by subthalamic nucleus stimulation: improvement on switching the target. J Neurol Sci. 2008;273(1–2):116–117. doi: 10.1016/j.jns.2008.05.022. [DOI] [PubMed] [Google Scholar]
- 7.Mallet L, Schüpbach M, N’Diaye K, et al. Stimulation of subterritories of the subthalamic nucleus reveals its role in the integration of the emotional and motor aspects of behavior. Proc Natl Acad Sci U S A. 2007;104(25):10661–10666. doi: 10.1073/pnas.0610849104. [DOI] [PMC free article] [PubMed] [Google Scholar]
- 8.Mandat TS, Hurwitz T, Honey CR. Hypomania as an adverse effect of subthalamic nucleus stimulation: report of two cases. Acta Neurochir (Wien) 2006;148(8):895–897. doi: 10.1007/s00701-006-0795-4. discussion 898. [DOI] [PubMed] [Google Scholar]
- 9.Kulisevsky J, Berthier ML, Gironell A, Pascual-Sedano B, Molet J, Parés P. Mania following deep brain stimulation for Parkinson’s disease. Neurology. 2002;59(9):1421–1424. doi: 10.1212/wnl.59.9.1421. [DOI] [PubMed] [Google Scholar]
- 10.Weiss D, Walach M, Meisner C, et al. Nigral stimulation for resistant axial motor impairment in Parkinson’s disease? A randomized controlled trial. Brain. 2013;136(7):2098–2108. doi: 10.1093/brain/awt122. [DOI] [PMC free article] [PubMed] [Google Scholar]
- 11.Weiss D, Breit S, Wächter T, Plewnia C, Gharabaghi A, Krüger R. Combined stimulation of the substantia nigra pars reticulata and the subthalamic nucleus is effective in hypokinetic gait disturbance in Parkinson’s disease. J Neurol. 2011;258(6):1183–1185. doi: 10.1007/s00415-011-5906-3. [DOI] [PubMed] [Google Scholar]
- 12.Moran A, Bar-Gad I, Bergman H, Israel Z. Real-time refinement of subthalamic nucleus targeting using Bayesian decision-making on the root mean square measure. Mov Disord. 2006;21(9):1425–1431. doi: 10.1002/mds.20995. [DOI] [PubMed] [Google Scholar]
- 13.Zaidel A, Spivak A, Grieb B, Bergman H, Israel Z. Subthalamic span of β oscillations predicts deep brain stimulation efficacy for patients with Parkinson’s disease. Brain. 2010;133(7):2007–2021. doi: 10.1093/brain/awq144. [DOI] [PubMed] [Google Scholar]
- 14.Sterio D, Zonenshayn M, Mogilner AY, et al. Neurophysiological refinement of subthalamic nucleus targeting. Neurosurgery. 2002;50(1):58–67. doi: 10.1097/00006123-200201000-00012. discussion 67–69. [DOI] [PubMed] [Google Scholar]
- 15.Bejjani B-P, Dormont D, Pidoux B, et al. Bilateral subthalamic stimulation for Parkinson’s disease by using three-dimensional stereotactic magnetic resonance imaging and electrophysiological guidance. J Neurosurg. 2000;92(4):615–625. doi: 10.3171/jns.2000.92.4.0615. [DOI] [PubMed] [Google Scholar]
- 16.Rodriguez-Oroz MC, Rodriguez M, Guridi J, et al. The subthalamic nucleus in Parkinson’s disease: somatotopic organization and physiological characteristics. Brain. 2001;124(Pt 9):1777–1790. doi: 10.1093/brain/124.9.1777. [DOI] [PubMed] [Google Scholar]
- 17.Benazzouz A, Breit S, Koudsie A, Pollak P, Krack P, Benabid A-L. Intraoperative microrecordings of the subthalamic nucleus in Parkinson’s disease. Mov Disord. 2002;17(Suppl 3):S145–S149. doi: 10.1002/mds.10156. [DOI] [PubMed] [Google Scholar]
- 18.Hutchison WD, Allan RJ, Opitz H, et al. Neurophysiological identification of the subthalamic nucleus in surgery for Parkinson’s disease. Ann Neurol. 1998;44(4):622–628. doi: 10.1002/ana.410440407. [DOI] [PubMed] [Google Scholar]
- 19.McEvoy J, Ughratdar I, Schwarz S, Basu S. Electrophysiological validation of STN-SNr boundary depicted by susceptibility-weighted MRI. Acta Neurochir (Wien) 2015;157(12):2129–2134. doi: 10.1007/s00701-015-2615-1. [DOI] [PubMed] [Google Scholar]
- 20.Falkenberg JH, McNames J, Favre J, Burchiel KJ. Automatic analysis and visualization of microelectrode recording trajectories to the subthalamic nucleus: preliminary results. Stereotact Funct Neurosurg. 2006;84(1):35–44. doi: 10.1159/000093721. discussion 44–45. [DOI] [PubMed] [Google Scholar]
- 21.Danish SF, Baltuch GH, Jaggi JL, Wong S. Determination of subthalamic nucleus location by quantitative analysis of despiked background neural activity from microelectrode recordings obtained during deep brain stimulation surgery. J Clin Neurophysiol. 2008;25(2):98–103. doi: 10.1097/WNP.0b013e31816b38dd. [DOI] [PubMed] [Google Scholar]
- 22.Novak P, Daniluk S, Ellias Sa, Nazzaro JM. Detection of the subthalamic nucleus in microelectrographic recordings in Parkinson disease using the high-frequency (> 500 hz) neuronal background. Technical note. J Neurosurg. 2007;106(1):175–179. doi: 10.3171/jns.2007.106.1.175. [DOI] [PubMed] [Google Scholar]
- 23.Zaidel A, Spivak A, Shpigelman L, Bergman H, Israel Z. Delimiting subterritories of the human subthalamic nucleus by means of microelectrode recordings and a hidden Markov model. Mov Disord. 2009;24(12):1785–1793. doi: 10.1002/mds.22674. [DOI] [PubMed] [Google Scholar]
- 24.Taghva A. Hidden semi-Markov models in the computerized decoding of microelectrode recording data for deep brain stimulator placement. World Neurosurg. 2011;75(5–6):758–763. e4. doi: 10.1016/j.wneu.2010.11.008. [DOI] [PubMed] [Google Scholar]
- 25.Wong S, Baltuch GH, Jaggi JL, Danish SF. Functional localization and visualization of the subthalamic nucleus from microelectrode recordings acquired during DBS surgery with unsupervised machine learning. J Neural Eng. 2009;6(2):026006. doi: 10.1088/1741-2560/6/2/026006. [DOI] [PubMed] [Google Scholar]
- 26.Pinzon-Morales RD, Orozco-Gutierrez aa, Castellanos-Dominguez G. Novel signal-dependent filter bank method for identification of multiple basal ganglia nuclei in Parkinsonian patients. J Neural Eng. 2011;8(3):036026. doi: 10.1088/1741-2560/8/3/036026. [DOI] [PubMed] [Google Scholar]
- 27.Cagnan H, Dolan K, He X, et al. Automatic subthalamic nucleus detection from microelectrode recordings based on noise level and neuronal activity. J Neural Eng. 2011;8(4):046006. doi: 10.1088/1741-2560/8/4/046006. [DOI] [PubMed] [Google Scholar]
- 28.Deuschl G, Schade-Brittinger C, Krack P, et al. A randomized trial of deep-brain stimulation for Parkinson’s disease. N Engl J Med. 2006;355(9):896–908. doi: 10.1056/NEJMoa060281. [DOI] [PubMed] [Google Scholar]
- 29.Voon V, Kubu C, Krack P, Houeto J-L, Tröster AI. Deep brain stimulation: neuropsychological and neuropsychiatric issues. Mov Disord. 2006;21(Suppl 1):S305–S327. doi: 10.1002/mds.20963. [DOI] [PubMed] [Google Scholar]
- 30.Saint-Cyr JA, Trépanier LL, Kumar R, Lozano AM, Lang AE. Neuropsychological consequences of chronic bilateral stimulation of the subthalamic nucleus in Parkinson’s disease. Brain. 2000;123(Pt 1):2091–2108. doi: 10.1093/brain/123.10.2091. [DOI] [PubMed] [Google Scholar]
- 31.Ulla M, Thobois S, Lemaire J-J, et al. Manic behaviour induced by deep-brain stimulation in Parkinson’s disease: evidence of substantia nigra implication? J Neurol Neurosurg Psychiatry. 2006;77(12):1363–1366. doi: 10.1136/jnnp.2006.096628. [DOI] [PMC free article] [PubMed] [Google Scholar]
- 32.Ulla M, Thobois S, Llorca P-M, et al. Contact dependent reproducible hypomania induced by deep brain stimulation in Parkinson’s disease: clinical, anatomical and functional imaging study. J Neurol Neurosurg Psychiatry. 2011;82(6):607–614. doi: 10.1136/jnnp.2009.199323. [DOI] [PubMed] [Google Scholar]
- 33.Chastan N, Westby GWM, Yelnik J, et al. Effects of nigral stimulation on locomotion and postural stability in patients with Parkinson’s disease. Brain. 2009;132(1):172–184. doi: 10.1093/brain/awn294. [DOI] [PubMed] [Google Scholar]
Associated Data
This section collects any data citations, data availability statements, or supplementary materials included in this article.