Abstract
An evaluation of the relation between parametric imaging results obtained from Digital Subtraction Angiography (DSA) images and blood-flow velocity measured using Doppler ultrasound in patient-specific neurovascular phantoms is provided. A silicone neurovascular phantom containing internal carotid artery, middle cerebral artery and anterior communicating artery was embedded in a tissue equivalent gel. The gel prevented movement of the vessels when blood mimicking fluid was pumped through it to obtain Colour Doppler images. The phantom was connected to a peristaltic pump, simulating physiological flow conditions. To obtain the parametric images, water was pumped through the phantom at various flow rates (100, 120 and 160 ml/min) and 10 ml contrast boluses were injected. DSA images were obtained at 10 frames/sec from the Toshiba C-arm and DSA image sequences were input into LabVIEW software to get parametric maps from time-density curves. The parametric maps were compared with velocities determined by Doppler ultrasound at the internal carotid artery. The velocities measured by the Doppler ultrasound were 38, 48 and 65 cm/s for flow rates of 100, 120 and 160 ml/min, respectively. For the 20% increase in flow rate, the percentage change of blood velocity measured by Doppler ultrasound was 26.3%. Correspondingly, there was a 20% decrease of Bolus Arrival Time (BAT) and 14.3% decrease of Mean Transit Time (MTT), showing strong inverse correlation with Doppler measured velocity. The parametric imaging parameters are quite sensitive to velocity changes and are well correlated to the velocities measured by Doppler ultrasound.
INTRODUCTION
During neurovascular procedures, interventionalists frequently use Digital Subtraction Angiography (DSA) sequences to evaluate diseased structure and blood flow. Due to its inherent high signal to noise ratio and high spatial and temporal resolution, this imaging modality has become the gold standard for neurovascular diagnosis. In some situations the flow of the contrast is used to assess physiological flow conditions. Interventionalists assign various flow grades, such as TIMI (Thrombolysis in Myocardial Infarction)1, but they are regarded by the medical community as somewhat subjective. In response to this need, quantitative tools have been developed to evaluate the contrast flow in angiography. Such a tool is angiography-based parametric imaging (PI) also referred to as color-coded DSA.2, 3, 6
PI provides semi-quantitative blood flow information through the vasculature. PI maps are obtained by analysing contrast behaviour at each pixel in the images of the sequence. The value of the pixels in each frame are tracked and Time Density Curve (TDC) is generated for each. Various parameters such as Bolus Arrival Time (BAT) and Mean Transit Time (MTT) are obtained from the TDC which are displayed using a colorized mapping convention (Figure 1). These parameters are a good estimation of blood velocity in the vessels. Thus, a higher blood velocity will have a lower value of BAT and MTT compared to a lower blood velocity, which would have higher values of BAT and MTT.
Figure 1.
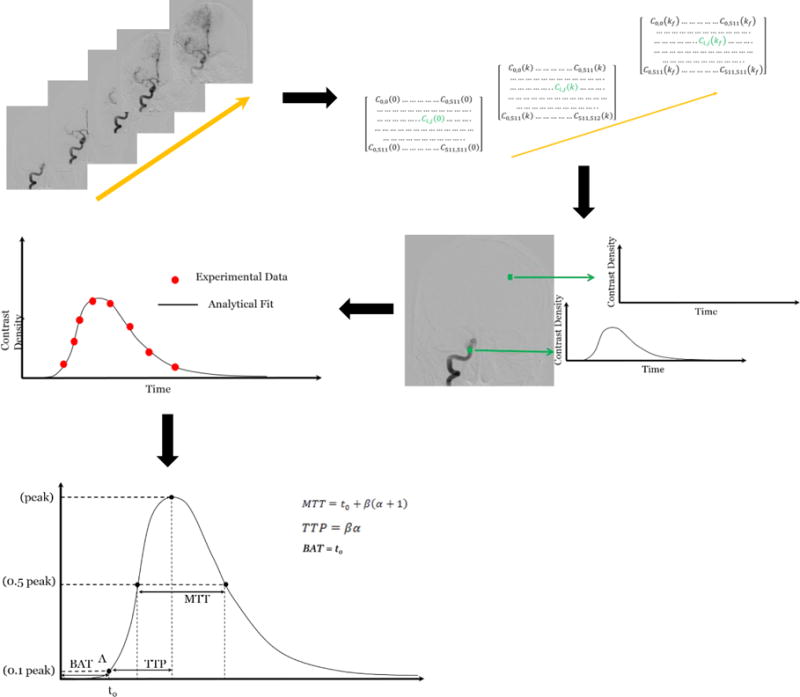
Steps involved in obtaining parametric images. The pixel values in each image of the DSA sequence are read and a matrix is created. A time density curve is generated at each matrix element by reading the values in each frame of the sequence. From the time density curves we can obtain values of MTT, BAT and TTP.
Parametric maps are being used currently in angiographic suites to acquire blood flow information. While in its infancy, the method provides surgeons with an extra tool to diagnose and plan the treatment for neurovascular afflictions such as ischemic or haemorrhagic strokes, arteriovenous malformations and other pathologies 1.
As indicated above, the method is regarded as a semi-quantitative tool due to the fact that it is based on a single projection view. This constraint challenges accurate flow measurements due to overlapping vessels and foreshortening. Previous studies1 including ours2–5, dedicated significant efforts to establish the reliability of this imaging tool and make a transition to a consistent quantitative method. We are trying to evaluate how well this tool responds to small changes in flow and validating it using Doppler ultrasound. Non-invasive ultrasonic duplex Doppler examination has been a standard method for the clinical evaluation of the carotid arteries for a third of a century8, 9. Doppler velocity waveforms are gathered from the common and internal carotid arteries to detect local elevated blood velocity as a marker of arterial stenosis allowing categorical classification of the right and left common and internal carotid arteries into clinically useful categories.10 Doppler ultrasound is based on the shift in frequency between incident and reflected sound waves due to reflection from moving red blood cells.
This paper is aligned with the previous efforts to verify the dependence of PI on change in flow conditions. The novelty of this study consists in the correlation of PI with the results of Doppler ultrasound14, 15 measurements in a patient-specific neurovascular phantom which adds a high degree of precision and freedom of operation. We have found that, despite using one view, parametric imaging is capable of showing significant changes in the calculated maps when flow is increased by only 20%.
MATERIALS AND METHODS
The parametric imaging software used by surgeons is still a semi-quantitative method. In order to evaluate its accuracy, we use Doppler ultrasound to measure blood velocity in the vasculature. To validate parametric imaging, a silicone vascular phantom was used. The phantom contained the carotid artery, the middle cerebral artery and the anterior communicating artery. To obtain adequate color Doppler images and to prevent external disturbances of the velocity measurements, the exterior of the vascular phantom was covered with ballistic gel (CLEAR Ballistics, Arkansas, USA). Ballistic gel is a medium which scientifically correlates well to swine muscle tissue. It has a density and viscosity similar to that of animal and human muscle tissue.
The ballistic gel was melted on a hot plate to about 130°C. It was heated until all the bubbles escaped the medium. To prevent any damage to the silicone phantom, the phantom was placed in an ice bath and ice cold water was flushed through the phantom vessels (Figure 2). The silicone phantom with the ballistic gel was allowed to cool for about 1 hour (Figure 3).
Figure 2.
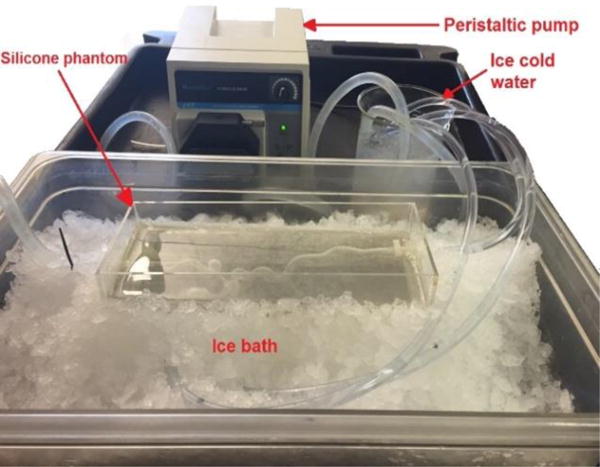
Setup for pouring hot ballistic gel on the silicone phantom to prevent damage to the phantom.
Figure 3.
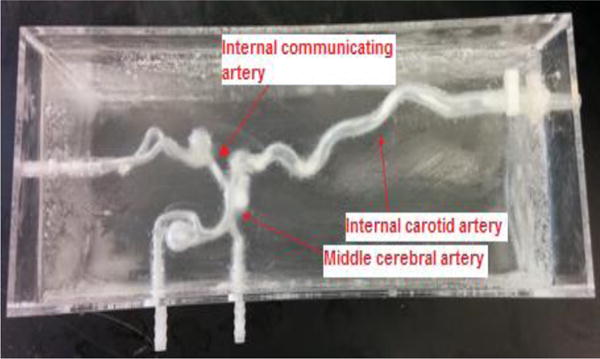
Phantom with ballistic gel.
To evaluate the parametric images, we must first get the parametric maps from Digital Subtraction Angiography (DSA) images using the set-up in Figure 4. We connected the silicone phantom to a peristaltic pump and a warm water reservoir. We manually injected 10 ml contrast boluses of iodine contrast agent. DSA images were obtained at 10 frames/sec using a Toshiba Infinix C-arm and at system-selected parameters of kV and mA. Three sets of DSA images were obtained at different flow rates namely, 100 ml/min, 120 ml/min and 160 ml/min. In order to get the ultrasound images, we replaced the water in the reservoir with ultrasound blood mimicking fluid (CIRS 046) so that the particle movement in the fluid can be picked up by the ultrasound probe. We used the Toshiba Aplio XG ultrasound system to obtain the images. The probe was placed at the internal carotid artery16. A distal point on the carotid artery was chosen as the ROI for assessing parametric data as shown in Figure 5. The ultrasound probe was kept at an angle between 30° – 60° with the vessel17, 18 and the gate was adjusted to get the average velocity over the vessel. The DSA images obtained were saved in “.raw” format and input into a LabVIEW program which generated parametric maps. The parameters of PI were calculated for the ROI shown in Figure 5.
Figure 4.
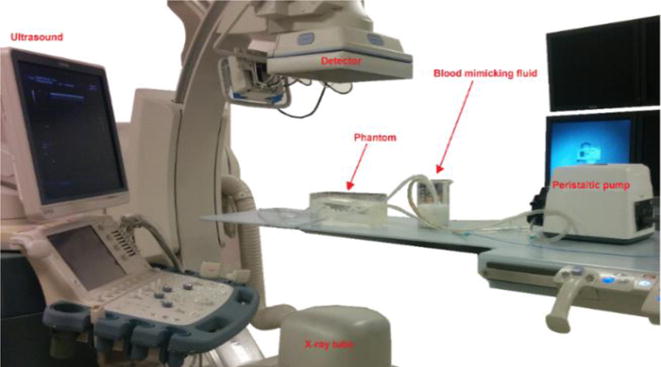
Experimental setup for obtaining DSA and ultrasound images.
Figure 5.
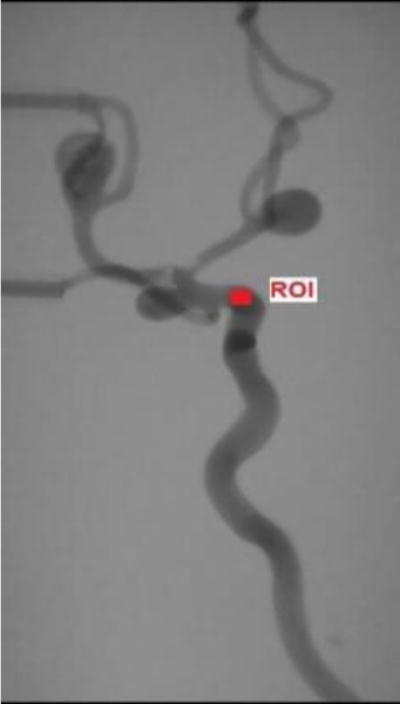
The Region of interest (ROI) where the PI parameters were calculated.
RESULTS
The velocities obtained from the ultrasound images are given in Table 1 along with the parametric image parameters of Bolus Arrival Time (BAT) and Mean Transit Time (MTT). From the table we can see that, as the blood velocity increases the PI parameters decrease. The time decrease of contrast bolus arrival and average mean transit time of contrast in the vessels correlates with the increase in blood velocity in the vessels. The percentage change between the initial and final values of the parameters is shown in Table 2. For a 20% increase in flow rate and a 26.3% increase in blood velocity measured from Doppler ultrasound, there is a 20% decrease of BAT and 14.3% decrease of MTT. The parametric maps of BAT and MTT generated from the LabVIEW software are given below in Figure 6 and Figure 7.
Table 1.
Values of blood velocity, BAT and MTT obtained at different flow rates
| Flow rate (ml/min) | Velocity from Ultrasound (cm/s) | BAT (s) | MTT (s) |
|---|---|---|---|
| 100 | 38 | 0.5 | 2.1 |
| 120 | 48 | 0.4 | 1.8 |
| 160 | 65 | 0.3 | 1.7 |
Table 2.
Per cent change in parameters and Doppler measured velocity for a 20% change in flow rate.
| Flow Rate | Velocity | BAT (s) | MTT (s) | |
|---|---|---|---|---|
| Percentage change between initial and final values (%) | 20 | 26.3 | −20 | −14.3 |
Figure 6.

Parametric maps of BAT at different Doppler-ultrasound measured velocities.
Figure 7.

Parametric maps of MTT at different Doppler-ultrasound measured velocities.
The velocity images obtained from ultrasound are shown in Figure 8.
Figure 8.
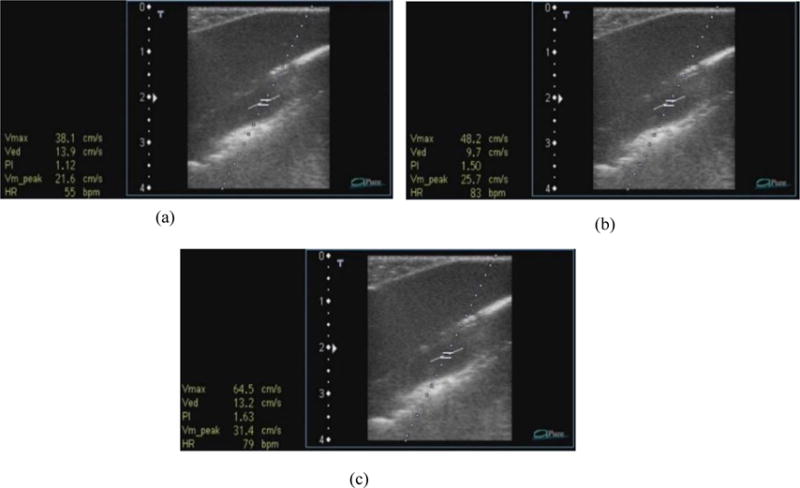
Ultrasound images showing velocity measurements at various flow rates – (a) 100 ml/min, (b) 120 ml/min and (c) 160 ml/min
DISCUSSION
These results reinforce the significance of parametric imaging in diagnosis and post-treatment analysis of neurovascular diseases. The velocities obtained from Doppler ultrasound support the PI parameters. Clinically this can be very useful. Doppler ultrasound is used to check degree of stenosis in the carotid artery; this gives us the blood flow only over a small region of the artery, however, PI can cover a larger region and also show the physiology and blood flow through the arteries. This makes diagnosis of diseases easier and gives neuro interventionalists an overview of the diseased vasculature which will help in treatment planning.
There are a few limitations while using the method in this paper. Limitations of the image acquisition system, temporal sampling rate, affects the results. As the velocity increase we see a lesser change in the BAT and MTT compared with at lower velocities.
Another point to be noted is the angle at which the probe is held to obtain the velocities. The probe should be inclined at an angle between 30° – 60° with the vessel, else there will be an incorrect velocity reading. Thus, to ensure accuracy and reproducibility of the experiment, the positioning of the ultrasound probe is important.
With these results reinforcing the importance of PI, this method can be extensively used clinically for treatment planning and diagnosis. In order to overcome the present methods of generating Parametric maps which makes use of single plane DSA and uses pixel values of overlapping vessels, 3D parametric imaging could be the future of this current method. In 3D parametric imaging, we could use bi-plane DSA, use pixel values where there is no vessel overlap and interpolate pixel values at regions of overlap. Thus, in the future we could look forward to a more accurate 3D Parametric Imaging method being used in a clinical environment.
CONCLUSION
The results show an inverse correlation between blood velocity and PI parameters as predicted. This study thus shows that parametric imaging can have good correlation to the blood flow in the vessels and thus, can potentially be useful for diagnosis of various neurovascular diseases7.
Acknowledgments
Partial support from NIH Grant R01EB002873 and an equipment grant from Toshiba Medical Systems Corporation. We would like to thank Ms. Maureen Tabaczynski, University at Buffalo Neurosurgery, who trained us to use the Toshiba Aplio XG Ultrasound System.
References
- 1.Morrow DA, Antman EM, Charlesworth A, Cairns R, Murphy SA, de Lemos JA, Giugliano RP, McCabe CH, Braunwald E. TIMI risk score for ST-elevation myocardial infarction: A convenient, bedside, clinical score for risk assessment at presentation: An intravenous nPA for treatment of infarcting myocardium early II trial substudy. Circulation. 2000;102:2031–2037. doi: 10.1161/01.cir.102.17.2031. [DOI] [PubMed] [Google Scholar]
- 2.Ionita CN, Garcia VL, Bednarek DR, Snyder KV, Siddiqui AH, Levy EI, Rudin S. Effect of injection technique on temporal parametric imaging derived from digital subtraction angiography in patient specific phantoms. Proc SPIE Int Soc Opt Eng. 2014:9038–90380. doi: 10.1117/12.2041347. [DOI] [PMC free article] [PubMed] [Google Scholar]
- 3.Ionita CN, Suri H, Nataranjian S, Siddiqui A, Levy E, Hopkins L, Bednarek DR, Rudin S. Angiographic imaging evaluation of patient-specific bifurcation-aneurysm phantom treatment with pre-shaped, self-expanding, flow-diverting stents: feasibility study. Proc SPIE Int Soc Opt Eng. 2011;7965:79651. doi: 10.1117/12.877675. [DOI] [PMC free article] [PubMed] [Google Scholar]
- 4.Yoganand Aradhana, Wood Rachel P, Jimenez Carlos, et al. Angiographic analysis for phantom simulations of endovascular aneurysm treatments with a new fully retrievable asymmetric flow diverter. Proceedings of SPIE. 2015;9417:94170W. doi: 10.1117/12.2082079. [DOI] [PMC free article] [PubMed] [Google Scholar]
- 5.Wood Rachel P, Khobragade Parag, Ying Leslie, et al. Initial testing of a 3D printed perfusion phantom using digital subtraction angiography. Proceedings of SPIE. 2015;9417:94170V. doi: 10.1117/12.2081471. [DOI] [PMC free article] [PubMed] [Google Scholar]
- 6.Davis B, Royalty K, Kowarschik M, Rohkohl C, Oberstar E, Aagaard-Kienitz B, Niemann D, Ozkan O, Strother C, Mistretta C. 4D digital subtraction angiography: implementation and demonstration of feasibility. AJNR American journal of neuroradiology. 2013;34:1914–1921. doi: 10.3174/ajnr.A3529. [DOI] [PMC free article] [PubMed] [Google Scholar]
- 7.Ionita Ciprian, et al. Effect of injection technique on temporal parametric imaging derived from digital subtraction angiography in patient specific phantoms. SPIE 9038 Medical Imaging. 2014;10:1117–12. doi: 10.1117/12.2041347. [DOI] [PMC free article] [PubMed] [Google Scholar]
- 8.Barber FE, Baker DW, Nation AW, Strandness DE, Jr, Reid JM. Ultrasonic duplex echo-Doppler scanner. IEEE Trans Biomed Eng. 1974;21(2):109–113. doi: 10.1109/TBME.1974.324295. [DOI] [PubMed] [Google Scholar]
- 9.Blackshear WM, Jr, Phillips DJ, Thiele BL, Hirsch JH, Chikos PM, Marinelli MR, Ward KJ, Strandness DE., Jr Detection of carotid occlusive disease by ultrasonic imaging and pulsed Doppler spectrum analysis. Surgery. 1979;86(5):698–706. [PubMed] [Google Scholar]
- 10.Beach, et al. Standardized ultrasound evaluation of carotid stenosis for clinical trials. University of Washington; Ultrasound Reading Center: 2010. pp. 8–39. [DOI] [PMC free article] [PubMed] [Google Scholar]
- 11.Saffman PG. The lift on a small sphere in a slow shear flow. J Fluid Mech. 1965;22:385–400. [Google Scholar]
- 12.Kumar V, Ramnarine, et al. Validation of a New Blood Mimicking fluid for use in Doppler flow test objects. Ultrasound in Med and Biol. 1998;24(3):451–459. doi: 10.1016/s0301-5629(97)00277-9. [DOI] [PubMed] [Google Scholar]
- 13.Hoskins PR. Review of the design and use of flow phantoms; Testing of Doppler ultrasound equipment. York UK: Institute of Physical Sciences in Medicine; 1994. [Google Scholar]
- 14.Ringer AJ, et al. Follow-up of stented carotid arteries by Doppler ultrasound. Neurosurgery. 2002;51:639–43. [PubMed] [Google Scholar]
- 15.Fell G, et al. Importance of non-invasive ultrasonic Doppler testing in the evaluation of patients /asymptomatic carotid bruits. American Heart Journal. 1981;102:221–26. doi: 10.1016/s0002-8703(81)80013-0. [DOI] [PubMed] [Google Scholar]
- 16.Beckett WW, Jr, et al. Duplex Doppler sonography of the carotid artery: false-positive results in an artery contralateral to an artery with marked stenosis. AJNR. 1990;11:1049–53. [PMC free article] [PubMed] [Google Scholar]
- 17.Gerhard-Herman M, et al. Guidelines for noninvasive vascular laboratory testing: a report from the American Society of Echocardiography and the Society for Vascular Medicine and Biology. Vascular Medicine November. 2006;11(3):183–200. doi: 10.1177/1358863x06070516. [DOI] [PubMed] [Google Scholar]
- 18.Logason K, et al. The importance of Doppler angle of insonation on differentiation between 50–69% and 70–99% carotid artery stenosis. Europe Journal Endovascular Surgery. 2001;21:311–3. doi: 10.1053/ejvs.2001.1331. [DOI] [PubMed] [Google Scholar]


