

Abstract
Recent studies have shown that an elevated red cell distribution width (RDW) is an important predictor of adverse outcomes. However, the strength of this biomarker has not been tested in a large outpatient elderly population. Also since increased RDW can be due to a variety of etiologies, additional biomarkers are needed to refine the prognostic value of this variable. We assembled a cohort of 36,226 elderly (≥65yo) patients seen at an outpatient facility within the Einstein/Montefiore system from January 1st 1997 to May 1st 2008 who also had a complete blood count performed within 3 months of the initial visit. With a maximum follow-up of 10 years, we found that an elevated RDW (>16.6) was associated with increased risk of mortality in both non-anemic (HR = 3.66, p < 0.05) and anemic patients (HR = 1.87, p < 0.05). The effect of RDW on mortality is significantly increased in non-anemic patients with macrocytosis (HR = 5.22, p < 0.05) compared to those with normocytosis (HR = 3.86, p < 0.05) and microcytosis (HR = 2.46, p < 0.05). When comparing non-anemic patients with both an elevated RDW and macrocytosis to those with neither, we observed an elevated HR of 7.76 (higher than expected in an additive model). This multiplicative interaction was not observed in anemic patients (HR = 2.23). Lastly, we constructed Kaplan-Meier curves for each RDW/ MCV subgroup and found worsened survival for those with macrocytosis and an elevated RDW in both anemia and non-anemic patients. Based on our results, the addition of MCV appears to improve the prognostic value of RDW as a predictor of overall survival in elderly patients.
Introduction
Anisocytosis is defined as excessive variation in the size of red blood cells. Clinically, it is quantitatively measured by red cell distribution width (RDW). Studies have found an association between elevated RDW and all-cause mortality in community dwelling adults aged 45 years and older [1] and elderly hospitalized patients [2]. Anisocytosis is also associated with adverse outcomes for a number of conditions, including coronary artery disease [3–6], congestive heart failure [7–9], acute myocardial infarction [10], pulmonary hypertension [11,12], pulmonary embolism [13], community acquired pneumonia [14], inflammatory bowel disease [15], renal insufficiency [16], cerebrovascular disease [17,18], and sepsis [19]. Although the mechanism for these associations is largely unclear, elevated RDW can be a reflection of ineffective erythropoiesis, which can be due to nutritional deficiencies, hemoglobinopathies, or underlying bone marrow dysfunction or malignancy. It can also be associated with normal reactive erythropoiesis in the setting of blood loss or hemolysis as well. It has been postulated that anisocytosis may be a reflection of an underlying inflammatory state [20] and that underlying cytokine release may interfere with bone marrow function [21]. These various mechanisms involve different biological pathways which can often be distinguished by their effects on the hemoglobin (Hb) and mean corpuscular volume (MCV).
Microcytosis in the setting of an elevated RDW is frequently associated with iron deficiency anemia and hemoglobinopathies, whereas macrocytosis is associated with reactive erythropoiesis, vitamin B12 and folate deficiencies, and bone marrow disorders such as myelodysplastic syndromes (MDS) and leukemias. Although the number of studies is limited, high MCV has also been shown to be associated with worse outcomes in certain conditions, including coronary artery disease [22], and end stage renal disease [23], sometimes even in the absence of anemia. Conversely, in a group of patients with MDS with abnormal karyotypes, macrocytosis was actually associated with improved survival [24]. The etiology of anisocytosis and its relationship to MCV and clinical outcomes are less well understood, especially in non-anemic patients.
In this study, we first set out to confirm the association between an elevated RDW and all-cause mortality in a large diverse outpatient population. We then aimed to evaluate possible interactions between RDW and MCV by anemia status. More precise understanding of these interactions may allow us to better understand potential mechanisms by which elevated RDW predicts adverse outcomes. Furthermore, if the effect of anisocytosis on mortality significantly differs by MCV and anemia status, this observation would affirm the need to include interaction terms or subgroup stratifications for these variables in future studies examining RDW.
Methods
Patient population
All patients ≥65 years of age seen at an outpatient clinic within the Montefiore medical system from January 1, 1997 to May 1, 2008 who underwent a complete blood count (CBC) within 3 months of the earliest visit date were included in our cohort. To exclude acutely ill patients, individuals were removed from analysis if they were discharged from one of our inpatient facilities within 30 days prior to the index clinic visit. Ethnicity, age, and gender were determined based on registration information. Laboratory findings at various intervals were then extracted from the Montefiore Clinical Information System (CIS) database. Mortality data were matched based on patient name, medical record, and social security numbers. Prior IRB approval was obtained from the Institutional Review Board of the Albert Einstein College of Medicine and Montefiore Medical Center.
Definitions
Anemia was defined based on the World Health Organization (WHO) criteria of hemoglobin (Hb) < 13 g/dL in men, and < 12 g/dL in women. Patients were considered to have mild anemia if they met WHO criteria but had a Hb level that was >10 g/dL, and severe anemia if the Hb level was ≤10 g/dL. Thrombocytopenia was defined as a platelet count < 150 × 103 cells/mm3 while thrombocytosis was defined as >400 × 103 cells/mm3. Similarly, leukopenia was defined as < 4.8 × 10³ white cells/mm3 while leukocytosis was defined as >10.8 × 10³ white cells/mm3. Neutropenia was defined as < 1,500/μL. Patients with MCVs of < 80 fL were defined as having microcytosis, and those with values >96 fL as having macrocytosis. Red blood cell diameter distribution width (RDW) was considered abnormal for values >16.6. All CBC parameters were performed using Sysmex XE2100 automated analyzers from a centralized lab.
Statistical analyses
Baseline characteristics were compared using two sample tests of proportions and Student’s t-test for means. To confirm the predictive value of an elevated RDW and MCV, we then calculated age/Hb/gender-adjusted hazard ratios (HRs) for overall mortality by anemia status using multivariate Cox regression models. To assess for interaction between RDW and MCV, we calculated adjusted HRs comparing patients with an elevated RDW and those without after stratifying by MCV status. This was repeated for differing degrees of anemia. If the effect of RDW was found to be different by MCV, an interaction term between the two variables was then added to the regression model to confirm statistical significance. To further illustrate the effect of interaction, we then calculated adjusted HRs for patients with an elevated RDW, patients with macrocytosis, and patients with both (using patients with neither finding as the comparison group). Lastly, to compare survival and assess prognostic implications, Kaplan–Meier curves were constructed and log-rank tests performed by various subgroups of RDW, MCV, and anemia status. All analyses were conducted using Version 11.0 of the STATA statistical package [25].
Results
A high prevalence of elderly anemia is seen in an inner city outpatient population
A total of 15,593 men and 24,758 women who were at least 65 years of age and seen in outpatient clinics from January 1, 1997 to May 1, 2008 met our inclusion criteria. To exclude patients that were acutely ill, we excluded 4,125 patients who were discharged from an inpatient facility within 30 days of the index clinic visit. Our final study population thus consisted of 13,867 men and 22,359 women. Baseline characteristics by anemia status are presented in Table I. More than half of our population consisted of minorities (58.9% were either African-American or Hispanic). The overall prevalence of baseline anemia per WHO criteria was 29.3% in our population, with men having a higher prevalence than women (33.1% vs. 26.9%, P < 0.001). The overall prevalence of mild anemia (WHO criteria but Hb >10 g/dL) and severe anemia (Hb ≤10 g/dL) in our cohort was 26% and 6%, respectively. In our population, solitary anemia was observed in 58.9% of all anemic patients (61.1% in mildly anemic and 47.4% in severely anemic patients). Concurrent leukocytosis was more common in severely anemic patients, while leukopenia and neutropenia were associated with all levels of anemia. Among subjects with mild anemia, 11.0% had leukocytosis, 15.5% had leukopenia, and 1.9% had neutropenia. In the same group, 5.1% had thrombocytosis while 8.4% had thrombocytopenia. All of these figures were higher for those with severe anemia (22.1% with leukocytosis, 17.8% with leukopenia, 3.5% with neutropenia, 14.8% with thrombocytosis, and 14.6% with thrombocytopenia). Both microcytosis and macrocytosis were equally represented in the mildly anemic population (12.7% and 12.4%, respectively), even though a majority of the anemias were normocytic (74.9%). In the severely anemic group, microcytosis was twice as common as macrocytosis (31.1% vs. 16.8%). Lastly, an elevated RDW was found in 11.9% of mildly anemic patients and 41.1% of severely anemic patients, compared to only 2.5% in non-anemic patients.
TABLE I.
CBC/Baseline Characteristics by Anemia Status (% With Finding)
| All patients (n = 36,226) | Non-anemic (n = 25,619, 71%) | Mildly anemica (n = 8,860, 26%) | Severely anemicb (n = 1,747, 6%) | |
|---|---|---|---|---|
| Mean Age (SD) | 72.8 (6.8) | 72.2 (6.5) | 74.0* (7.3) | 74.6* (7.7) |
| % Men | 38 | 36.2 | 44.5* | 36.5 |
| Ethnicity | ||||
| Non-Hispanic Whites | 25.5 | 24.5 | 24.1 | 26.7* |
| Non-Hispanic Blacks | 26.5 | 23.1 | 34.5* | 34.5* |
| Hispanics | 32.4 | 34.8 | 26.7* | 26.1* |
| Other/Declined/Unknown | 16.6 | 17.6 | 14.8* | 12.7* |
| Mean Hb (SD) | 13.0 (1.7) | 13.8 (1.1) | 11.5* (0.7) | 9.0* (1.0) |
| WBC | ||||
| >10.8 | 8.7 | 9.1 | 11.0* | 22.1* |
| <4.8 | 10.6 | 9.9 | 15.5* | 17.8* |
| Absolute Neutrophil Count (ANC) | ||||
| <1500 | 1.5 | 1.3 | 1.9* | 3.5* |
| Platelets | ||||
| >400 | 3.4 | 2.1 | 5.1* | 14.8* |
| <150 | 6.7 | 5.6 | 8.4* | 14.6* |
| <100 | 1.3 | 0.8 | 2.0* | 5.8* |
| MCV | ||||
| <80 | 6.7 | 4.1 | 12.7* | 31.1* |
| >96 | 9.8 | 9.6 | 12.4* | 16.8* |
| RDW | ||||
| >16.6 | 6.6 | 2.5 | 11.9* | 41.1* |
WHO Criteria but Hb>10 g/dL.
Hb ≤ 10 g/dL
P <0.05 (compared to non-anemic group).
Elevated RDW is a strong predictor of increased mortality
Next, we proceeded to analyze hematologic factors to determine their effect on survival in these subjects. Age, hemoglobin, and gender-adjusted HRs by CBC characteristics are presented in Table II. In all anemic patients, an elevated RDW was associated with the greatest risk of mortality (HR = 1.87, P < 0.05). Performing the same Cox regression analyses by different severities of anemia demonstrated a higher HR in those with mild anemia (HR = 2.10, P < 0.05) but not those with severe anemia (HR = 1.46, P < 0.05). Neutropenia was also associated with increased mortality in anemic patients, but only among those with severe anemia (HR = 1.40, P < 0.05). Microcytosis was not an independent predictor of mortality in elderly anemic patients, but macrocytosis was associated with increased risk in the mildly anemic cohort (HR = 1.26, P < 0.05 for all anemics; HR = 1.31, P < 0.05 in mildly anemic patients only). Lastly, in non-anemic patients, anisocytosis was the greatest predictor of increased mortality (HR = 3.66, P < 0.05). This association was stronger than macrocytosis (HR = 1.39, P < 0.05), leukocytosis (HR = 1.94, P < 0.05), leukopenia (HR = 0.90, P = 0.07), neutropenia (HR = 0.86, P = 0.31), thrombocytopenia (HR = 1.60, P < 0.05), and thrombocytosis (HR = 1.94, P < 0.05). We then calculated adjusted HRs by RDW quintiles and found a dose-response effect between increasing RDW quintiles and risk of mortality (Fig. 1). The adjusted HR comparing lowest (RDW < 13.2) to highest (>15.1) RDW quintiles was 2.54 (P < 0.001).
TABLE II.
Age/Hb/Gender-Adjusted Hazard Ratios (HR) for All-Cause Mortality by CBC Characteristic (≥65 years)
| Non-anemic (Mean Hb = 13.8) | WHO criteria (Mean Hb = 11.1) | Milda (Mean Hb = 11.5) | Severeb (Mean Hb = 9.0) | |
|---|---|---|---|---|
| Microcytic | 1.15 | 0.91 | 1.02 | 0.77* |
| Macrocytic | 1.39* | 1.26* | 1.31* | 1.10 |
| RDW >16.6 | 3.66* | 1.87* | 2.10* | 1.46* |
| WBC >10.8 | 1.94* | 1.49* | 1.61* | 1.25* |
| WBC <4.8 | 0.90 | 0.92 | 0.86* | 1.15 |
| ANC <1500 | 0.86 | 1.24* | 1.22 | 1.40* |
| Platelet <150 | 1.60* | 1.43* | 1.35* | 1.56* |
| Platelet >400 | 1.94* | 1.57* | 1.78* | 1.27* |
WHO criteria but Hb>10 g/dL.
Hb ≤ 10 g/dL.
P <0.05.
Figure 1.
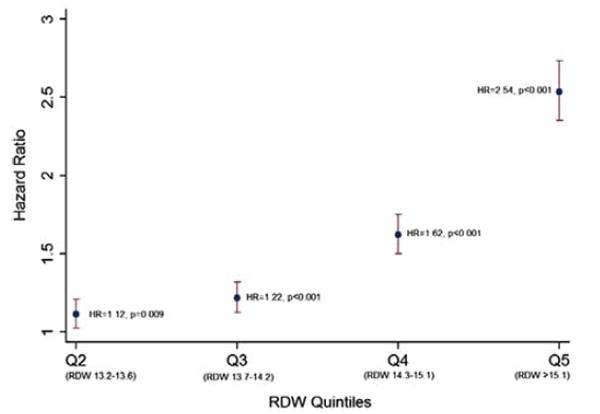
Age/Hb/gender-adjusted hazard ratios by RDW quintiles (compared to Q1).
Multiplicative interaction observed between RDW and MCV in non-anemic patients
To access for multiplicative effect of RDW by MCV and anemia status, Cox regression analyses for an elevated RDW were performed after stratifying by anemia status and MCV. Age, hemoglobin, and gender-adjusted HRs for each subgroup are presented in Table III. An elevated RDW resulted in a HR of 2.31 (P < 0.05) for the entire cohort. The risk is significantly increased in non-anemics (HR = 3.66, P < 0.05) compared to anemics (HR = 1.87, P < 0.05). The risk was slightly higher in mildly anemics (P = 2.10, P < 0.05) compared to severely anemics (P = 1.46, P < 0.05). When stratification was performed based on MCV status, we found that an elevated RDW in non-anemic patients with macrocytosis yielded a much higher HR (5.22, P < 0.05) compared to those with a normal MCV (HR = 3.86, P < 0.05) and those with microcytosis (HR = 2.46, P < 0.05). This pronounced effect was not observed in patients with anemia (HRs = 1.93, 2.23, and 1.61, respectively). To confirm multiplicative interaction between RDW and MCV, we entered an interaction term between RDW and MCV and found it to be statistically significant in the same Cox regression model with P=0.03. To observe the strength of the interaction, we calculated individual adjusted HRs for an elevated RDW, an elevated MCV and for elevations in both (Tables IV and V). In non-anemic patients (Table IV), an elevated RDW by itself resulted in a HR of 3.82. Similarly, an elevated MCV alone resulted in a HR of 1.36. When comparing patients with both an elevated RDW and macrocytosis to those with neither, we observed an elevated HR of 7.76 (higher than expected in an additive model). We repeated this analysis for anemic patients and this multiplicative effect was not observed (HR 1.27 for elevated RDW, 2.26 for elevated MCV, 2.23 for both).
TABLE III.
Age/Hb/Gender-Adjusted Hazard Ratios (HR) for All-Cause Mortality by RDW (>16.6 vs ≤16.6), Stratified by MCV
| All patients | Non-anemic | WHO criteria | Milda | Severeb | |
|---|---|---|---|---|---|
| All Patients | 2.31* | 3.66* | 1.87* | 2.10* | 1.46* |
| Normocytic | 2.75* | 3.86* | 2.23* | 2.34* | 1.99* |
| Microcytic | 1.82* | 2.46* | 1.61* | 1.81* | 1.22 |
| Macrocytic | 2.68* | 5.22* | 1.93* | 2.40* | 1.29 |
WHO criteria but Hb >10 g/dL.
Hb ≤ 10 g/dL.
P <0.05.
TABLE IV.
Age/Hb/Gender-Adjusted Hazard Ratios (HR) for All-Cause Mortality for Elevated RDW and Macrocytosis (vs. Neither) in Non-Anemic Patients
P <0.05
TABLE V.
Age/Hb/Gender-Adjusted Hazard Ratios (HR) for All-Cause Mortal- for Elevated RDW and Macrocytosis (vs. Neither) in Anemic Patients
P <0.05
Macrocytosis and elevated RDW are strongly predictive of decreased survival in both anemic and non-anemic patients
To assess the predictive value of using both RDW and MCV for risk stratification, we constructed Kaplan–Meier survival curves for each RDW and MCV category by anemia status. In both non-anemic (Fig. 2a) and anemic patients (Fig. 2b), survival was worse for those with macrocytosis and an elevated RDW. The median survival for this group of patients was 2.7 years in non-anemics and 2.2 years in anemics (vs. >10 years and 8.6 years, respectively, in patients with normal RDW and MCV). For both non-anemic and anemic patients, stratifying by RDW and MCV allowed us to create subgroups with clear survival differences. Patients with an elevated RDW had worse survival than those without. Among both groups, survival was worst in patients with macrocytosis, followed by normocytosis then microcytosis. This pattern remained consistent regardless of anemia status.
Figure 2.
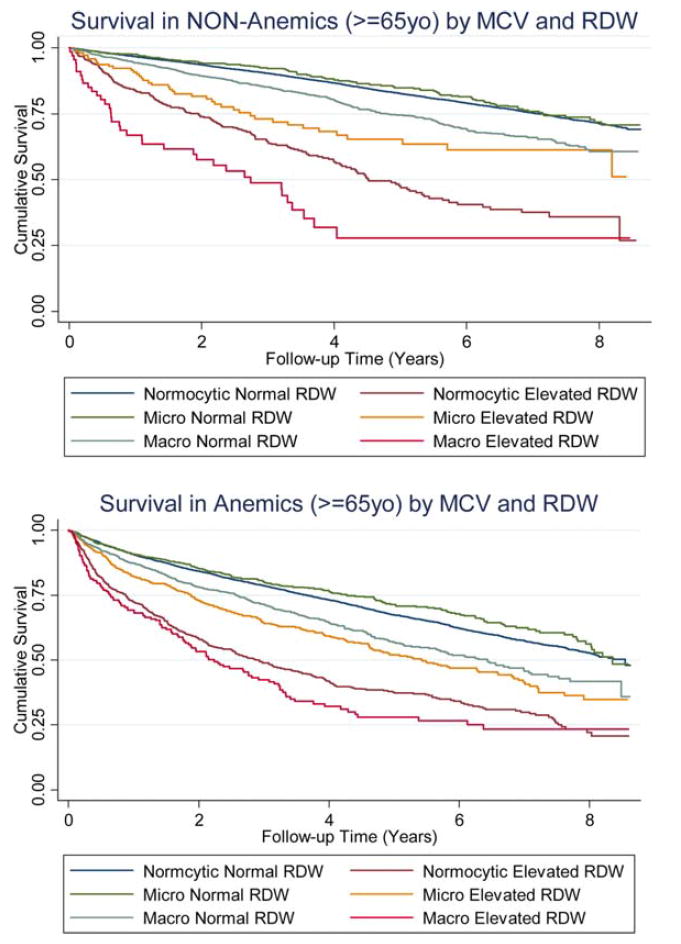
(a) Survival in non-anemics (age ≥ 65 years) by MCV and RDW. (b) Survival in anemics (age ≥ 65 years) by MCV and RDW.
Discussion
In recent years, there has been increased interest in studying anisocytosis as a predictor of adverse outcomes. A PubMed title/abstract search for the terms “RDW” and “Mortality” demonstrates an exponential increase in publications on the topic since 2009 (Supporting Information Fig. 3). As studies on RDW continue to rise, it is important to understand the complexity of this hematologic index, and appropriately account for it methodologically to maximize its use as a clinical predictor. It has been well established that etiologies of anisocytosis differ by both anemia status and MCV. Although most studies of RDW have adjusted for hemoglobin by including it as a covariate in regression models, very few studies have examined the role of MCV in this analysis. We hypothesized that the effect of RDW on overall mortality likely differs by MCV and set out to explore potential interaction between these two variables in a large diverse outpatient population. Since the underlying conditions responsible for both anisocytosis and its associated adverse outcomes are invariably different in anemic and non-anemic patients, we performed separate analyses for each subset of patients. To our knowledge, this is the first study to investigate potential interaction between RDW and MCV in predicting overall mortality.
We first set out to confirm the association between anisocytosis and overall mortality and observed an overall hazard ratio of 2.31. This is similar to results previously reported in other observational studies of community dwelling adults and hospitalized patients. Whereas most studies to date have compared lowest to highest quintiles/quartiles of RDW, we used our laboratory cutoff of 16.6 for an abnormal value to simplify interpretation of the hazard ratio in the clinical setting and to maximize statistical power in anticipation of multiple substratifications. For completeness, we reanalyzed the data comparing adjusted HRs for lowest to highest quintile of RDW and found similar results (Fig. 1; HR =2.54 for Q5 vs. Q1, P < 0.001).
When stratifying by anemia status, we found that the strength of the association between anisocytosis and overall mortality to be much higher in non-anemic patients than anemic patients (HR = 3.66 vs. 1.87). When further stratifying by severity of the anemia, the risk of an elevated RDW was higher in mildly anemic patients than those with severe anemia (HR = 2.10 vs. 1.46). A similar observation was previously noted in an observational study of cardiac patients undergoing percutaneous coronary intervention [3]. Poludasu et al. reported RDW as a strong predictor of mortality in non-anemic patients (HR = 8.65 for Hb >12.6 g/dL) but not anemic patients (HR = 0.97 for Hb < 10.4 g/dL). The different effect of RDW on mortality by anemia status is not surprising as the underlying causes of anisocytosis are drastically different in anemic and non-anemic patients. Both we, and Poludasu et al., were able to observe this phenomenon only after stratifying by anemia status. Although the primary goal of our study is to investigate potential interaction between RDW and MCV, our results confirm that such an interaction exists also for RDW and anemia status as well. The true impact of an elevated RDW on mortality is dependent on anemia and may be missed if hemoglobin is simply treated as a covariate without first excluding anemic or non-anemic patients.
To assess interaction between MCV and RDW, we calculated adjusted HRs after stratifying by MCV in both anemic and non-anemic patients. In non-anemic patients, macrocytosis increased the effect of RDW on overall mortality (HR = 5.22 vs. 2.46 in microcytic patients and 3.86 in normocytic patients). We confirmed this apparent synergy with calculated HRs for each of these independent variables separately and concurrently and found that a multiplicative interaction was present only among non-anemic patients. Just as stratification by anemia status is needed when studying RDW as an independent variable for adverse outcomes, it is equally important to stratify by MCV. Simply including RDW, MCV, and hemoglobin as covariates in a regression model may mask the true strength and direction of the association.
One important potential confounder not included in our regression models was ethnicity. As noted in Table I, African-Americans, but not Hispanics, have higher prevalence of mild and severe anemia. To further explore whether the observed interaction between MCV and RDW differs by ethnicity, we recalculated adjusted HRs for each MCV/RDW subgroup of non-anemic patients and stratified by ethnicity (Table VI). Interestingly, we found that the interaction between MCV and RDW among non-anemics to be minimal among Hispanic patients (HRs between 4.08 and 4.68 among different MCV subgroups). This is in large part due to the unexpected increased risk of mortality associated with an elevated RDW among non-anemic Hispanic patients with microcytosis. To our knowledge, no previous study of RDW has examined ethnicity and MCV concurrently. Future studies are needed to better understand the underlying causes of microcytosis in non-anemic Hispanics and how they differ in Caucasian and African-American patients.
TABLE VI.
Age/Hb/Gender-Adjusted Hazard Ratios (HR) for All-Cause Mortality by RDW (>16.6 vs ≤16.6) in Non-Anemic Patients, Stratified by MCV and Ethnicity
| Whites (n = 6,286) | Blacks (n = 5,927) | Hispanics (n = 8904) | |
|---|---|---|---|
| All Patients | 3.90* | 3.42* | 4.02* |
| Normocytic | 3.98* | 4.00* | 4.08* |
| Microcytic | 2.26* | 2.08* | 4.68* |
| Macrocytic | 5.32* | 5.75* | 4.37* |
P <0.05.
In addition to their impact on research methodology, the observed interactions between anemia status, MCV, and RDW give clues to the biological mechanisms in which RDW predicts adverse outcomes. To date, an elevated RDW has been associated with overall mortality, as well as a broad array of adverse outcomes in patients with cardiac, pulmonary, gastrointestinal, renal, infectious, and neurologic conditions. The ubiquitous nature and varying degrees of the observed association make it difficult to isolate a specific underlying physiologic state that links anisocytosis to these adverse clinical events. As previously mentioned, anisocytosis is found in a diverse array of clinical conditions and its cause may often be multifactorial. The biological pathways that lead to anisocytosis differ in anemic and non-anemic patients, and often by MCV. By stratifying by anemia status and MCV in future studies of RDW and noting changes in the association between subgroups and in different clinical settings, we may be able to gain insight into the biologic mechanisms that link RDW to various adverse outcomes.
For our final analysis, we assessed the usefulness of including MCV when performing risk stratifications by RDW by constructing Kaplan–Meier curves for overall survival using RDW/MCV subgroups (Fig. 2a,b). We found that combining anisocytosis with MCV improves the ability of RDW to predict overall survival in both anemic and non-anemic patients. Future studies of RDW as a prognostic indicator may benefit from inclusion of similar subgroups.
Although we were able to collect data for a large and diverse outpatient cohort, our study had several important limitations. First, we did not include a variety of laboratory tests for conditions associated with microcytosis and macrocytosis such as iron panel, vitamin B12, folic acid, thyroid function panel, etc. Although we had access to these results, we deferred their inclusion at this time since they were only ordered for a select subgroup of patients (unlike RDW and MCV, which were included as part of the CBC for all patients in this study). Including these select results would likely introduce selection bias as patients who underwent these supplementary tests are likely to have had symptoms or other underlying illnesses. Our current goal is to establish the relationship between RDW, MCV, and mortality in a large generalizable outpatient cohort.
Lastly, an important limitation of this study was our inability to perform chart reviews for such a large number of patients. Ideally, we would like to have assessed the reason for the initial visit and indications for the baseline blood draw. Similarly, complete chart reviews would also give us details regarding the patient’s comorbidities, medication and transfusion history, further diagnostic tests such as bone marrow biopsies, and cause of death. We are currently in the process of reviewing billing and ICD codes to extract these parameters for the subgroup of non-anemic patients with macrocytosis at baseline (n = 2,355). We hope to make further comparisons between patients with and without anisocytosis in this subgroup to better understand the observed interaction between RDW and MCV.
Lastly, one other important limitation of this study is our analysis of hematologic parameters based on baseline values. Hemoglobin, RDW, and MCV change with time and misclassifications of these independent variables are possible. We are in the process of collecting all available laboratory data over the follow-up period and will plan to perform further analysis of trends to better appreciate the dynamic nature of the above interactions.
In summary, we confirm that anisocytosis is associated with an increased risk of all-cause mortality in a large and diverse elderly outpatient population. We also demonstrate that the strength of this association differs by both anemia and MCV (i.e., presence of interaction). An elevated RDW confers the greatest risk of death in non-anemic patients with macrocytosis. The use of RDW as a prognostic index is greatly enhanced when used in combination with MCV. Future studies of RDW should include stratifications by both anemia status and MCV to avoid potentially spurious results. Noting the impact of anemia and MCV on the effect of RDW on other adverse outcomes will undoubtedly provide insight into potential biological mechanisms.
Footnotes
Conflict of interest: Nothing to report.
Additional Supporting Information may be found in the online version of this article.
References
- 1.Patel KV, Ferrucci L, Ershler WB, et al. Red blood cell distribution width and the risk of death in middle-aged and older adults. Arch Intern Med. 2009;160:515–523. doi: 10.1001/archinternmed.2009.11. [DOI] [PMC free article] [PubMed] [Google Scholar]
- 2.Martinez-Velilla N, Ibanez B, Cambra K, et al. Red blood cell distribution width, multimorbidity, and the risk of death in hospitalized older patients. Age. 2012;34:717–723. doi: 10.1007/s11357-011-9254-0. [DOI] [PMC free article] [PubMed] [Google Scholar]
- 3.Poludasu S, Marmur JD, Weedon J, et al. Red cell distribution width (RDW) as a predictor of long term mortality in patients undergoing percutaneous coronary intervention. Thromb Haemost. 2009;102:581–587. doi: 10.1160/TH09-02-0127. [DOI] [PubMed] [Google Scholar]
- 4.Fatmeni O, Paranilam J, Rainow A, et al. Red cell distribution width is a predictor of mortality in patients undergoing percutaneous coronary intervention. J Thromb Thrombolysis. 2013;35:57–64. doi: 10.1007/s11239-012-0767-x. [DOI] [PubMed] [Google Scholar]
- 5.Tonelli M, Sacks F, Arnold M, et al. Relation between red blood cell distribution width and a cardiovascular event rate in people with coronary disease. Circulation. 2008;117:163–168. doi: 10.1161/CIRCULATIONAHA.107.727545. [DOI] [PubMed] [Google Scholar]
- 6.Cavusoglu E, Chopra V, Gupta A, et al. Relation between red blood cell distribution width (RDW) and all-cause mortality at two years in an unselected population referred for coronary angiography. Int J Cardiol. 2010;141:141–146. doi: 10.1016/j.ijcard.2008.11.187. [DOI] [PubMed] [Google Scholar]
- 7.Felker GM, Allen LA, Pocock SJ, et al. Red cell distribution width as a novel prognostic indicator in heart failure. JACC. 2007;50:40–47. doi: 10.1016/j.jacc.2007.02.067. [DOI] [PubMed] [Google Scholar]
- 8.Hammarsten O, Jacobsson S, Fu M. Red cell distribution width in chronic heart failure: A new independent marker for prognosis? Eur J Heart Fail. 2012;12:213–214. doi: 10.1093/eurjhf/hfp208. [DOI] [PubMed] [Google Scholar]
- 9.Zalawadiya SK, Zmily H, Farah J, et al. Red cell distribution width and mortality in predominantly African-American population with decompensated heart failure. J Card Fail. 2011;17:292–298. doi: 10.1016/j.cardfail.2010.11.006. [DOI] [PubMed] [Google Scholar]
- 10.Dabbah S, Hammerman H, Markiewicz W, et al. Relation between red cell distribution width and clinical outcomes after acute myocardial infarction. Am J Cardiol. 2010;105:312–317. doi: 10.1016/j.amjcard.2009.09.027. [DOI] [PubMed] [Google Scholar]
- 11.Rhodes CJ, Wharton J, Howard LS, et al. Red cell distribution width outperforms other potential circulating biomarkers in predicting survival in idiopathic pulmonary arterial hypertension. Heart. 2011;97:1054–1060. doi: 10.1136/hrt.2011.224857. [DOI] [PubMed] [Google Scholar]
- 12.Hampole CV, Mehrotra AK, Thenappan T, et al. Usefulness of red cell distribution width as a prognostic marker in pulmonary hypertension. Am J Cardiol. 2009;104:868–872. doi: 10.1016/j.amjcard.2009.05.016. [DOI] [PubMed] [Google Scholar]
- 13.Zorlu A, Bektasoglu G, Guven FM, et al. Usefulness of red cell distribution width as a predictor of early mortality in patients with acute pulmonary embolism. Am J Cardiol. 2012;109:128–134. doi: 10.1016/j.amjcard.2011.08.015. [DOI] [PubMed] [Google Scholar]
- 14.Lee JH, Chung HJ, Kim K, et al. Red cell distribution width as a prognostic marker in patients with community-acquired pneumonia. Am J Emerg Med. 2013;31:72–79. doi: 10.1016/j.ajem.2012.06.004. [DOI] [PubMed] [Google Scholar]
- 15.Cakal B, Akoz AG, Ustundaq Y, et al. Red cell distribution width for assessment of activity of inflammatory bowel disease. Dig Dis Sci. 2009;54:842–847. doi: 10.1007/s10620-008-0436-2. [DOI] [PubMed] [Google Scholar]
- 16.Cantaro S, Piva E. Hematological and iron parameters to predict mortality in ESRD. G Ital Nefrol. 2005;31:S135–S139. [PubMed] [Google Scholar]
- 17.Kim J, Kim YD, Song TJ, et al. Red blood cell distribution width is associated with poor clinical outcome in acute cerebral infarction. Thromb Haemost. 2012;108:349–356. doi: 10.1160/TH12-03-0165. [DOI] [PubMed] [Google Scholar]
- 18.Ani C, Ovbiagele B. Elevated red blood cell distribution width predicts mortality in persons with known stroke. J Neurol Sci. 2009;277:103–108. doi: 10.1016/j.jns.2008.10.024. [DOI] [PubMed] [Google Scholar]
- 19.Sadaka F, O’Brien J, Prakash S. Red cell distribution width and outcome in patients with septic shock. J Intensive Care Med. 2012 Jul 17; doi: 10.1177/0885066612452838. [Epub ahead of print] [DOI] [PubMed] [Google Scholar]
- 20.Allen LA, Felker GM, Mehra MR, et al. Validation and potential mechanisms of red cell distribution width as a prognostic marker in heart failure. J Card Fail. 2010;16:230–238. doi: 10.1016/j.cardfail.2009.11.003. [DOI] [PMC free article] [PubMed] [Google Scholar]
- 21.Ferrucci L, Guralnik JM, Woodman RC, et al. Proinflammatory state and circulating erythropoietin in persons with and without anemia. Am J Med. 2005;118:1288. doi: 10.1016/j.amjmed.2005.06.039. [DOI] [PubMed] [Google Scholar]
- 22.Myojo M, Iwata H, Kohro T, et al. Prognostic implication of macrocytosis on adverse outcomes after coronary intervention. Atherosclerosis. 2012;221:148–153. doi: 10.1016/j.atherosclerosis.2011.11.044. [DOI] [PubMed] [Google Scholar]
- 23.Tennankore KK, Soroka SD, West KA, et al. Macrocytosis may be associated with mortality in chronic hemodialysis patients: A prospective study. BMC Nephrol. 2011;12:19. doi: 10.1186/1471-2369-12-19. [DOI] [PMC free article] [PubMed] [Google Scholar]
- 24.Wang H, Wang X, Xu X, et al. Mean corpuscular volume predicts prognosis in MDS patients with abnormal karyotypes. Ann Hematol. 2010;89:671–679. doi: 10.1007/s00277-010-0912-6. [DOI] [PubMed] [Google Scholar]
- 25.StataCorp. Stata Statistical Software: Release 11. College Station, TX: StataCorp LP; 2009. [Google Scholar]