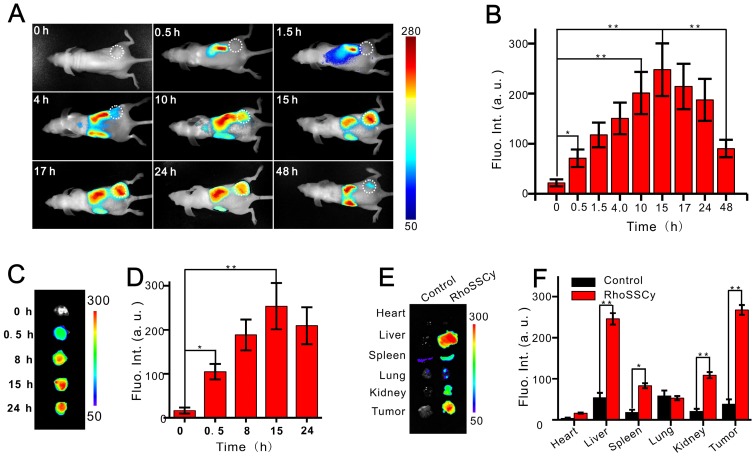
Figure 5.
Tumor targeting NIRF imaging based on RhoSSCy. (A) NIRF imagings of tumor (white circle) in living mice at different time intervals after injection of RhoSSCy. (B) Semiquantitative fluorescent intensity (Fluo. Int.) of the tumor at indicated time-points. (C) Ex vivo NIRF imaging of dissected tumor tissue after tail vein injection of RhoSSCy. (D) Semiquantitative biodistribution of RhoSSCy in tumor determined by the averaged fluorescent intensity. (E) Ex vivo NIRF imaging of dissected tumor and organs come from mice in blank group (Control) and mice injected with RhoSSCy after 15 h postinjection. (F) Semiquantitative fluorescent intensity of dissected tumor and organs at indicated time-points. *P < 0.05, **P<0.01.

