Figure 2.
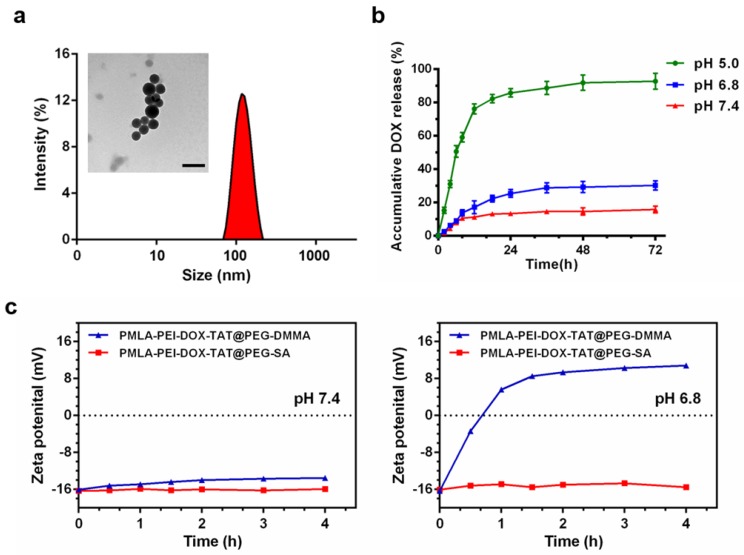
(a) DLS and TEM results of the nanocomplex PMLA-PEI-DOX-TAT@PEG-DMMA, the scale bar is 200 nm. (b) Release profile of DOX from the nanocomplex PMLA-PEI-DOX-TAT@PEG-DMMA in PBS (pH 5.0, pH 6.8 or pH 7.4) at 37 ºC. (c) Zeta potential changes of PMLA-PEI-DOX-TAT@PEG-DMMA and PMLA-PEI-DOX-TAT@PEG-SA nanocomplexes when incubating at pH 7.4 and 6.8 for different time periods.

