

Abstract
Single cell genomics offers powerful tools for studying lymphocytes, which make it possible to observe rare and intermediate cell states that cannot be resolved at the population-level. Advances in computer science and single cell sequencing technology have created a data-driven revolution in immunology. The challenge for immunologists is to harness computing and turn an avalanche of quantitative data into meaningful discovery of immunological principles, predictive models, and strategies for therapeutics. Here, we review the current literature on computational analysis of single cell RNA-seq data and discuss underlying assumptions, methods, and applications in immunology, and highlight important directions for future research.
Keywords: single cell RNA-seq, visualization, dimensionality reduction, immune repertoire
Single Cell RNA-Sequencing
In the past decade advances in computing and sequencing technologies have ushered in a new era of discovery in immunology. In particular, single cell RNA-sequencing (scRNA-seq, see Glossary) has enabled an unprecedented view of gene expression in single cells [1,2]. For cells of the immune system, at least two computational and bioinformatic challenges exist for effectively harnessing single cell genomics data. The first challenge lies in visualizing single cell gene expression data in a biologically meaningful way while remaining robust to the high levels of noise that is present in single cell data. The second challenge lies in exploiting single cell sequencing data to infer immune repertoire, and thus information on cell specificity and function.
The use of single cell based technologies in immunology has a rich history. Since the 1960s flow cytometry has remained an indispensible tool to the modern immunologist [3–5]. Not only does flow cytometry allow for characterization of single cells by size, granularity and expression of cell markers, but it also maintains cell viability allowing for subsequent sorting of these populations for downstream use. For example, isolation of single cells by flow cytometry coupled with traditional or quantitative PCR has been quite useful for evaluation of selected gene expression profiles and identification of immune repertoires [6–8]. A recent advancement in flow cytometry includes index sorting, where cell marker expression information obtained during flow cytometry is retained for each individual cell, further enhancing downstream single cell analyses [9]. Although flow cytometry has experienced substantial improvement over the years, it remains limited by the number of cell markers that can be simultaneously combined for analysis [4]. As a consequence, much of foundational immunology has been elucidated with only a handful of markers. In response to this deficit, Cytometry by Time of Flight (CyTOF) was designed. This approach allows for an order of magnitude more cell markers to be used to differentiate populations of interest [10]. However, in CyTOF (as with flow cytometry) a panel of proteins must be defined a priori, rendering these technologies unable to perform a truly unbiased survey of factors expressed in a single cell.
scRNA-seq is revolutionary with its ability to offer an entirely unbiased strategy for identification and characterization of distinct cellular populations through quantification of all transcripts expressed in a single cell. Recent immunological studies utilizing scRNA-seq have identified novel subpopulations [11–14], and elaborated cellular differentiation pathways [15,16]. For instance, scRNA-seq was used to uncover the developmental states in myelopoiesis and infer the underlying regulatory genes [16]. scRNA-seq has also revealed previously unappreciated cellular functions [17,18], such as up-regulation of the steroid synthesis pathway in Th2 cells following helminth infection, resulting in the suppression of both Th cell proliferation and B cell immunoglobulin class recombination [17]. Additionally, scRNA-seq has helped to unveil the complexities of tumor microenvironments [19], exposing a connection between transcriptional heterogeneity within tumors and prognostic outcome [20,21].
The applications of scRNA-seq are extensive and proper execution of data analysis is essential. Significant effort over the past few years has resulted in an initial framework to process and analyze scRNA-seq data. However, many important challenges remain unsolved for the effective use of scRNA-seq data. Here we include in our review some of the outstanding technological limitations specific to scRNA-seq and unique computational considerations in data processing and analysis for immunology research (Figure 1, key figure).
Figure 1. (Key Figure): Single Cell RNA-Sequencing Analysis Outline.

The standard workflow of single cell RNA-sequencing (scRNA-seq) studies begins with isolation of single cells; followed by library generation and high throughput RNA sequencing. Multiple computational and bioinformatics tools exist for quantifying gene expression. In general, these tools report the amount of reads that are associated with a specific gene, typically normalizing for gene length and library size. Before gene expression quantification, it is important to perform quality control analyses, including filtering for reads quality and eliminating cells with overall low library size. After quantification, batch effect, dropout effect and amplification bias should also be considered in normalizing scRNA-seq gene expression data (see Figure 2). Ultimately, scRNA-seq data can be subjected to dimensionality reduction algorithms to reveal different cell subpopulations, potentially infer their developmental trajectory during a dynamic process, and, if applicable, use sequencing data to identify their adaptive receptor sequence to assess questions of clonality and specificity. See Box 1 for an example of a typical processing pipeline.
Data Processing
A common theme among scRNA-seq approaches is use of oligo recognition of the mRNA polyA tails for cDNA generation, followed by amplification and subsequent sequencing [22]. Once high throughput reads from a well-designed scRNA-seq experiment are obtained, there is a plethora of analysis packages available as well as many quality control measures (we do not discuss here as it is extensively reviewed elsewhere [23,24]). Broadly, quality control should be performed on the reads themselves and across the cells in an effort to prune low quality data prior to analysis. Therefore, an important element of engaging in scRNA-seq studies is the use of specialized computational and bioinformatic tools for quality control and data processing.
In this section we review typical methods for gene expression quantification and consider special challenges related to scRNA-seq data processing, including: batch effects, dropout effects, and amplification bias (Figure 2). Accurate gene expression quantification is a key prerequisite for down-stream analysis of scRNA-seq data. Here we emphasize the importance of data processing by invoking the longstanding cautionary statement “garbage-in garbage-out”, as unaddressed technical biases and effects can drastically undermine scRNA-seq studies.
Figure 2. Single Cell RNA-Sequencing Specific Challenges.
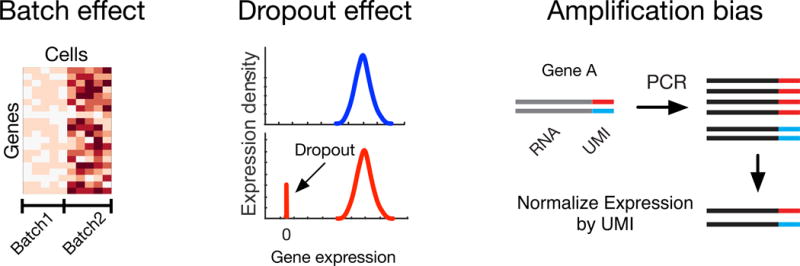
Single cell RNA-seq (scRNA-seq) is by nature a fragile and sensitive technique. Experimental challenges inherent to this approach can confound data analysis and should be accounted for. First, technical batch effects can cause the data to artificially cluster by batch, overshadowing the biological variability. Second, dropout effect causes an enrichment of non-biological zero values that results in a bimodal expression profile, which can impair subpopulation analysis. Finally, certain genes may experience preferential gene amplification, introducing a bias that is difficult to adjust for. The use of UMI can help account for amplification bias and allow for more accurate quantification of starting RNA levels.
Gene Expression Quantification
A number of the tools available for bulk RNA-seq processing have been successfully adopted by scRNA-seq. For gene expression quantification some examples include; STAR, RSEM, the Tuxedo Suite, and Kallisto [25–29]. These approaches map sequencing reads to a reference genome, a transcriptome index or perform de novo assembly without a reference genome to allow for expression quantification. The gene expression is typically reported as raw counts, RPKM/FPKM or TPM, which are different but related measurements. Counts are simply a count of the reads mapping to a gene, whereas the other units have undergone an additional normalization step on a per-cell basis to account for library depth as well as gene transcript length [30,31]. Roughly, these measurements represent a value reflecting the units of a gene transcript in a cell. There is ambiguity in the field regarding which measurement to use, and additional subsequent forms of normalization are recommended for accurate comparison across samples [23,32].
Batch Effect
Among the most challenging aspects of harnessing data from scRNA-seq is the processing of multiple datasets that have been produced across different batches [33,34]. These batches originate from sample number limitations inherent in most scRNA-seq protocols. Batch effects can confound experimental variables of interest and have long been appreciated for their dangers in gene expression analysis [32,35]. The primary danger in ignoring batch effects can be illustrated by erroneous situations where different cells in a single batch demonstrate greater correlation than identical cells from different batches [33,36,37] (Figure 2). Here, a statistical model can be used to directly subtract bias from known batch assignments [35,38] (See Box 1). In particular, ComBat uses parametric and non-parametric empirical Bayes frameworks to describe the expression of genes through an additive combination of batch effect variables [35]. Despite technological advances increasing the number of samples in each batch, as seen with Drop-seq [39–41], multiple batches are still commonly used to assess cellular heterogeneity or to reproduce earlier findings; thus batch correction maintains its relevance [41].
Box 1: Example Pipeline.
There are many approaches available to move scRNA-seq following QC measures to the point of exploratory analysis and here we present an example pipeline. This is meant to illustrate example tools that can be used at each step and we point readers to references that explore a more comprehensive array of options available at each step. The command line terminal is denoted with ‘$’ and the commands used by an R package are denoted with ‘R$’.
Alignment and Quantification
The first step in analysis involves gene expression quantification. We illustrate a simple example using Kallisto, which quantifies expression quickly due to its use of transcriptome psuedoalignment [25,29]. The output from Kallisto will provide gene expression in transcripts per million (TPM) which is normalized for library depth. Other popular alternatives (see main text) will work here as well.
$ kallisto quant –i index_file_name –o output_name data.fastq
Normalization and Batch correction
The TPM values will then need to be log transformed to help force the raw data into a ‘normal like’ distribution. It is important to add 1 (or some small value) to the expression value prior to conversion, due to the large amount of zeros present in data of this type (see dropout section in main text).
R$ log_data <- Log2(TPM+1)
After log transformation, one should remove known batch effects. ComBat is an algorithm available as an R package that has shown success with this for scRNA-seq [35,67]. Here we define an annotation file with the batch variable assigned for every sample.
R$ library(limma)
R$ library(sva)
R$ CB_data <- ComBat(log_data, batch=annotation_file$BatchVar)
Exploratory data analysis
Next, filtering cells and genes based on appropriate quality control measures may improve downstream analyses. Some popular options include; sample read depth, percentage reads aligned/pseudoaligned and number of genes detected above zero. Genes with no variance should be excluded, and it is also common to require expression to be detectable across a certain percentage of cells for inclusion (ex. 20% [11]).
With the normalized and filtered dataframe one can begin to address a wide range of specific biological questions with all of the available packages (expansively outlined elsewhere [23,68]). Here we show dimensionality reduction and visualization, which is a common first step. Both PCA and t-SNE are good places to start due to extensive use and documentation. Here is an example of t-SNE, using Rtsne (https://github.com/jkrijthe/Rtsne). The dataframe needs to be samples (rows) by genes (columns) and here we indicate the parameter suggestions from a previously published scRNA-seq study [14].
R$ library(‘rtsne’)
R$ t_sne <- Rtsne(t(CB_data), theta = .001, perplexity = 30, initial_dims = 10)
R$ plot(t_sne$Y, col = annotation_file$variable_of_interest)
One way to assess the impact of batch effects on the experimental data is to use PCA to examine how variance along the principal dimensions segregates the single cell data by known batch variables [42]. If single cell data appears to segregate with the batch in which the cells were processed, more effort may be needed to remove batch effects, including using surrogate variables for identifying and estimating unknown sources of variation and adjusting the data to remove these effects [38]. This adjusted dataset can be used for downstream analysis, where biological differences should no longer be confounded by experimental batch. However, the trade-off is that greater efforts to remove batch effects may impose homogeneity in the data and impair or reduce true signals associated with differentially expressed genes.
Dropout Effect
Due to the relatively low levels of RNA present in single cells, several biases manifest in scRNA-seq data. One problem that bears importance is a dropout effect. Here, identical cells processed through scRNA-seq may yield different gene expression profiles with absent expression for some genes due to technical limitations of the amplification process [12,43–45]. For example, the PCR may have been unable to amplify the gene, potentially due to competition between genes preventing comprehensive amplification. This is detected by an inflation of zero values which results in bimodal gene expression profiles [12] (Figure 2). Here, removal of cells through a quality control process, where a baseline number of genes needs to be present, may be a reasonable method to proceed [11,24]. An emerging trend in computational analyses of scRNA-seq data is to specifically account for dropout effects by imputing missing values using probabilistic models, such as in ZIFA [44] and BISCUIT [45]. The BISCUIT algorithm probabilistically models the entire data using cell-specific scaling factors to impute missing values. Filling in these missing values can help reveal biologically relevant trends in data, previously obscured by dropout-missing values. Although quality control and imputation algorithms help to address this bias, it is likely technological modifications to the sequencing chemistry may be needed to fully address dropout effects.
Amplification Bias
Concomitant with dropout effect is another concern known as amplification bias. Here, specific genes may (or may not) preferentially amplify due to the nonrandom priming of sequences. This problem is pronounced for scRNA-seq due to the higher number PCR cycles typically involved in amplifying RNA, and generating cDNA, material from a single cell. One mechanism to try and account for amplification bias in scRNA-seq data is to use unique molecular identifiers (UMI) or barcodes prior to amplification [46]. The principle of this approach is that unique barcodes will randomly ligate to each molecule of starting RNA, allowing a better estimate of original transcript numbers after amplification and controlling for gene specific bias (Figure 2). However, this is susceptible to other unforeseen biases such as ligation bias, and recent data suggests UMI’s remain susceptible to biological and technical variation [34]. A complementary method to address sample-specific amplification bias involves the use of External RNA Control Consortium (ERCC) spike-in controls, where the RNA sample is “spiked” with some known quantity of RNA [47]. Then, after quantification, gene expression profiles can be normalized against spike-in levels. Unfortunately, spiked-in RNA adds another layer of complexity to scRNA-seq protocols that is expensive in time and resources and remains susceptible to the same amplification and batch effects as all other genes. It is important to note that UMI and spike-ins, whether used separately or together, are still unable to resolve dropout effects since cell specific technical variations, such as RNA extraction efficiency, will occur before barcoding or introduction of spike-ins.
Altogether, we have highlighted here several challeges associated with the processing of scRNA-seq data. While important progress has been made in the field, there remains a critical need in developing effective computational methods to normalize scRNA-seq data so that biological variability in gene expression can be quantified in an accurate manner.
Visualization of scRNA-seq Data
One of the most compelling applications of single cell genomics to immunology resides in characterizing the population structure of single cells. Visualization of scRNA-seq data can help to identify rare and intermediate subpopulations that are overlooked with bulk RNA-seq data. The goal of visualization algorithms is to project high-dimensional data into a low dimensional space, thus resolving cellular groups based on their transcriptional similarity without any predetermined markers dictating their identity (Figure 1). In this section we review two standard dimensionality reduction algorithms used to visualize scRNA-seq data and highlight their applications to immunology.
Principle component analysis (PCA) is a linear dimensionality reduction algorithm with long standing popularity for high-dimensional data [48]. PCA takes an input of correlations between cells based on gene expression data, and identifies principal components corresponding to linear combinations of genes, which cumulatively capture the variability of the total dataset. When the data is projected against the first few components, which account for the largest amount of variation, distinct populations can be visually and biologically interpreted. This approach has led to improved characterization of hematopoietic stem cells [15] and Th17 heterogeneity [11], among many others. A convenient aspect of PCA analysis is that information on the contribution of each gene to the component is maintained allowing for further biological interrogation of the clusters [49]. Gaublomme et al., 2015 exploited this powerful feature when detecting cellular heterogeneity within the autoimmune Th17 compartment. Previously identified cell subset transcriptional information was projected into their PCA space to resolve PC1’s connection to differentiation between effector to memory T cells and PC2’s connection to cellular origin [11].
A comparable non-linear algorithm is called t-SNE [50]. Unlike PCA, which seeks to capture variance in data, t-SNE seeks to explicitly preserve the local structure of the original data. t-SNE constructs a probability distribution to describe the dataset such that pairs of similar cells are assigned a high probability, while dissimilar pairs are assigned with a much smaller probability. Thus, cells that are similar in the high-dimensional space will cluster together (due to high probability) in low-dimensional space. This ability to explicitly maintain clustering of similar cells is an advantage of t-SNE over direct linear transformation such as PCA. This approach is very effective with scRNA-seq data, and has been used for characterizing subpopulations in innate lymphoid cells [14], the tumor-immune microenvironment [20,19,21,51], as well as exposing Aire-dependent transcriptional program stochasticity [13]. Specifically, when looking at innate lymphoid cell type 3 (ILC3) populations the use of t-SNE was able to resolve a third, transcriptionally distinct population that had been indistinguishable with PCA [14].
Despite the successes of t-SNE in effectively visualizing scRNA-seq data, there are two algorithmic drawbacks that are critical for immunologists to note. First, due to the stochastic nature of t-SNE, the same dataset may produce different visualizations in different runs [50]. Thus, it is important to run t-SNE on the same dataset multiple times in order to obtain a strong intuition of the population structure. Second, while t-SNE maintains clusters by placing cells that are similar in the original space together in the low-dimensional space, cells that are dissimilar in the original space may not necessarily be placed proportionally apart in low-dimensional space [50].
Overall, dropout effects remain a challenge for dimensionality reduction algorithms such as PCA and t-SNE. In particular, PCA may provide misleading results in the single cell setting, where the first component may seek to explain variability in data due to dropout effects [33]. Algorithms that impute the missing values have shown great promise with dimensionality reduction algorithms, by significantly improving the separation of distinct subpopulations; thus facilitating differential expression and other downstream analyses [44,45].
Trajectory inference
A related application of single cell genomics to immunology resides in inferring cell developmental trajectories [52–54]. Here, scRNA-seq can be used to help elucidate a temporal ordering of cells when immune cells are captured during an immune process such as cell development and differentiation during hematopoiesis (Figure 1). The primary computational challenge lies in ordering single cells into a trajectory that best models the progression of the cells during an immunological process, while overcoming the noise inherent in single cell data.
Several algorithms, such as SCUBA, Monocle and Wishbone, perform trajectory inference from scRNA-seq data [53–55]. Overall, these algorithms exploit the similarity between single cells to infer transitional links. These methods harness dimensionality reduction to measure cell similarity from a low-dimensional space, such that cells that are linked in a trajectory will be close in space and transcriptionally similar. Importantly, this allows for visualization of both the single cell data and the inferred developmental paths connecting different cellular states. An inherent assumption in these methods is that the developmental process is gradual and that the intermediate cellular states are fully represented in the single cell data. Furthermore, the choice of trajectory inference methods also depends on whether the algorithm must handle linear developmental (Monocle) or bifurcating trajectories (SCUBA, Wishbone). For example, Wishbone was used to recover the known stages of T-cell development in the mouse thymus, including the bifurcation point between CD4+ and CD8+ T cells that occurs at the end of the double positive stage. Importantly, the algorithm demonstrated utility with both CyTOF data and scRNA-seq data [55]. The accuracy of these algorithms is predicated on whether intermediate cellular states were properly sampled in the data and some knowledge of the underlying structure of the cellular dynamic processes.
The choice of dimensionality reduction algorithms used to visualize and to infer cell similarity, along with the capacity to identify bifurcating developmental trajectories, needs careful thought for immunology applications. Overall, the development, and proper use, of these algorithms is an active research topic in the field of scRNA-seq data analysis.
Immune repertoire
Characterizing the diverse repertoire of an ongoing immune response has proven quintessential to our understanding of human health. This was first tackled at the single cell level with cell fusion hybridomas in the 80s and eventually progressed to PCR based receptor chain cloning and recombinant protein expression. These tools exposed key components of the basic biology behind T and B cells, some examples include; VDJ rearrangement in T cells [56], somatic hypermutation (SHM) [57], and the identification of memory B cells [58] and analysis of single B cell specificities [59]. These approaches have also had significant therapeutic impact with the identification of broadly neutralizing antibodies [60] and in some current cancer immunotherapy approaches [61].
Now, scRNA-seq has exposed new opportunities to analyze the immune repertoire and its impact on immune cell function, simultaneously allowing both for capture of quantitative gene expression as well as repertoire sequence information for both chains (α/β, light/heavy) of the receptor (Figure 1). The assembly of full-length BCR or TCR sequences from scRNA-seq is a non-trivial problem. On the one hand, reference-based assembly methods that rely on an initial alignment of reads to a genome are vulnerable to the somatic rearrangements and mutations. On the other hand, de novo assembly methods typically require solving a noisy and complex genome-scale assembly task that makes targeted assembly error-prone. Here we review the available methods for assembling TCR or BCR sequences from scRNA-seq data.
TraCeR [62] was the first tool for T cell receptor (TCR) reconstruction from scRNA-seq, followed quickly by VDJPuzzle [63]. Whereas, BASIC is currently the only algorithm designed specifically for B cells and the only approach that performs its own assembly of the V(D)J receptor sequence [64]. All three approaches follow the same two main steps; a filter step and an assembly step. The filter step acquires the RNA-seq reads that align to all possible gene segments used in V(D)J recombination, or align to a comprehensive database of artificial recombinomes utilizing these genes. The assembly step is crucial, as the receptor sequence cannot be identified by alignment alone due to the large amount of junctional diversity introduced during receptor rearrangement. For this TraCeR and VDJPuzzle both utilize a popular de novo transcriptome assembly software package, Trinity, to construct the TCR [65]. Alternatively, BASIC uses an identified conserved sequence anchor in both the 5′ (V gene) and 3′ (Constant region) end of the receptor to perform semi-de novo BCR assembly, by extending these anchors in either direction with varying k-mers of overlapping sequence. In most cases the sequence from the constant region and variable region for each chain will eventually overlap, resulting in a single transcript being reported for each chain. However, if the sequences do not meet, both a constant and variable contig will be reported for that chain. The receptor sequences generated by all three of these algorithms were confirmed with PCR-based receptor amplification followed by Sanger sequencing, and demonstrated high accuracy with murine splenic CD4+ T cells, human peripheral blood antigen specific CD8+ T cells, and human peripheral blood plasmablasts [6,7].
This novel ability to link repertoire and transcriptome information at the single cell level opens many new avenues for investigation, such as links between transcriptomes and; clonality, receptor specificity, receptor affinity, receptor gene usage, complementarity determining region (CDR) loop variability, BCR mutation load, and BCR isotype. Already, this innovative combination showed that the T cell clonotypes responding to a murine Salmonella infection come from diverse T cell compartments and it identified a previously unappreciated repertoire diversity within HCV specific T cells before and after ex vivo cell culture [62,63]. Prior interrogation of both questions was impossible, and it will be very exciting to see what else this powerful new combination brings in the future.
Concluding remarks
Single cell RNA-sequencing has opened the door to a new era of research, with unprecedented power. In this review we highlighted some of the obstacles impeding meaningful analysis of scRNA-seq data, as well as touch upon some computational tools for interpreting these large complex high-dimensional datasets. Unfortunately, due to the relative youth of the field, only a limited number of tools have been developed to address the complexity of high-dimensional scRNA-seq data sets. Further, there is as yet a lack of standardization for analyses in the field. Regardless of the difficulties associated with data analysis, the field of immunology has embraced this new tool with fervor, resulting in outstanding recent discoveries [11,18,17,12,20,19,21,51,52,66]. Needless to say, there remain many unanswered questions that eagerly await the application of scRNA-seq (see outstanding questions). While not yet routine, recent advances in microfluidics are allowing significantly larger number of cells to be barcoded and processed for scRNA-seq [1,39–41]. As the magnitude of data obtained from these experiments continues to grow, and the popularity of the approach spreads, scRNA-seq will likely become a standard method for studying immunological cellular heterogeneity.
Outstanding Questions.
How to adjust for batch effects, dropout effects, and technical biases in scRNA-seq data so that gene expression can be quantified in an accurate manner?
How best to visualize heterogeneous populations of immune cells in order to resolve distinct and novel sub-types of immune cells despite technical noise such as dropout effects?
How to resolve immune process across time-course from specific and complicated niches, such as; germinal center affinity maturation, and memory B cell formation?
How does gene expression correlate with B and T cell clonal relatedness, receptor specificity and affinity?
Trends.
Single cell RNA-sequencing is a powerful tool for profiling individual immune cells, particularly during immune system development and response.
Specialized computational methods for processing and analyzing single cell data are making it possible to observe rare and intermediate cell states that cannot be resolved at the population-level.
Single cell RNA-sequencing for B and T cells allows for both capture of quantitative gene expression as well as immune repertoire information at single cell resolution.
Acknowledgments
This project has been funded in parts with federal funds from the National Institute of Allergy and Infectious Diseases, National Institutes of Health grant numbers: U19AI109946 (P.C.W.), U19AI057266 (P.C.W.), U19AI082724 (P.C.W.) and T32AI007090 (K.E.N).
Glossary
- Batch effect
Is the non-biological variation that can arise from technical differences between repeats or sequencing runs, and that must be accounted for before comparing across experiments
- Clonality
is the relationship between cells that originated from the same original cell, or clone, which can be identified by an identical receptor sequence. In the case of B cells, which can obtain additional point mutations during an immune response, clones are identified by the same gene usage and highly similar CDR loops
- Cytometry by Time of Flight (CyTOF)
is another approach to identify distinct populations by known extra- or intracellular targets. Cells are stained with antibodies conjugated to transition element isotopes and vaporized in a way that induces ionization of the isotopes. Time of flight mass spectrometry reads the resulting elemental ions and can separate cells based on expression of the targets. It allows for the interrogation of a larger number of markers than conventional fluorescence-based flow cytometry
- Dimensionality reduction
is a process to reduce the number of variables for consideration through using a compressed set of principal variables. More specifically, Dimensionality reduction can be understood as projecting the data in the original high-dimensional space into much lower-dimensional space, while (roughly) capturing the concerned statistical properties (e.g. variation, distribution) and/or structure property (e.g. clusters). High dimensional data after dimensionality reduction are easier to store and faster for downstream computation. Moreover, when projecting the data to 2 or 3 dimensional space, it is also easier for visualization
- Flow cytometry
a powerful tool used to separate populations of cells based on staining known markers with antibodies conjugated to fluorophores. The fluorophores are excited with a laser giving a read out of expression levels
- Gene Expression
is the scaled and normalized expression units of a transcript, including reads per kilobase of exon per million reads mapped (RPKM), fragments per kilobase of exon per million reads mapped (FPKM), and transcripts per million (TPM). All three measures normalize a transcript’s expression by its length. In TPM, gene expression is further scaled and reported as the number of gene transcripts relative to all other transcripts present in a hypothetical pool of 1 million transcripts
- Junctional Diversity
prior to ligation of the selected genes during V(D)J recombination, coding end hairpins form between the 5′ and 3′ strands of DNA. Key enzymes are recruited to cleave the hairpin and in this process random nucleotides are added and sometimes removed before the final gene pair ligation occurs. These regions of diversity make up the complementary determining (CDR) loops and will never be the same between cells, unless they are derived from the same initial clone
- PCA
is a linear dimensionality reduction algorithm, used to project high dimension data into a few ‘components’ that capture most of the variability in the data. It is a popular visualization technique that can help identify patterns or connections between samples
- R package
R is a statistical programming environment. Its package system enables the use of both statistical and graphical approaches and computational programs in a simple manner
- scRNA-seq
RNA-seq performed on an individual cell, amplification of the mRNA is required and usually involved oligos specific for the polyA tail of mRNA molecules or random hexamers
- Somatic Hypermutation (SHM)
the process by which point mutations are introduced into the B cell receptor during the process of affinity maturation against a given antigen
- t-Distributed stochastic neighbor embedding (t-SNE)
is a non-linear dimensionality reduction method, which seeks to preserve the local structure of data in high-dimensional space when projected into low-dimensional space
- Unique molecular identifier (UMI)
a short unique barcode of nucleotides added to the RNA of a single cell prior to reverse transcription. This allows for an accurate estimate of the original RNA levels and helps identify amplification bias
- V(D)J recombination
a sequential recombination process that is responsible for the generation of both chains of the B and T cell receptors. This process involves recombination at the DNA level a single V, sometimes D and J gene from the large number of genes available. During recombination junctional diversity is introduced resulting in a completely unique receptor sequence every time
Footnotes
Publisher's Disclaimer: This is a PDF file of an unedited manuscript that has been accepted for publication. As a service to our customers we are providing this early version of the manuscript. The manuscript will undergo copyediting, typesetting, and review of the resulting proof before it is published in its final citable form. Please note that during the production process errors may be discovered which could affect the content, and all legal disclaimers that apply to the journal pertain.
References
- 1.Jaitin DA, et al. Massively Parallel Single-Cell RNA-Seq for Marker-Free Decomposition of Tissues into Cell Types. Science. 2014;343:776–779. doi: 10.1126/science.1247651. [DOI] [PMC free article] [PubMed] [Google Scholar]
- 2.Tang F, et al. mRNA-Seq whole-transcriptome analysis of a single cell. Nat Meth. 2009;6:377–382. doi: 10.1038/nmeth.1315. [DOI] [PubMed] [Google Scholar]
- 3.Gray JW, et al. Chromosome measurement and sorting by flow systems. PNAS. 1975;72:1231–1234. doi: 10.1073/pnas.72.4.1231. [DOI] [PMC free article] [PubMed] [Google Scholar]
- 4.Saeys Y, et al. Computational flow cytometry: helping to make sense of high-dimensional immunology data. Nat Rev Immunol. 2016;16:449–462. doi: 10.1038/nri.2016.56. [DOI] [PubMed] [Google Scholar]
- 5.Fulwyler MJ. Electronic Separation of Biological Cells by Volume. Science. 1965;150:910–911. doi: 10.1126/science.150.3698.910. [DOI] [PubMed] [Google Scholar]
- 6.Smith K, et al. Rapid generation of fully human monoclonal antibodies specific to a vaccinating antigen. Nat Protocols. 2009;4:372–384. doi: 10.1038/nprot.2009.3. [DOI] [PMC free article] [PubMed] [Google Scholar]
- 7.Wang GC, et al. T-cell receptor αβ diversity inversely correlates with pathogen-specific antibody levels in human cytomegalovirus infection. Sci Transl Med. 2012;4:128ra42. doi: 10.1126/scitranslmed.3003647. [DOI] [PMC free article] [PubMed] [Google Scholar]
- 8.Ishizuka IE, et al. Single-cell analysis defines the divergence between the innate lymphoid cell lineage and lymphoid tissue-inducer cell lineage. Nat Immunol. 2016;17:269–276. doi: 10.1038/ni.3344. [DOI] [PMC free article] [PubMed] [Google Scholar]
- 9.Schulte R, et al. Index sorting resolves heterogeneous murine hematopoietic stem cell populations. Exp Hematol. 2015;43:803–811. doi: 10.1016/j.exphem.2015.05.006. [DOI] [PMC free article] [PubMed] [Google Scholar]
- 10.Bendall SC, et al. Single-Cell Mass Cytometry of Differential Immune and Drug Responses Across a Human Hematopoietic Continuum. Science. 2011;332:687–696. doi: 10.1126/science.1198704. [DOI] [PMC free article] [PubMed] [Google Scholar]
- 11.Gaublomme JT, et al. Single-Cell Genomics Unveils Critical Regulators of Th17 Cell Pathogenicity. Cell. 2015;163:1400–1412. doi: 10.1016/j.cell.2015.11.009. [DOI] [PMC free article] [PubMed] [Google Scholar]
- 12.Shalek AK, et al. Single-cell transcriptomics reveals bimodality in expression and splicing in immune cells. Nature advance online publication. 2013 doi: 10.1038/nature12172. [DOI] [PMC free article] [PubMed] [Google Scholar]
- 13.Meredith M, et al. Aire controls gene expression in the thymic epithelium with ordered stochasticity. Nat Immunol. 2015;16:942–949. doi: 10.1038/ni.3247. [DOI] [PMC free article] [PubMed] [Google Scholar]
- 14.Björklund ÅK, et al. The heterogeneity of human CD127+ innate lymphoid cells revealed by single-cell RNA sequencing. Nat Immunol. 2016;17:451–460. doi: 10.1038/ni.3368. [DOI] [PubMed] [Google Scholar]
- 15.Zhou F, et al. Tracing haematopoietic stem cell formation at single-cell resolution. Nature. 2016;533:487–492. doi: 10.1038/nature17997. [DOI] [PubMed] [Google Scholar]
- 16.Olsson A, et al. Single-cell analysis of mixed-lineage states leading to a binary cell fate choice. Nature. 2016;537:698–702. doi: 10.1038/nature19348. [DOI] [PMC free article] [PubMed] [Google Scholar]
- 17.Mahata B, et al. Single-Cell RNA Sequencing Reveals T Helper Cells Synthesizing Steroids De Novo to Contribute to Immune Homeostasis. Cell Reports. 2014;7:1130–1142. doi: 10.1016/j.celrep.2014.04.011. [DOI] [PMC free article] [PubMed] [Google Scholar]
- 18.Shalek AK, et al. Single-cell RNA-seq reveals dynamic paracrine control of cellular variation. Nature. 2014;510:363–369. doi: 10.1038/nature13437. [DOI] [PMC free article] [PubMed] [Google Scholar]
- 19.Powell AA, et al. Single Cell Profiling of Circulating Tumor Cells: Transcriptional Heterogeneity and Diversity from Breast Cancer Cell Lines. PLOS ONE. 2012;7:e33788. doi: 10.1371/journal.pone.0033788. [DOI] [PMC free article] [PubMed] [Google Scholar]
- 20.Patel AP, et al. Single-cell RNA-seq highlights intratumoral heterogeneity in primary glioblastoma. Science. 2014;344:1396–1401. doi: 10.1126/science.1254257. [DOI] [PMC free article] [PubMed] [Google Scholar]
- 21.Tirosh I, et al. Dissecting the multicellular ecosystem of metastatic melanoma by single-cell RNA-seq. Science. 2016;352:189–196. doi: 10.1126/science.aad0501. [DOI] [PMC free article] [PubMed] [Google Scholar]
- 22.Saliba AE, et al. Single-cell RNA-seq: advances and future challenges. Nucl Acids Res. 2014 doi: 10.1093/nar/gku555. [DOI] [PMC free article] [PubMed] [Google Scholar]
- 23.Bacher R, Kendziorski C. Design and computational analysis of single-cell RNA-sequencing experiments. Genome Biology. 2016;17:63. doi: 10.1186/s13059-016-0927-y. [DOI] [PMC free article] [PubMed] [Google Scholar]
- 24.Grün D, van Oudenaarden A. Design and Analysis of Single-Cell Sequencing Experiments. Cell. 2015;163:799–810. doi: 10.1016/j.cell.2015.10.039. [DOI] [PubMed] [Google Scholar]
- 25.Bray NL, et al. Near-optimal probabilistic RNA-seq quantification. Nat Biotech. 2016;34:525–527. doi: 10.1038/nbt.3519. [DOI] [PubMed] [Google Scholar]
- 26.Dueck H, et al. Deep sequencing reveals cell-type-specific patterns of single-cell transcriptome variation. Genome Biology. 2015;16:122. doi: 10.1186/s13059-015-0683-4. [DOI] [PMC free article] [PubMed] [Google Scholar]
- 27.Langmead B, Salzberg SL. Fast gapped-read alignment with Bowtie 2. Nat Meth. 2012;9:357–359. doi: 10.1038/nmeth.1923. [DOI] [PMC free article] [PubMed] [Google Scholar]
- 28.Li B, Dewey CN. RSEM: accurate transcript quantification from RNA-Seq data with or without a reference genome. BMC Bioinformatics. 2011;12:323. doi: 10.1186/1471-2105-12-323. [DOI] [PMC free article] [PubMed] [Google Scholar]
- 29.Ntranos V, et al. Fast and accurate single-cell RNA-seq analysis by clustering of transcript-compatibility counts. Genome Biology. 2016;17:112. doi: 10.1186/s13059-016-0970-8. [DOI] [PMC free article] [PubMed] [Google Scholar]
- 30.Li B, et al. RNA-Seq gene expression estimation with read mapping uncertainty. Bioinformatics. 2010;26:493–500. doi: 10.1093/bioinformatics/btp692. [DOI] [PMC free article] [PubMed] [Google Scholar]
- 31.Mortazavi A, et al. Mapping and quantifying mammalian transcriptomes by RNA-Seq. Nat Meth. 2008;5:621–628. doi: 10.1038/nmeth.1226. [DOI] [PubMed] [Google Scholar]
- 32.Zyprych-Walczak J, et al. The Impact of Normalization Methods on RNA-Seq Data Analysis. BioMed Research International. 2015;2015:e621690. doi: 10.1155/2015/621690. [DOI] [PMC free article] [PubMed] [Google Scholar]
- 33.Hicks SC, et al. On the widespread and critical impact of systematic bias and batch effects in single-cell RNA-Seq data. bioRxiv. 2015 doi: 10.1101/025528. [DOI] [Google Scholar]
- 34.Tung PY, et al. Batch effects and the effective design of single-cell gene expression studies. bioRxiv. 2016 doi: 10.1101/062919. [DOI] [PMC free article] [PubMed] [Google Scholar]
- 35.Johnson WE, et al. Adjusting batch effects in microarray expression data using empirical Bayes methods. Biostat. 2007;8:118–127. doi: 10.1093/biostatistics/kxj037. [DOI] [PubMed] [Google Scholar]
- 36.Gilad Y, Mizrahi-Man O. A reanalysis of mouse ENCODE comparative gene expression data. F1000Research. 2015 doi: 10.12688/f1000research.6536.1. [DOI] [PMC free article] [PubMed] [Google Scholar]
- 37.Vandenbon A, et al. Immuno-Navigator, a batch-corrected coexpression database, reveals cell type-specific gene networks in the immune system. Proc Natl Acad Sci U S A. 2016;113:E2393–E2402. doi: 10.1073/pnas.1604351113. [DOI] [PMC free article] [PubMed] [Google Scholar]
- 38.Leek JT, Storey JD. Capturing Heterogeneity in Gene Expression Studies by Surrogate Variable Analysis. PLOS Genet. 2007;3:e161. doi: 10.1371/journal.pgen.0030161. [DOI] [PMC free article] [PubMed] [Google Scholar]
- 39.Fan HC, et al. Combinatorial labeling of single cells for gene expression cytometry. Science. 2015;347:1258367. doi: 10.1126/science.1258367. [DOI] [PubMed] [Google Scholar]
- 40.Klein AM, et al. Droplet Barcoding for Single-Cell Transcriptomics Applied to Embryonic Stem Cells. Cell. 2015;161:1187–1201. doi: 10.1016/j.cell.2015.04.044. [DOI] [PMC free article] [PubMed] [Google Scholar]
- 41.Macosko EZ, et al. Highly Parallel Genome-wide Expression Profiling of Individual Cells Using Nanoliter Droplets. Cell. 2015;161:1202–1214. doi: 10.1016/j.cell.2015.05.002. [DOI] [PMC free article] [PubMed] [Google Scholar]
- 42.Leek JT, et al. Tackling the widespread and critical impact of batch effects in high-throughput data. Nat Rev Genet. 2010;11:733–739. doi: 10.1038/nrg2825. [DOI] [PMC free article] [PubMed] [Google Scholar]
- 43.Kharchenko PV, et al. Bayesian approach to single-cell differential expression analysis. Nat Meth. 2014;11:740–742. doi: 10.1038/nmeth.2967. [DOI] [PMC free article] [PubMed] [Google Scholar]
- 44.Pierson E, Yau C. ZIFA: Dimensionality reduction for zero-inflated single-cell gene expression analysis. Genome Biology. 2015;16:241. doi: 10.1186/s13059-015-0805-z. [DOI] [PMC free article] [PubMed] [Google Scholar]
- 45.Prabhakaran S, et al. Dirichlet Process Mixture Model for Correcting Technical Variation in Single-Cell Gene Expression Data; Proceedings of The 33rd International Conference on Machine Learning; 2016. pp. 1070–1079. [PMC free article] [PubMed] [Google Scholar]
- 46.Kivioja T, et al. Counting absolute numbers of molecules using unique molecular identifiers. Nat Methods. 2012;9:72–74. doi: 10.1038/nmeth.1778. [DOI] [PubMed] [Google Scholar]
- 47.Jiang L, et al. Synthetic spike-in standards for RNA-seq experiments. Genome Res. 2011;21:1543–1551. doi: 10.1101/gr.121095.111. [DOI] [PMC free article] [PubMed] [Google Scholar]
- 48.Principal Component Analysis. Springer-Verlag; 2002. [Google Scholar]
- 49.Ringnér M. What is principal component analysis? Nat Biotech. 2008;26:303–304. doi: 10.1038/nbt0308-303. [DOI] [PubMed] [Google Scholar]
- 50.Maaten, der L van, Hinton G. Visualizing Data using t-SNE. Journal of Machine Learning Research. 2008;9:2579–2605. [Google Scholar]
- 51.Cann GM, et al. mRNA-Seq of Single Prostate Cancer Circulating Tumor Cells Reveals Recapitulation of Gene Expression and Pathways Found in Prostate Cancer. PLOS ONE. 2012;7:e49144. doi: 10.1371/journal.pone.0049144. [DOI] [PMC free article] [PubMed] [Google Scholar]
- 52.Bendall SC, et al. Single-Cell Trajectory Detection Uncovers Progression and Regulatory Coordination in Human B Cell Development. Cell. 2014;157:714–725. doi: 10.1016/j.cell.2014.04.005. [DOI] [PMC free article] [PubMed] [Google Scholar]
- 53.Marco E, et al. Bifurcation analysis of single-cell gene expression data reveals epigenetic landscape. PNAS. 2014;111:E5643–E5650. doi: 10.1073/pnas.1408993111. [DOI] [PMC free article] [PubMed] [Google Scholar]
- 54.Trapnell C, et al. The dynamics and regulators of cell fate decisions are revealed by pseudotemporal ordering of single cells. Nat Biotech. 2014;32:381–386. doi: 10.1038/nbt.2859. [DOI] [PMC free article] [PubMed] [Google Scholar]
- 55.Setty M, et al. Wishbone identifies bifurcating developmental trajectories from single-cell data. Nat Biotech. 2016;34:637–645. doi: 10.1038/nbt.3569. [DOI] [PMC free article] [PubMed] [Google Scholar]
- 56.Kavaler J, et al. Localization of a T-cell receptor diversity-region element. Nature. 1984;310:421–423. doi: 10.1038/310421a0. [DOI] [PubMed] [Google Scholar]
- 57.Weigert MG, et al. Variability in the Lambda Light Chain Sequences of Mouse Antibody. Nature. 1970;228:1045–1047. doi: 10.1038/2281045a0. [DOI] [PubMed] [Google Scholar]
- 58.Klein U, et al. Human Immunoglobulin (Ig)M+IgD+ Peripheral Blood B Cells Expressing the CD27 Cell Surface Antigen Carry Somatically Mutated Variable Region Genes: CD27 as a General Marker for Somatically Mutated (Memory) B Cells. J Exp Med. 1998;188:1679–1689. doi: 10.1084/jem.188.9.1679. [DOI] [PMC free article] [PubMed] [Google Scholar]
- 59.Wardemann H, et al. Predominant Autoantibody Production by Early Human B Cell Precursors. Science. 2003;301:1374–1377. doi: 10.1126/science.1086907. [DOI] [PubMed] [Google Scholar]
- 60.Wilson PC, Andrews SF. Tools to therapeutically harness the human antibody response. Nat Rev Immunol. 2012;12:709–719. doi: 10.1038/nri3285. [DOI] [PMC free article] [PubMed] [Google Scholar]
- 61.Littman DR. Releasing the Brakes on Cancer Immunotherapy. Cell. 2015;162:1186–1190. doi: 10.1016/j.cell.2015.08.038. [DOI] [PubMed] [Google Scholar]
- 62.Stubbington MJT, et al. T cell fate and clonality inference from single-cell transcriptomes. Nat Meth. 2016;13:329–332. doi: 10.1038/nmeth.3800. [DOI] [PMC free article] [PubMed] [Google Scholar]
- 63.Eltahla AA, et al. Linking the T cell receptor to the single cell transcriptome in antigen-specific human T cells. Immunol Cell Biol. 2016 doi: 10.1038/icb.2016.16. [DOI] [PubMed] [Google Scholar]
- 64.Canzar S, et al. BASIC: BCR assembly from single cells. Bioinformatics. 2016 doi: 10.1093/bioinformatics/btw631. [DOI] [PMC free article] [PubMed] [Google Scholar]
- 65.Grabherr MG, et al. Full-length transcriptome assembly from RNA-Seq data without a reference genome. Nat Biotech. 2011;29:644–652. doi: 10.1038/nbt.1883. [DOI] [PMC free article] [PubMed] [Google Scholar]
- 66.Buettner F, et al. Computational analysis of cell-to-cell heterogeneity in single-cell RNA-sequencing data reveals hidden subpopulations of cells. Nat Biotech. 2015;33:155–160. doi: 10.1038/nbt.3102. [DOI] [PubMed] [Google Scholar]
- 67.Kim KT, et al. Single-cell mRNA sequencing identifies subclonal heterogeneity in anti-cancer drug responses of lung adenocarcinoma cells. Genome Biology. 2015;16:127. doi: 10.1186/s13059-015-0692-3. [DOI] [PMC free article] [PubMed] [Google Scholar]
- 68.Poirion OB, et al. Single-Cell Transcriptomics Bioinformatics and Computational Challenges. Front Genet. 2016 doi: 10.3389/fgene.2016.00163. [DOI] [PMC free article] [PubMed] [Google Scholar]