

Abstract
Studies were conducted to determine the performance of four dyes in assessing antiviral activities of compounds against three RNA viruses with differing cytopathogenic properties. Dyes included alamarBlue® measured by absorbance (ALB-A) and fluorescence (ALB-F), neutral red (NR), Viral ToxGlo™ (VTG), and WST-1. Viruses were chikungunya, dengue type 2, and Junin, which generally cause 100, 80-90, and 50% maximal cytopathic effect (CPE), respectively, in Vero 76. Compounds evaluated were 6-azauridine, BCX-4430, 3-deazaguanine, EICAR, favipiravir, infergen, mycophenolic acid (MPA), ribavirin, and tiazofurin. The 50% virus-inhibitory (EC50) values for each inhibitor and virus combination did not vary significantly based on the dye used. However, dyes varied in distinguishing the vitality of virus-infected cultures when not all cells were killed by virus infection. For example, VTG uptake into dengue-infected cells was nearly 50% when visual examination showed only 10-20% cell survival. ALB-A measured infected cell viability differently than ALB-F as follows: 16% versus 32% (dengue-infected), respectively, and 51% versus 72% (Junin-infected), respectively. Cytotoxicity (CC50) assays with dyes in uninfected proliferating cells produced similar CC50 values for EICAR (1.5-8.9 μM) and MPA (0.8-2.5 μM). 6-Azauridine toxicity was 6.1-17.5 μM with NR, VTG, and WST-1, compared to 48-92 μM with ALB-A and ALB-F.(P<0.001). Curiously, the CC50 values for 3-deazaguanine were 83-93 μM with ALB-F versus 2.4-7.0 μM with all other dyes including ALB-A (P<0.001). Overall, ALB minimized the toxicities detected with these two inhibitors. Because the choice of dyes affected CC50 values, this impacted on the resulting in vitro selectivity indexes (calculated as CC50/EC50 ratio).
Keywords: chikungunya virus, dengue virus, Junin virus, antiviral, dye assays
Introduction
Antiviral assays of test compounds are easiest done using viruses that cause discernible cytopathic effect (CPE), and these can be performed by several standard methods. Assays such as viral CPE reduction and viral plaque reduction are used to determine 50% effective (virus-inhibitory, or EC50) values (Clarysse et al., 2000; Hu and Hsiung, 1989; Sidwell and Smee, 2000). Cytotoxicity of the test compounds is best determined concurrently with uninfected cells to generate 50% cytotoxic (CC50) values. A selectivity index (SI) value can then be calculated, which is CC50/EC50. Compounds with SI values ≥10 are generally considered to be active in vitro. Occasionally there are compounds identified that have SI values below 10 that are effective in animal infection models. Thus, SI values obtained in vitro serve as a guide in the pursuit of active compounds for further drug development.
For rapid antiviral screening, the CPE reduction assay method is preferred over plaque reduction because it can be easily automated. Percent viral CPE can be assessed using an indicator dye that is easily quantified using a spectrophotometer, fluorometer, or luminometer. There are many dyes and stains available for these assays. Years ago our group published an article comparing seven different dyes and stains for determining EC50 and CC50 values of compounds against influenza virus infections (Smee et al., 2002). Reported in that article were results obtained using alamarBlue, bisbenzimide, crystal violet, fluorescein diacetate, MTT, neutral red, and rhodamine 6G. Because influenza is a highly lytic virus that destroys the cells after about 3 days of incubation, it was not surprising that all the dyes and stains performed similarly in detecting cell viability in infected cultures.
Since 2002 we have been working with a number of emerging viruses that vary in their robustness in killing cells. Many viruses cause 100% lysis of cultures, whereas others such as Junin cause only about 50% cell lysis. Using these different viruses we have screened thousands of compounds received from industrial and academic sponsors. The dye that we mostly use for EC50 and CC50 determinations is neutral red. Some sponsors question whether neutral red is optimal for testing their compounds, particularly when our cytotoxicity results determined by neutral red differ from theirs using another assay method. This report attempts to address this issue more broadly, by investigating both cytotoxicity and antiviral activity of various dyes against highly lytic and partially lytic RNA virus infections.
The viruses selected for the experiments were chikungunya (an alphavirus), dengue type 2 (a flavivirus), and Junin (an arenavirus). These viruses were chosen because they produce varying degrees of CPE in African green monkey kidney (Vero and Vero 76) cells. Under typical infection and incubation conditions, chikungunya, dengue type 2, and Junin viruses will kill about 100%, 80-90%, and 50% of the cells, respectively.
The dyes selected for the experiments comprise scientifically accepted ones that have different modes of action: alamarBlue® (hereafter referred to as alamarBlue), neutral red, Viral ToxGlo™ (hereafter referred to as Viral ToxGlo), and WST-1. AlamarBlue (resazurin) is an oxidation-reduction (REDOX) indicator that undergoes colorimetric and fluorometric changes in response to cellular metabolic reduction (Ahmed et al., 1994). The reduced form, resorufin, is pink and highly fluorescent and can also be detected colorimetrically. Resorufin diffuses outside of cells after being formed. Neutral red (toluylene red) is taken up by live cells into lysosomes (Borenfreund et al., 1988; Finter, 1969; Mosmann, 1983). As cells begin to die, their ability to incorporate neutral red diminishes. Neutral red remains cell-bound and must be extracted from cells for colorimetric quantitation. Viral ToxGlo measures cellular ATP as a surrogate measure of host cell viability. It is similar to the related Cell TiterGlo™ that has been used for high throughput antiviral screening (Maddry et al., 2011). The Viral ToxGlo reaction mixture kills cells in the process of assaying for intracellular ATP. WST-1 is a water-soluble form of MTT (Borenfreund et al., 1988; Yamamoto et al., 2002). Both compounds are reduced by NAD(P)H-dependent cellular oxidoreductase enzymes and undergo a color change. MTT enters cells, turns purple and remains cell-bound (requiring extraction), whereas WST-1 is reduced extracellularly or associated with the cell membrane (Berridge et al., 1996), and turns the cell culture medium yellow-orange.
Antiviral compounds selected for the study include 6-azauridine (Flint et al., 2014; Rada and Dragun, 1977; Smee et al., 1987), BCX4430 (Julander et al., 2014; Taylor et al., 2016), 3-deazaguanine (Allen et al., 1977; Smee et al., 2016), EICAR (De Clercq, 2015; De Clercq et al., 1991), favipiravir (Furuta et al., 2013; Mendenhall et al., 2011), Infergen™ (interferon alfacon 1, hereafter referred to as infergen) (Julander et al., 2007; Morrey et al., 2004), mycophenolic acid (Cline et al., 1969; Takhampunya et al., 2006; To et al., 2016), ribavirin (Sidwell et al., 1972; Smee et al., 1987; Westover et al., 2016), and tiazofurin (Baker et al., 2003; Huggins et al., 1984). All of the compounds have antiviral properties, but against different viruses. The compounds are nucleoside analogs, except for Infergen and mycophenolic acid, a non-nucleoside. Half of the compounds are cytostatic agents, although they may not specifically referred to as such, except for EICAR (Balzarini et al., 1998) and ribavirin (Muller et al., 1977). A cytostatic agent inhibits cell growth, but the cells will recover and resume growth if compound is removed from the culture medium. In these experiments antiviral activity and cytotoxicity results showed many similarities and some notable differences using these dyes, viruses, and compounds.
2. Materials and Methods
2.1. Antiviral compounds
6-Azauridine and mycophenolic acid (MPA) were purchased from Sigma Chemical Co. (St. Louis, MO, USA). BCX4430 was provided by BioCryst Pharmaceuticals (Birmingham, AL, USA). 3-Deazaguanine, ribavirin, and tiazofurin were obtained from the former ICN Pharmaceuticals (Costa Mesa, CA, USA). EICAR was kindly provided by Dr. Christopher Tseng (NIAID, Bethesda, MD, USA). Favipiravir was kindly provided by Dr. Yousuke Furuta (Toyama Chemical Company, Toyama, Japan). The above compounds were solubilized in cell culture medium at 5 mM (MPA) or 20 mM (all other compounds), and aliquots were frozen at -80°C before use. Infergen was obtained already in solution from InterMune (Brisbane, CA, USA), and was kept in aliquots at -20°C.
2.2. Dyes for assays
AlamarBlue was purchased from ThermoFisher Scientific (Waltham, MA, USA). Neutral red was acquired from Sigma Chemical Co. Viral ToxGlo was from Promega (Madison, WI, USA). WST-1 was obtained from Takara Bio USA (Mountain View, CA, USA).
2.3. Viruses, cells, and culture media
Chikungunya virus (S27 strain) and Junin virus (Candid #1 strain) were obtained from the American Type Culture Collection (ATCC; Manassas, VA, USA). Dengue virus Type 2 (New Guinea C strain) was acquired from the Centers for Disease Control and Prevention (Ft. Collins, CO, USA). Chikungunya was propagated and assayed in Vero 76 cells, dengue was propagated in C6/36 and assayed in Vero 76, and Junin virus was amplified and assayed in Vero cells. The cells were obtained from ATCC and were maintained and passaged in minimal essential medium (MEM) containing 5% fetal bovine serum (FBS). For antiviral and cytotoxicity assays performed with stationary (confluent) cell monolayers, cells were seeded into 96-well clear microplates or half-area opaque-walled microplates at 4 × 10⁴ cells/well and 2 × 10⁴ cells/well, respectively. For rapidly proliferating (sub-confluent) cells used for certain cytotoxicity assays, the cells were seeded at 1 × 10⁴ cells/well into clear plates. All of the plates were incubated overnight for about 18 h prior to use for assays. Viruses at infection were diluted to approximately 10 (chikungunya), 150 (dengue) and Junin (100) cell culture infectious doses (CCID50) per well of cells, which approximates a multiplicity of infection of ≤0.004. The assay medium contained 50 μg/mL gentamicin (Sigma) and either 2% or 5% FBS for confluent or sub-confluent (proliferating) cells, respectively.
2.4. Experimental design for studies
Test compounds at eight different half-log10 concentrations were tested for efficacy in infected cells and for cytotoxicity in uninfected cells in confluent Vero (for Junin virus) or Vero 76 (for chikungunya and dengue viruses) cell monolayers in 96-well microplates. Clear plastic cell culture plates were used for neutral red and WST-1, whereas white- and black-walled half-area cell culture plates were used for alamarBlue (for fluorescence and colorimetric readings) and Viral ToxGlo (for luminescence readings). Compounds at 2× concentration were first applied, followed within minutes by addition of an equal volume of virus suspensions. Two wells per compound dilution were used for assessing toxicity, three infected wells per dilution for assessing antiviral activity, six drug-free infected wells as virus controls, six uninfected drug-free wells as cell controls, and four background wells containing only water. After incubation (usually 3 days for chikungunya, 6 days for dengue, and 7-8 days for Junin virus infections), the microplates were read visually to estimate the percentage of cell destruction caused by the virus infection or by cytotoxicity. When maximum CPE was observed, each plate was treated with a different dye, as explained in the below section. To make comparisons valid, all compounds and dyes were tested concurrently in the same experiment against a particular virus. Two or three repeat experiments were performed per virus, assessing all the dyes and compounds each time. When maximum CPE was observed, each plate was treated with a different dye, followed by incubation of plates at 37°C, and reading using colorimetry (alamarBlue absorbance, neutral red, and WST-1), fluorometry (alamarBlue), or luminescence (Viral ToxGlo) detection. Incubation times of dyes with cells prior to reading was as follows: alamarBlue fluorescence: 2 h, alamarBlue absorbance (same plate as for fluorescence): 4 h, neutral red: 2 h, Viral ToxGlo: 15 min, and WST-1: 45 min. Absorbance units were converted to percentages of uninfected controls. Fifty percent virus inhibitory (EC50) or 50% cytotoxicity (IC50) values were determined by linear regression using an Excel spreadsheet. One way ANOVA with Tukey's multiple comparisons test was used to statistically analyze the data, using Instat® software (GraphPad Software, San Diego, CA, USA).
2.5. Procedures for processing plates stained with dyes
Each dye that was in kit form (i.e., all but neutral red) was used according to the manufacturer's instructions with slight modifications. Dyes were added to cells when viral CPE reached maximal for the particular virus evaluated. The amount of indicator dye used was 0.01 mL/well for alamarBlue, Viral ToxGlo, and WST-1; and 0.011% final concentration for neutral red. Incubation times of dyes on cells were as follows: alamarBlue fluorescence – 2 h; alamarBlue absorbance – 4 h; neutral red – 2 h; WST-1 – 45 min; and Viral ToxGlo – 10 min. After incubation, the plates were read with a Synergy HT plate reader (BioTek, Winooski, VT, USA). The alamarBlue fluorescence assay was read at 544 nm excitation and 590 nm emission. The alamarBlue absorbance was read at 570 and 600 nm. WST-1 absorbance was read at 450 nm. Viral ToxGlo was assayed by luminescence. A standard neutral red procedure was followed (Smee et al., 2002), except that the neutral red dye concentration reported in the publication is an error. After incubation the plates were aspirated dry and read later following addition of 0.1 ml of 50% Sörensen's citrate buffer (pH 4.0) in 50% ethanol to each well to desorb the dye. Neutral red plates were read at 540 nm.
For each dye readout, units were converted to percentages of uninfected controls using an Excel spreadsheet. Fifty percent virus inhibitory (EC50) or 50% cytotoxicity (IC50) values were determined by linear regression using Excel. One way ANOVA with Tukey's multiple comparisons test was used to statistically analyze the data, using Instat® software (GraphPad Software, San Diego, CA, USA).
2.6. Cell proliferation cytotoxicity assays using dyes in sequence the same microwells
Protocols were developed to use dyes in sequence in the same microplates for certain cytotoxicity studies. By using the same plates of cells with more than one dye, this would rule out plate-to-plate variability in cell numbers or activity as causes for differences seen in the performance of the dyes. Thus, pilot studies were first conducted to determine how dyes could be used in sequence. WST-1 and alamarBlue treatment caused no cell damage, and plates could be stained with a third dye, provided that the cell culture medium was replaced each time to remove the colored product. Neutral red exposure damaged cells and Viral ToxGlo killed them, thus, these dyes had to be used terminally. Therefore, the assay developed for dyes used in series were as follows: WST-1 followed by alamarBlue (read first by fluorescence, then later by absorbance), followed by either neutral red or Viral ToxGlo. Cells at about 30-40% confluency (to allow for cell proliferation) in 96-well black half-area plates were treated with compound in medium containing 4% fetal bovine serum. Six replicate plates were used, each one containing the same four test compounds at seven half-log10 concentrations plus a row of untreated control cells. Three plates were used for WST-1, alamarBlue, and neutral red combinations. The other three plates were used for WST-1, alamarBlue, and Viral ToxGlo combinations. After 4 days incubation, WST-1 was added directly to the plates. After incubation and reading, the medium was aspirated off and replaced with medium containing the test compound, followed by addition of alamarBlue. Plates were read at 2 h (fluorescence) and 4 h (absorbance). Then the medium was removed, and replaced with medium containing either neutral red or Viral ToxGlo (test compound was not present in the medium with the final dye). Plates were incubated for the appropriate times and subsequently read. Other investigators have reported using dyes in sequence in the same cell cultures (Ishiyama et al., 1996).
3. Results
3.1. Antiviral activities of test compounds
Ten compounds were evaluated for antiviral activity in vitro against the three RNA viruses with differing cytopathogenic potential (Table 1). Chikungunya virus was inhibited by 6-azauridine, 3-deazaguanine, EICAR, Infergen, and mycophenolic acid. Infergen was the most potent inhibitor of chikungunya virus. Dengue virus was inhibited by the same group of compounds, with infergen being most potent. In addition, BCX4430 showed weak dengue-inhibitory activity. Several compounds inhibited Junin virus, including 6-azauridine, 3-deazaguanine, EICAR, favipiravir, mycophenolic acid, and ribavirin. Interestingly, Junin virus was not inhibited by infergen, indicating its resistance to interferon. 6-Azauridine, 3-deazaguanine, EICAR and mycophenolic acid inhibited all three viruses. Only tiazofurin was found to be ineffective against the three viruses.
Table 1.
Antiviral activities of compounds against three RNA viruses with different cytopathogenic capabilities.
| Chikungunya (CPE=100%)a | Dengue Type 2 (CPE=80-90%) | Junin (CPE=50%) | ||||
|---|---|---|---|---|---|---|
| Compound | EC50b | SIc | EC50 | SI | EC50 | SI |
| 6-Azauridine | 8.0 ± 10.4 | >13 | 8.4 ± 10.8 | >12 | 0.7 ± 0.5 | >151 |
| BCX4430 | >100 | 0 | 37 ± 22 | >3 | >100 | 0 |
| 3-Deazaguanine | 13.0 ± 8.3 | >8 | 4.6 ± 6.3 | >22 | 1.6 ± 1.5 | >63 |
| EICAR | 10.3 ± 13.0 | >10 | 13.3 ± 22.1 | >8 | 1.9 ± 1.2 | >52 |
| Favipiravir | >100 | 0 | >100 | 0 | 4.4 ± 2.7 | >23 |
| Infergen (ng/mL) | 0.12 ± 0.1 | >87 | 0.76 ± 1.3 | >13 | >10 | 0 |
| Mycophenolic acid | 1.6 ± 1.7 | >61 | 4.5 ± 6.6 | >22 | 1.0 ± 0.6 | >100 |
| Ribavirin | >100 | 0 | >100 | 0 | 13.8 ± 11.2 | >7 |
| Tiazofurin | >100 | 0 | >100 | 0 | >100 | 0 |
Typical maximum cytopathic effect (as determined visually) achieved by the virus after infecting cells with the optimal virus challenge dose and incubating in cell culture for the appropriate time.
Mean 50% effective (virus-inhibitory) concentration values ± SD (N = ≥9 independent determinations) with units as follows: Infergen - ng/ml; all other compounds - μM. Data were obtained from alamarBlue (absorbance and fluorescence), neutral red, and Viral ToxGlo values averaged together, since each dye quantified viral CPE to about the same extent.
Selectivity Index (CC50/EC50 where CC50 = 50% cytotoxic concentration obtained in uninfected cells) values, based upon the following: Infergen - CC50 >10 ng/ml; all other compounds - CC50 >100 μM.
3.2. EC50 assay results comparing dyes
Comparisons were made of compound EC50 values generated by individual dyes in cells infected with the three virus types (Table 2), with statistical analyses performed. EC50 values were averaged together for four similarly active compounds against chikungunya and dengue viruses, and for six compounds inhibiting Junin virus. EC50 values that were generated with the four dyes ranged from 3.8-12.2 μM, 4.1-8.8 μM, and 1.6-2.6 μM against chikungunya, dengue, and Junin viruses, respectively. There were no statistically significant differences comparing EC50s of one dye against another dye tested against each virus. These results indicate that all of the dyes performed similarly for quantifying EC50 values.
Table 2.
Comparison of dyes in determining antiviral activities of compounds. For each virus, there were no significant differences (P>0.05) in EC50 values between the different dyes.
| Chikungunya (CPE=100%)a | Dengue Type 2 (CPE=80-90%) | Junin (CPE=50%) | ||||
|---|---|---|---|---|---|---|
| Dye | EC50b | Slc | EC50b | SI | EC50b | SI |
| ALBd-Abs | 8.1 ±8.7 | >12 | 7.0 ±8.5 | >14 | 2.1 ±2.1 | >48 |
| ALBd-Fluor | 5.4 ±6.2 | >19 | 6.6 ±9.8 | >15 | 2.6 ±3.6 | >38 |
| Neutral Red | 9.4 ±5.9 | >11 | 3.7 ±2.6 | >27 | 2.6 ±2.6 | >38 |
| Viral ToxGlo | 12.2 ±15.2 | >8 | 8.8 ±11.2 | >11 | 1.6 ±1.6 | >63 |
| WST-1 | 3.8 ±2.6 | >26 | 4.1 ±6.9 | >24 | 1.6 ± 1.5 | >63 |
Typical maximum cytopathic effect (as determined visually) achieved by the virus after infecting cells with the optimal virus challenge dose and incubating in cell culture for the appropriate time.
Mean 50% effective (virus-inhibitory) concentration ± SD, averaging results from 6-AzaUrd, 3-dzGua, and EICAR against chikungunya virus (N ≥ 6 independent determinations); or averaging results from 6-AzaUrd, 3-dzGua, EICAR, and MPA against dengue virus (N ≥ 8 independent determinations), since EC50 values for the compounds were similar against the respective virus. For Junin virus, values represent average EC50s of 6-AzaUrd, 3-dzGua, EICAR, MPA, and favipiravir (N = 10 independent determinations).
Selectivity Index = CC50/EC50 (where CC50 = 50% cytotoxic concentration, based on CC50>100 μM).
AlamarBlue, measured by absorbance (Abs) or fluorescence (Fluor).
3.3. Differential uptake or conversion of dyes in infected and uninfected cell cultures
We addressed how well the dyes discriminated between infected and uninfected cell cultures. Cultures visually exhibiting 50, 80-90, and 100% CPE should proportionally take up 0, 10-20, and 50% of the dye, respectively. If more dye than that is taken up, it indicates that the dye enters cells that appear visually to be dead. If less dye is taken up, then some of the infected cells are unable to take up dye compared to what the eye can discern. For these determinations the infected virus control wells were compared to uninfected cell control wells treated with the same dye (Figure 1). In the highly lytic chikungunya infection (Figure 1, upper panel) where 100% of cells appeared to be dead, the cells took up less than 6% of each dye, with the exception of WST-1 (14% uptake). In the dengue infection (Figure 1, middle panel), cell survival visually appeared to be about 15%. The alamarBlue absorbance detected 16% viability, whereas alamarBlue fluorescence detected 32% viability, even though these were the same microwells assayed. Detection of viability in infected cultures with neutral red, WST-1, and Viral ToxGlo were 24, 27, and 48% respectively. Thus, Viral ToxGlo was least able to discriminate between dengue-infected and uninfected cells. Against Junin virus, the cultures visually exhibited about 50% viral CPE. Thus, 50% dye uptake in those cells relative to uninfected cells was the expected result. Actual dye uptake was as follows: 51, 72, 34, 57, and 53%, for alamarBlue absorbance, alamarBlue fluorescence, neutral red, Viral ToxGlo, and WST-1, respectively. Neutral red provided the best range of readings between Junin-infected and uninfected cultures.
Figure 1.
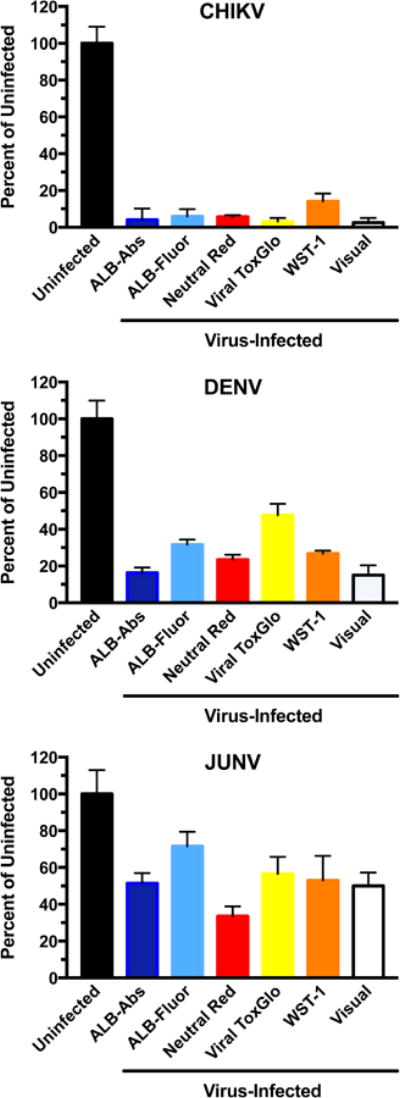
Uptake of dyes in infected compared to uninfected cells, using three RNA viruses with different cytopathogenic potentials ranging from 50% to 100% CPE (as determined visually): Chikungunya (CHIKV), dengue type 2 (DENV), and Junin (JUNV) viruses. Abbreviations: ALB-Abs (alamarBlue absorbance); ALB-Fluor (alamarBlue fluorescence). Bars represent mean values ± SD (N = ≥4 independent determinations).
3.4. Ability of dyes to assess viability of uninfected proliferating cells in cytotoxicity (CC50) assays
Four compounds (6-azauridine, 3-deazaguanine, EICAR, and mycophenolic acid) that inhibited all three viruses were selected for cytotoxicity assays. These compounds are not particularly toxic in confluent monolayers (see Table 1), but inhibit cell proliferation (Allen et al., 1977; Balzarini et al., 1998; Crance et al., 2003; Stet et al., 1994). In these assays the cultures received treatment when started as sub-confluent monolayers. The dyes were used in sequence in the same set of microplates in order to minimize plate-to-plate variability. After four days in culture, the compound-treated cells appeared fewer in number or were morphologically altered compared to untreated monolayers at concentrations as low as 0.1 μM (mycophenolic acid) or 1 μM (6-azauridine, 3-deazaguanine, and EICAR). Table 3 shows CC50 values obtained using the various dyes. Significantly higher CC50 values (i.e., less apparent toxicity) for 6-azauridine were evident using alamarBlue absorbance and fluorescence compared to neutral red, Viral ToxGlo, and WST-1. The alamarBlue fluorescence gave higher CC50 values for 3-deazaguanine and mycophenolic acid than alamarBlue absorbance, neutral red, Viral ToxGlo, and WST-1. The CC50 values generated for EICAR were similar among the dyes used. These data demonstrate that alamarBlue was less effective than other dye methods in detecting the cytotoxicity of three of the compounds.
Table 3.
Toxicities of four compounds in proliferating, uninfected cells treated with three dyes in sequence in the same microplates.
| Plates 1-3, Dye sequence: WST-1, ALBa-Fluor, ALBa-Abs, Neutral Red | ||||
|---|---|---|---|---|
| Dye | 6-AzaUrd | 3-DzGua | EICAR | MPA |
| WST-1 | 7.1 ± 1.8b | 3.4 ± 1.4 | 3.9 ± 1.3 | 0.7 + 0.2 |
| ALB-Fluor | 94.0 ± 10.4 *,φ | 77.3 ± 39.3 *,φ | 8.2 ± 2.2 | 2.5 ± 0.5* |
| ALB-Abs | 48.0 ± 19.9* | 6.5 ± 1.9 | 3.9 ± 1.3 | 1.2 ± 0.2 |
| Neutral Red | 6.2 ± 0.9 | 3.0 ± 1.1 | 2.9 ± 1.0 | 0.8 ± 0.6 |
| Plates 4-6, Dye sequence: WST-1, ALB-Fluor, ALB-Abs, Viral ToxGlo | ||||
| Dye | 6-AzaUrd | 3-DzGua | EICAR | MPA |
| WST-1 | 6.2 ± 1.0 | 3.0 ± 1.2 | 2.8 ± 1.1 | 0.5 ± 0.1 |
| ALB-Fluor | 69.0 ± 10.5* | 90.3 ± 16.7 *,φ | 9.5 ± 4.2 | 1.9 ± 0.1* |
| ALB-Abs | 48.0 ± 11.5* | 7.0 ± 0.7 | 4.9 ± 1.4 | 1.4 ± 0.3 |
| Viral ToxGlo | 17.0 ± 5.3 | 1.5 ± 0.7 | 2.7 ± 1.4 | 0.7 ± 0.2 |
AlamarBlue, measured by fluorescence (Fluor) or absorbance (Abs).
Mean 50% cytotoxic concentration ± SD (μM) (N = 3 independent determinations).
P<0.01 compared to WST-1, neutral red, and Viral ToxGlo results.
P<0.01 compared to ALB-Abs results.
Dose-responsive toxicity results for 6-azauridine (expanded from Table 3) are shown graphically in Figure 2. Three plates of cells, each treated with three dyes, were used for Figures 2A and three plates was used for Figure 2B. By doing this, plate-to-plate variability minimized. Figure 2A shows that neutral red and WST-1 performed nearly the same at each concentration. The alamarBlue absorbance and fluorescence were similar but showed some divergence at higher concentrations. Figure 2B compares Viral ToxGlo to alamarBlue and WST-1. The alamarBlue absorbance and fluorescence data quantified the highest CC50 values. Viral ToxGlo produced intermediate results compared to alamarBlue and WST-1.
Figure 2.
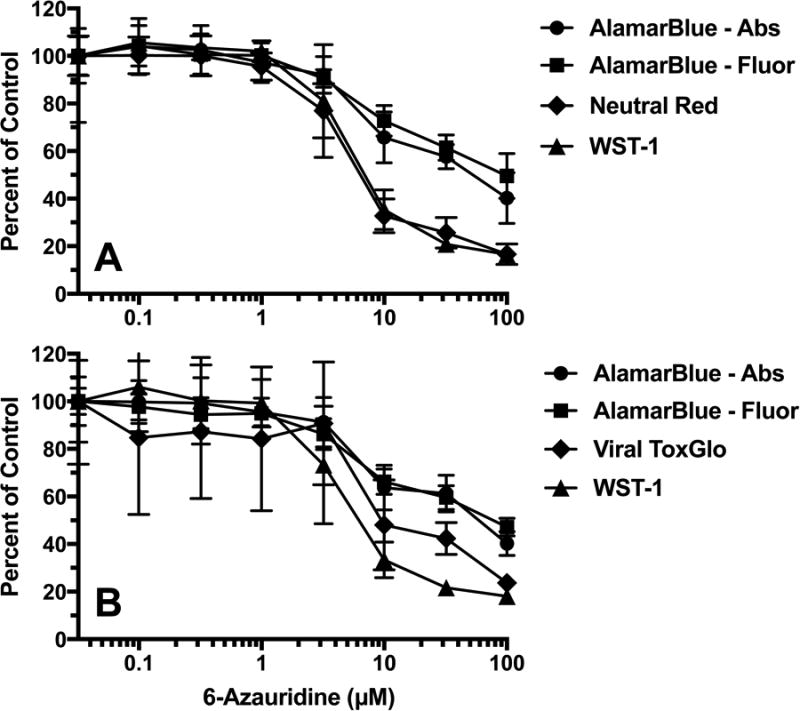
Dose-responsive toxicity of 6-azauridine in Vero 76 cells treated in sequence with dyes. Three dyes were used in the same plate, using three plates of cells per data set. Values represent mean ± SD at each concentration (N = 3 independent determinations), and were used to calculate EC50 values reported in Table 3. Figure 2A dye sequence: WST-1 followed by alamarBlue (fluorescence then absorbance) followed by Neutral Red. Figure 2B dye sequence: WST-1 followed by alamarBlue (fluorescence then absorbance) followed by Viral ToxGlo.
4. Discussion
In this report we investigated four dyes for their ability to assess antiviral activities of compounds against three unrelated RNA viruses. Many of the compounds have been evaluated previously for inhibition of the viruses. 6-Azauridine was reported previously to inhibit chikungunya and dengue type 2 viruses (Briolant et al., 2004; Crance et al., 2003). BCX4430 was reported to inhibit dengue type 2 virus and the Romero strain of Junin virus (Warren et al., 2014). Previously, EICAR was identified as an inhibitor of Junin virus replication (De Clercq et al., 1991), and an inhibitor (in its 5′-triphosphate form) of the dengue virus 2′-O-methyltransferase (Benarroch et al., 2004), as was ribavirin-5′-triphosphate in the same report. Favipiravir and ribavirin have both been evaluated previously at our university against Junin virus (Gowen et al., 2007), and the EC50 values were very similar to those reported here. Interferons (e.g., infergen), inhibit chikungunya and dengue viruses (Briolant et al., 2004; Crance et al., 2003). Our group previously reported the lack of antiviral activity of infergen against three New World arenaviruses (Amapari, Latino, and Tamiami) (Gowen et al., 2005), but Junin virus was not evaluated in that study. Mycophenolic acid is known to inhibit chikungunya (Khan et al., 2011), dengue (Takhampunya et al., 2006), and Junin (Sepulveda et al., 2012) viruses. The fact that ribavirin inhibits Junin virus and tiazofurin does not (as reported here), yet both compounds are inhibitors of cellular inosine monophosphate dehydrogenase (Hedstrom and Wang, 1990; Streeter et al., 1973), indicates that ribavirin's anti-Junin virus activity has a virus-specific component. This conclusion is supported by other published work (Sepulveda et al., 2012).
Previous studies have reported using some of these or related indicator dyes with highly lytic viruses (Maddry et al., 2011; Smee et al., 2002; Yamamoto et al., 2002). Against influenza, each type of indicator dye performed similarly to others in distinguishing between viable versus lysed cells. In the present studies the dyes did not all perform the same, and the dyes varied in their ability to differentiate infected cells (as judged visually) from uninfected cells. For example, with dengue infection, where viral CPE was judged visually to be about 80-90% (i.e., 10-20% cell viability), the best performer (alamarBlue absorbance) quantified cell viability at 16%, whereas the worst performer (Viral ToxGlo) determined cell viability to be 47% (Figure 1). Thus, Viral ToxGlo was activated by infected cells that appear dead by other methods. Overall, the dyes performed adequately for EC50 determinations against each virus (Table 2), primarily because the Excel formulas adjusted for virus control wells exhibiting less than complete CPE compared to untreated wells. However, it is better to have a wider spread of readings between infected and uninfected cells for more accurate calculations.
There were larger differences between alamarBlue and the other dyes in cytotoxicity assays performed in uninfected cells when determining the CC50 values of 6-azauridine, and to a lesser extent, 3-deazaguanine and mycophenolic acid (Table 3). This is also clearly visualized in Figure 2 where 6-azauridine appeared to be less cytotoxic using alamarBlue versus the other dyes using the identical plates of cells. Because neutral red, Viral ToxGlo, and WST-1 performed similarly to give low CC50 values, as well as did other dyes reported previously (Smee et al., 2002), we conclude that alamarBlue results underestimate the toxicity of certain compounds. Interestingly and unexplainably, CC50 results for 3-deazaguanine generated using alamarBlue fluorescence differed markedly from those of alamarBlue read by absorbance. 3-Deazaguanine and the other three compounds were tested for auto-fluorescence that might explain this result, but no autofluorescence was observed.
Recently, investigators evaluated inhibitors of dengue virus, with antiviral activity determined by plaque reduction assay and cytotoxicity determined by alamarBlue uptake (Chu et al., 2015). A high throughput screen was developed for chikungunya virus inhibitors based upon alamarBlue uptake into infected cells (Cruz et al., 2013). Results here demonstrate that the dye is appropriate for antiviral assays using these viruses but may underestimate the toxicity of the compounds being evaluated.
The commonly used and inexpensive neutral red dye proved to perform very well in distinguishing infected and uninfected cells for EC50 and CC50 determinations. The one drawback to the neutral red assay is that it is more tedious to perform than the other assays, since it requires dye extraction following treatment. The other assays required only application of the dye and reading of the plates after incubation. Viral ToxGlo did not distinguish dengue-infected cells well compared to uninfected cells (Figure 2), and its dat were more variable, resulting in larger standard deviation values than obtained with the other assays (e.g., see Figure 2B).
Other practical observations were learned while performing the assays. We explored whether rinsing the cells prior to adding the dyes would improve the differences between infected versus uninfected cultures. The rationale was that dead cells or cell debris might be removed by rinsing, which would reduce dye uptake in the infected cells. We found similar dye uptake in un-rinsed versus rinsed cell cultures. Thus, no rinsing of the cells was performed before adding dye. We examined (late in the research) the use of clear versus opaque microplates (which are more expensive) for alamarBlue fluorescence and Viral ToxGlo luminescence measurements. The fluorescence signal did not transfer from wells containing dye to wells devoid of dye, but the luminescence signal did. The transferred luminescent signal was about 5% to the adjacent well, which would be sufficient to alter EC50 and CC50 calculations. Thus, opaque plates were essential for luminescence using Viral ToxGlo but not for fluorescence using alamarBlue. AlamarBlue read by fluorescence requires less incubation time than for absorbance reading (2 versus 4 h), and the readout achieved was a higher signal (e.g., 30,040 average fluorescing units versus 0.622 average optical density units in uninfected, untreated cultures observed in the study reported in Table 3). However, since both methods can be performed in the same plates, and different results might be generated between these assays (e.g., the 3-deazaguanine toxicity results in Table 3), it is prudent to perform both readouts for comparative purposes. Neutral red makes cells fragile and they can slough off the plates with rinsing, especially the infected cells. Thus, rinsing (with PBS) after dye removal and before extraction of the dye was avoided. Complete aspiration of the neutral red-containing medium from cells leaves a low background, and it was subtracted out from the counts by using background control wells. Finally, by preliminarily determining the amount of dye required for each assay, we were able to use less quantity of dye per well than what the manufacturers' instructions recommend and still have an adequate signal. This greatly reduced assay costs of the more expensive dyes.
For compounds exhibiting high antiviral activity that are of interest for further development, it is prudent to evaluate compounds for toxicity by a variety of methods, in stationary cell monolayers and in proliferating sub-confluent cultures. This can be done using indicator dyes, or simply (but tediously) by counting live versus dead cells by dye exclusion methods (e.g., using trypan blue that stains dead cells). When indicator dyes are used, the choice of dye may impact the achieved EC50 and CC50 values, which affect selectivity indexes (CC50/EC50). Ultimately the compounds need to be evaluated in live animal infection models, when available, to determine their potential for further drug development.
Highlights.
Nine inhibitors were evaluated for antiviral activity against Chikungunya, dengue and Junin viruses using different dye indicators.
AlamarBlue (absorbance and fluorescence) neutral red, Viral ToxGlo and WST-1 dyes performed similarly in quantifying antiviral effects.
Alamar Blue underestimated the toxicity of some of the test compounds on cell viability compared to the other dyes.
Viral ToxGlo was taken into dengue-infected cells at nearly twice the extent as the other dyes, and the data were more variable.
Certain dyes could be used sequentially in the same cell cultures.
Acknowledgments
This work was supported by contract number HHSN272201100019I from the Virology Branch, NIAID, DMID, NIH. The opinions expressed herein are those of the authors and not of the U.S. Government.
Footnotes
Publisher's Disclaimer: This is a PDF file of an unedited manuscript that has been accepted for publication. As a service to our customers we are providing this early version of the manuscript. The manuscript will undergo copyediting, typesetting, and review of the resulting proof before it is published in its final citable form. Please note that during the production process errors may be discovered which could affect the content, and all legal disclaimers that apply to the journal pertain.
References
- Ahmed SA, Gogal RM, Jr, Walsh JE. A new rapid and simple non-radioactive assay to monitor and determine the proliferation of lymphocytes: an alternative to [3H]thymidine incorporation assay. J Immunol Methods. 1994;170:211–224. doi: 10.1016/0022-1759(94)90396-4. [DOI] [PubMed] [Google Scholar]
- Allen LB, Huffman JH, Dan Cook P, Meyer RB, Jr, Robins RK, Sidwell RW. Antiviral activity of 3-deazaguanine, 3-deazaguanosine, and 3-deazaguanylic acid. Antimicrob Agents Chemother. 1977;12:114–119. doi: 10.1128/aac.12.1.114. [DOI] [PMC free article] [PubMed] [Google Scholar]
- Baker RO, Bray M, Huggins JW. Potential antiviral therapeutics for smallpox, monkeypox and other orthopoxvirus infections. Antiviral Res. 2003;57:13–23. doi: 10.1016/S0166-3542(02)00196-1. [DOI] [PMC free article] [PubMed] [Google Scholar]
- Balzarini J, Stet L, Matsuda A, Wiebe L, Knauss E, De Clercq E. Metabolism of EICAR (5-ethynyl-1-beta-D-ribofuranosylimidazole-4-carboxamide), a potent inhibitor of inosinate dehydrogenase. Adv Exp Med Biol. 1998;431:723–728. doi: 10.1007/978-1-4615-5381-6_139. [DOI] [PubMed] [Google Scholar]
- Benarroch D, Egloff MP, Mulard L, Guerreiro C, Romette JL, Canard B. A structural basis for the inhibition of the NS5 dengue virus mRNA 2′-O-methyltransferase domain by ribavirin 5′-triphosphate. J Biol Chem. 2004;279:35638–35643. doi: 10.1074/jbc.M400460200. [DOI] [PubMed] [Google Scholar]
- Berridge MV, Tan AS, McCoy KD, Wang R. The biochemical and cellular basis of cell proliferation assays that use tetrazolium salts. Biochemica. 1996;4(1996):14–19. [Google Scholar]
- Borenfreund E, Babich H, Martin-Alguacil N. Comparisons of two in vitro cytotoxicity assays-The neutral red (NR) and tetrazolium MTT tests. Toxicol In Vitro. 1988;2:1–6. doi: 10.1016/0887-2333(88)90030-6. [DOI] [PubMed] [Google Scholar]
- Briolant S, Garin D, Scaramozzino N, Jouan A, Crance JM. In vitro inhibition of Chikungunya and Semliki Forest viruses replication by antiviral compounds: synergistic effect of interferon-alpha and ribavirin combination. Antiviral Res. 2004;61:111–117. doi: 10.1016/j.antiviral.2003.09.005. [DOI] [PubMed] [Google Scholar]
- Chu JJ, Lee RC, Ang MJ, Wang WL, Lim HA, Wee JL, Joy J, Hill J, Brian Chia CS. Antiviral activities of 15 dengue NS2B-NS3 protease inhibitors using a human cell-based viral quantification assay. Antiviral Res. 2015;118:68–74. doi: 10.1016/j.antiviral.2015.03.010. [DOI] [PubMed] [Google Scholar]
- Clarysse C, Fevery J, Yap SH. In vitro assays for drug testing: continuous cell lines. Acta Gastroenterol Belg. 2000;63:213–215. [PubMed] [Google Scholar]
- Cline JC, Nelson JD, Gerzon K, Williams RH, Delong DC. In vitro antiviral activity of mycophenolic acid and its reversal by guanine-type compounds. Appl Microbiol. 1969;18:14–20. doi: 10.1128/am.18.1.14-20.1969. [DOI] [PMC free article] [PubMed] [Google Scholar]
- Crance JM, Scaramozzino N, Jouan A, Garin D. Interferon, ribavirin, 6-azauridine and glycyrrhizin: antiviral compounds active against pathogenic flaviviruses. Antiviral Res. 2003;58:73–79. doi: 10.1016/s0166-3542(02)00185-7. [DOI] [PubMed] [Google Scholar]
- Cruz DJ, Bonotto RM, Gomes RG, da Silva CT, Taniguchi JB, No JH, Lombardot B, Schwartz O, Hansen MA, Freitas-Junior LH. Identification of novel compounds inhibiting chikungunya virus-induced cell death by high throughput screening of a kinase inhibitor library. PLoS Negl Trop Dis. 2013;7:e2471. doi: 10.1371/journal.pntd.0002471. [DOI] [PMC free article] [PubMed] [Google Scholar]
- De Clercq E. Curious (old and new) antiviral nucleoside analogues with intriguing therapeutic potential. Curr Med Chem. 2015;22:3866–3880. doi: 10.2174/0929867322666150625094705. [DOI] [PubMed] [Google Scholar]
- De Clercq E, Cools M, Balzarini J, Snoeck R, Andrei G, Hosoya M, Shigeta S, Ueda T, Minakawa N, Matsuda A. Antiviral activities of 5-ethynyl-1-β-D-ribofuranosylimidazole-4- carboxamide and related compounds. Antimicrob Agents Chemother. 1991;35:679–684. doi: 10.1128/aac.35.4.679. [DOI] [PMC free article] [PubMed] [Google Scholar]
- Finter NB. Dye uptake methods for assessing viral cytopathogenicity and their application to interferon assays. J Gen Virol. 1969;5:4519–4427. [Google Scholar]
- Flint M, McMullan LK, Dodd KA, Bird BH, Khristova ML, Nichol ST, Spiropoulou CF. Inhibitors of the tick-borne, hemorrhagic fever-associated flaviviruses. Antimicrob Agents Chemother. 2014;58:3206–3216. doi: 10.1128/AAC.02393-14. [DOI] [PMC free article] [PubMed] [Google Scholar]
- Furuta Y, Gowen BB, Takahashi K, Shiraki K, Smee DF, Barnard DL. Favipiravir (T-705), a novel viral RNA polymerase inhibitor. Antiviral Res. 2013;100:446–454. doi: 10.1016/j.antiviral.2013.09.015. [DOI] [PMC free article] [PubMed] [Google Scholar]
- Gowen BB, Barnard DL, Smee DF, Wong MH, Pace AM, Jung KH, Winslow SG, Bailey KW, Blatt LM, Sidwell RW. Interferon alfacon-1 protects hamsters from lethal pichinde virus infection. Antimicrob Agents Chemother. 2005;49:2378–2386. doi: 10.1128/AAC.49.6.2378-2386.2005. [DOI] [PMC free article] [PubMed] [Google Scholar]
- Gowen BB, Wong MH, Jung KH, Sanders AB, Mendenhall M, Bailey KW, Furuta Y, Sidwell RW. In vitro and in vivo activities of T-705 against arenavirus and bunyavirus infections. Antimicrob Agents Chemother. 2007;51:3168–3176. doi: 10.1128/AAC.00356-07. [DOI] [PMC free article] [PubMed] [Google Scholar]
- Hedstrom L, Wang CC. Mycophenolic acid and thiazole adenine dinucleotide inhibition of Tritrichomonas foetus inosine 5′-monophosphate dehydrogenase: implications on enzyme mechanism. Biochemistry. 1990;29:849–854. doi: 10.1021/bi00456a001. [DOI] [PubMed] [Google Scholar]
- Hu JM, Hsiung GD. Evaluation of new antiviral agents: I. In vitro perspectives. Antiviral Res. 1989;11:217–232. doi: 10.1016/0166-3542(89)90032-6. [DOI] [PubMed] [Google Scholar]
- Huggins JW, Robins RK, Canonico PG. Synergistic antiviral effects of ribavirin and the C-nucleoside analogs tiazofurin and selenazofurin against togaviruses, bunyaviruses, and arenaviruses. Antimicrob Agents Chemother. 1984;26:476–480. doi: 10.1128/aac.26.4.476. [DOI] [PMC free article] [PubMed] [Google Scholar]
- Ishiyama M, Tominaga H, Shiga M, Sasamoto K, Ohkura Y, Ueno K. A combined assay of cell viability and in vitro cytotoxicity with a highly water-soluble tetrazolium salt, neutral red and crystal violet. Biol Pharm Bull. 1996;19:1518–1520. doi: 10.1248/bpb.19.1518. [DOI] [PubMed] [Google Scholar]
- Julander JG, Bantia S, Taubenheim BR, Minning DM, Kotian P, Morrey JD, Smee DF, Sheridan WP, Babu YS. BCX4430, a novel nucleoside analog, effectively treats yellow fever in a Hamster model. Antimicrob Agents Chemother. 2014;58:6607–6614. doi: 10.1128/AAC.03368-14. [DOI] [PMC free article] [PubMed] [Google Scholar]
- Julander JG, Morrey JD, Blatt LM, Shafer K, Sidwell RW. Comparison of the inhibitory effects of interferon alfacon-1 and ribavirin on yellow fever virus infection in a hamster model. Antiviral Res. 2007;73:140–146. doi: 10.1016/j.antiviral.2006.08.008. [DOI] [PMC free article] [PubMed] [Google Scholar]
- Khan M, Dhanwani R, Patro IK, Rao PV, Parida MM. Cellular IMPDH enzyme activity is a potential target for the inhibition of Chikungunya virus replication and virus induced apoptosis in cultured mammalian cells. Antiviral Res. 2011;89:1–8. doi: 10.1016/j.antiviral.2010.10.009. [DOI] [PubMed] [Google Scholar]
- Maddry JA, Chen X, Jonsson CB, Ananthan S, Hobrath J, Smee DF, Noah JW, Noah D, Xu X, Jia F, Maddox C, Sosa MI, White EL, Severson WE. Discovery of novel benzoquinazolinones and thiazoloimidazoles, inhibitors of influenza H5N1 and H1N1 viruses, from a cell-based high-throughput screen. J Biomol Screen. 2011;16:73–81. doi: 10.1177/1087057110384613. [DOI] [PMC free article] [PubMed] [Google Scholar]
- Mendenhall M, Russell A, Juelich T, Messina EL, Smee DF, Freiberg AN, Holbrook MR, Furuta Y, de la Torre JC, Nunberg JH, Gowen BB. T-705 (favipiravir) inhibition of arenavirus replication in cell culture. Antimicrob Agents Chemother. 2011;55:782–787. doi: 10.1128/AAC.01219-10. [DOI] [PMC free article] [PubMed] [Google Scholar]
- Morrey JD, Day CW, Julander JG, Blatt LM, Smee DF, Sidwell RW. Effect of interferon-alpha and interferon-inducers on West Nile virus in mouse and hamster animal models. Antivir Chem Chemother. 2004;15:101–109. doi: 10.1177/095632020401500202. [DOI] [PubMed] [Google Scholar]
- Mosmann T. Rapid colorimetric assay for cellular growth and survival: application to proliferation and cytotoxicity assays. J Immunol Methods. 1983;65:55–63. doi: 10.1016/0022-1759(83)90303-4. [DOI] [PubMed] [Google Scholar]
- Muller WE, Maidhof A, Taschner H, Zahn RK. Virazole (1-beta-D-ribofuranosyl-1,2,4-triazole-3-carboxamide; a cytostatic agent. Biochem Pharmacol. 1977;26:1071–1075. doi: 10.1016/0006-2952(77)90246-5. [DOI] [PubMed] [Google Scholar]
- Rada B, Dragun M. Antiviral action and selectivity of 6-azauridine. Ann N Y Acad Sci. 1977;284:410–417. doi: 10.1111/j.1749-6632.1977.tb21977.x. [DOI] [PubMed] [Google Scholar]
- Sepulveda CS, Garcia CC, Fascio ML, D'Accorso NB, Docampo Palacios ML, Pellon RF, Damonte EB. Inhibition of Junin virus RNA synthesis by an antiviral acridone derivative. Antiviral Res. 2012;93:16–22. doi: 10.1016/j.antiviral.2011.10.007. [DOI] [PubMed] [Google Scholar]
- Sidwell RW, Huffman JH, Khare GP, Allen LB, Witkowski JT, Robins RK. Broad-spectrum antiviral activity of Virazole: 1-β-D-ribofuranosyl-1,2,4-triazole-3-carboxamide. Science. 1972;177:705–706. doi: 10.1126/science.177.4050.705. [DOI] [PubMed] [Google Scholar]
- Sidwell RW, Smee DF. In vitro and in vivo assay systems for study of influenza virus inhibitors. Antiviral Res. 2000;48:1–16. doi: 10.1016/s0166-3542(00)00125-x. [DOI] [PubMed] [Google Scholar]
- Smee DF, Evans WJ, Nicolaou KC, Tarbet EB, Day CW. Susceptibilities of enterovirus D68, enterovirus 71, and rhinovirus 87 strains to various antiviral compounds. Antiviral Res. 2016 doi: 10.1016/j.antiviral.2016.04.003. Epub ahead of print. [DOI] [PMC free article] [PubMed] [Google Scholar]
- Smee DF, McKernan PA, Nord LD, Willis RC, Petrie CR, Riley TM, Revankar GR, Robins RK, Smith RA. Novel pyrazolo[3,4-d]pyrimidine nucleoside analog with broad-spectrum antiviral activity. Antimicrob Agents Chemother. 1987;31:1535–1541. doi: 10.1128/aac.31.10.1535. [DOI] [PMC free article] [PubMed] [Google Scholar]
- Smee DF, Morrison AC, Barnard DL, Sidwell RW. Comparison of colorimetric, fluorometric, and visual methods for determining anti-influenza (H1N1 and H3N2) virus activities and toxicities of compounds. J Virol Methods. 2002;106:71–79. doi: 10.1016/s0166-0934(02)00137-4. [DOI] [PubMed] [Google Scholar]
- Stet EH, De Abreu RA, Bokkerink JP, Lambooy LH, Vogels-Mentink TM, Keizer-Garritsen JJ, Trijbels FJ. Inhibition of IMP dehydrogenase by mycophenolic acid in Molt F4 human malignant lymphoblasts. Ann Clin Biochem. 1994;31(Pt 2):174–180. doi: 10.1177/000456329403100211. [DOI] [PubMed] [Google Scholar]
- Streeter DG, Witkowski JT, Khare GP, Sidwell RW, Bauer RJ, Robins RK, Simon LN. Mechanism of action of 1-β-D-ribofuranosyl-1,2,4-triazole-3-carboxamide (Virazole), a new broad-spectrum antiviral agent. Proc Natl Acad Sci U S A. 1973;70:1174–1178. doi: 10.1073/pnas.70.4.1174. [DOI] [PMC free article] [PubMed] [Google Scholar]
- Takhampunya R, Ubol S, Houng HS, Cameron CE, Padmanabhan R. Inhibition of dengue virus replication by mycophenolic acid and ribavirin. J Gen Virol. 2006;87:1947–1952. doi: 10.1099/vir.0.81655-0. [DOI] [PubMed] [Google Scholar]
- Taylor R, Kotian P, Warren T, Panchal R, Bavari S, Julander J, Dobo S, Rose A, El-Kattan Y, Taubenheim B, Babu Y, Sheridan WP. BCX4430 - A broad-spectrum antiviral adenosine nucleoside analog under development for the treatment of Ebola virus disease. J Infect Public Health. 2016;9:220–226. doi: 10.1016/j.jiph.2016.04.002. [DOI] [PMC free article] [PubMed] [Google Scholar]
- To KK, Mok KY, Chan AS, Cheung NN, Wang P, Lui YM, Chan JF, Chen H, Chan KH, Kao RY, Yuen KY. Mycophenolic acid, an immunomodulator, has potent and broad-spectrum in vitro antiviral activity against pandemic, seasonal and avian influenza viruses affecting humans. J Gen Virol. 2016;97:1807–1817. doi: 10.1099/jgv.0.000512. [DOI] [PubMed] [Google Scholar]
- Warren TK, Wells J, Panchal RG, Stuthman KS, Garza NL, Van Tongeren SA, Dong L, Retterer CJ, Eaton BP, Pegoraro G, Honnold S, Bantia S, Kotian P, Chen X, Taubenheim BR, Welch LS, Minning DM, Babu YS, Sheridan WP, Bavari S. Protection against filovirus diseases by a novel broad-spectrum nucleoside analogue BCX4430. Nature. 2014;508:402–405. doi: 10.1038/nature13027. [DOI] [PMC free article] [PubMed] [Google Scholar]
- Westover JB, Sefing EJ, Bailey KW, Van Wettere AJ, Jung KH, Dagley A, Wandersee L, Downs B, Smee DF, Furuta Y, Bray M, Gowen BB. Low-dose ribavirin potentiates the antiviral activity of favipiravir against hemorrhagic fever viruses. Antiviral Res. 2016;126:62–68. doi: 10.1016/j.antiviral.2015.12.006. [DOI] [PMC free article] [PubMed] [Google Scholar]
- Yamamoto T, Jeevan A, Ohishi K, Nojima Y, Umemori K, Yamamoto S, McMurray DN. A new assay system for guinea pig interferon biological activity. J Interferon Cytokine Res. 2002;22:793–797. doi: 10.1089/107999002320271387. [DOI] [PubMed] [Google Scholar]