Abstract
Background
C-peptide blood levels can indicate whether or not a person is producing insulin and roughly how much. C-peptide is secreted as a byproduct of the biosynthesis of insulin from proinsulin. C-peptide has proposed biological activity and a well-established diagnostic value. The significance of C-peptide concentration in the plasma and urine in the pediatric population needs further delineation.
Aim
To determine the significance of plasma C-peptide in obese African American adolescents with mild insulin resistance but no evidence of diabetes.
Methods
This study included 19 African American adolescents with body mass index (BMI) in at least the 85th percentile evaluated with anthropometric measurements, Homeostatic Model Assessment–Insulin Resistance (HOMA-IR) score, and oral glucose tolerance test (OGTT), and 24-hour urine collections. The study also included an age-matched control group of 15 healthy African American adolescent controls and were not subjected for OGTT. The correlation among BMI, fasting plasma C-peptide concentrations, and 24-hour–urine C-peptide concentrations was calculated. t Tests were conducted to compare plasma C-peptide and 24-hour–urine C-peptide concentrations for the test group and controls.
Results
Mean HOMA score (3.96 ± 1.84) signified mild insulin resistance among the adolescent test group. The test subjects exhibited adequate glucose tolerance (glucose range, 89.4–122.5 mg/dL) during the OGTT. A significant positive relationship was observed between BMI and fasting plasma C-peptide concentration in the control group (r = 0.537) but not the test group (r = 0.335). An insignificant positive relationship was exhibited between BMI and 24-hour–urine C-peptide concentration in the test group (r = 0.150) and controls (r = 0.254).
Conclusions
The positive relationship among BMI, plasma C-peptide, and urine C-peptide is worth further evaluation in studies conducting multiple rounds of OGTT with a larger sample of pediatric subjects. The potential diagnostic value of C-peptide may facilitate early detection of insulin resistance in the pediatric population.
Keywords: insulin, African Americans, children/adolescents, obesity
INTRODUCTION
C-peptide and insulin are initially synthesized in the form of proinsulin within the pancreatic β cell. In its original form, the α and β insulin chains are linked by connecting peptide known as C-peptide. Disulfide bonds subsequently form between the 2 insulin chains, and proinsulin is cleaved into its end products. Human C-peptide is comprised of a single chain of 31 amino acid residues and consists of defined local confirmations such as an α helix, β-turns, β-bends, and is proposed to have an active site near its carboxy-terminal.1 One molecule of insulin is produced with 1 C-peptide, which causes C-peptide to serve as an accurate indicator of insulin production.
It has long been known that C-peptide levels in the blood and urine provide an accurate estimate of insulin secretion rates.2 C-peptide has been shown to have a longer half-life than insulin and remains unaltered as it undergoes renal excretion. Thus, C-peptide in the urine is often evaluated as a long-term indicator of insulin production.2–4
Insulin has multiple physiological effects and is responsible for greater than 90% of the biological activity of proinsulin, while C-peptide has long been considered to be biologically inert. However, recent studies have indicated that C-peptide may have biological functions.4–8 For instance, Marques et al asserted that C-peptide signal transduction pathways stimulate Na+/K+ ATPase pumps and induce nitric oxide synthase.4
During the past 20 years, much research has been devoted to elucidating the medical importance of C-peptide. The association between C-peptide levels with diabetes severity, obesity, gallbladder disease, nonalcoholic steatohepatitis, polycystic ovarian syndrome, and colorectal tumors has been hypothesized in previous studies.9–15
As the clinical value of C-peptide has become increasingly apparent, researchers have attempted to improve the accuracy of its detection by investigating the metabolism and kinetics of C-peptide. Researchers have established that the distribution and kinetic parameters of C-peptide are very similar in normal, obese, and diabetic subjects.16,17
The vast majority of current research and each of the aforementioned studies contain solely adult subjects. This current study was devoted to determining the significance of plasma C-peptide in obese African American adolescents with mild insulin resistance but no evidence of diabetes.
PATIENTS AND METHODS
The study population included a total of 19 African American adolescents between the ages of 10 and 20 years who had a body mass index (BMI) greater than or equal to the 85th percentile and a control population of 15 African American adolescents within the same age range with a BMI of less than 85th percentile. All subjects had a family history of type 2 diabetes in either a parent or grandparent. The subjects were healthy. The Howard University institutional review board approved the study. The subjects gave assent if under the age of 18 years, and subjects 18 years or older and guardians gave written informed consent. Study participants were excluded if they were pregnant or there was a known history of diabetes, heart, renal, liver, and thyroid disease. Also, subjects were not on medication known to influence insulin, lipid, and glucose metabolism. The study and control subjects had not indulged in competitive sports.
Nutritional and Body Composition Measurements
The studies and interaction with the study participants occurred at the General Clinical Research Centers at Howard University Hospital during 2 separate outpatient visits. Nutritional assessments and anthropometric measurements were completed during the first visit. The anthropometric measurements included waist, abdomen, and hip circumference measurements with measuring tape. While in the supine position, hip circumference was measured at the level of the pubic symphysis, and the waist circumference was measured at the level of the umbilicus. The BMI [weight (kilograms)/height (meters squared)] was calculated and BMI percentile determined utilizing the Centers for Disease Control BMI table for ages 2 to 10 years. Percent body fat was determined using the Tanita TBF-300 scale (TANITA American, Arlington Heights, Illinois). This scale measured weights up to 182 kg and uses the foot-to-foot bioimpedance analyzer technology to determine fat mass, fat free mass, fat percentage, and total body water. The computer processor imbedded in the scale determined the percentage of body fat based on age and gender using equations with dual energy x-ray absorptiometry as a reference. Subjects were instructed to empty their bladders 30 minutes before the test and were measured in bare feet. Blood pressure measurements were averaged following 3 separate measurements at least 10 minutes apart. Pubertal development was assessed by physical examination according to the criteria of Tanner.
Blood and Urine Analysis
The second visit occurred within 1 week of the first visit and evaluated metabolic parameters. Intense physical activities were avoided. Fasting blood samples were obtained from each test subject and control to determine fasting plasma glucose, insulin, and C-peptide concentrations. The oral glucose tolerance test (OGTT) was performed on all obese subjects with BMI greater than or equal to the 85th percentile. Only, fasting plasma glucose was obtained from the control group of adolescents because it was hypothesized that impaired glucose tolerance or diabetes would unlikely to be detected in this group. Oral glucose (Glutol, Custom Laboratories, Baltimore, Maryland) was administered in a dose of 1.75 g/kg of body weight to a maximum of 75 g. Blood samples for each subject were drawn at −10 and 0 minutes before glucose was administered. Each subsequent blood sample was drawn at 30, 60, 90, and 120 minutes after glucose consumption was complete. C-peptide, insulin, and glucose levels were measured from the blood samples during each time period. The interpretation of the standard OGTT, a 2-hour plasma glucose of at least 7.8 mmol/L (140 mg/dL), was considered impaired. The fasting plasma glucose of at least 7 mmol/L (126mg/dL) and/or 2-hour postglucose load of at least 11.1 mmol/L (200mg/dL) was considered diabetes. Insulin resistance using the Homeostatic Model Assessment (HOMA) was calculated as (fasting insulin × fasting glucose)/22.5. The HOMA model has been proven as an accurate and noninvasive method by which to detect the presence of insulin resistance in the pediatric population. Twenty-four–hour urine collections were performed for all 19 of the adolescent test subjects (BMI ≥85th percentile) and all 15 controls (BMI <85th percentile). Urine C-peptide was quantified after diluting the urine 100× and is reported in μg/mL.
Biochemical Measurements
Fasting hemoglobin A1C (HbA1c) was determined in the Howard University Hospital core laboratories on the autoanalyzers Beckman LX-20 and Beckman BXC, respectively, whereas C-peptide and insulin were done in the molecular endocrinology laboratory using commercially available radioimmunoassay kits from Millipore (formerly Linco Research Inc, St Charles, Missouri) for C-peptide and insulin. All OGTT samples from obese patients and fasting samples of controls were collected in heparinized vacuutainer tubes and centrifuged (Refrigerated Beckman CPR) at 2000 xg 20 minutes at 4ºC for 20 minutes. All plasma samples were stored at −70ºC until analyzed.
C-peptide and Insulin
C-peptide and insulin were measured by radioimmunoassay protocols provided by the manufacturer. Millipore’s RIA Kit Human C-peptide radioimmunoassay kit utilized 125I-Human C-peptide and Human C-peptide antiserum to determine the level of C-peptide in the plasma by the doubly antibody/polyethylene glycol technique (PEG). The C-peptide controls were prepared using purified human C-peptide. This assay is extremely sensitive, and the lowest value that can be detected by this assay was 0.1 ng/mL.
A similar radioimmunoassay was utilized to detect plasma insulin. The kit contained 125I-labeled human insulin and human insulin antiserum The double-antibody PEG technique, in conjunction with standardized insulin curves, was utilized to accurately quantify the plasma insulin concentrations of the test group and the controls. Acceptance criteria of the runs of data are similar to C-peptide procedure as described above. The limit of sensitivity for the human insulin assay was 2 μU/mL. Limit of linearity for this assay was 200 μU/mL. All samples of the test subjects were diluted 5× in order to have the values within the range of the reference curve. Appropriate mathematical adjustments were made to accommodate the dilution.
Statistical Analysis
The mean and standard deviation were calculated for all the clinical characteristics of the test group and controls presented in Table 1. The data recorded during each time segment of the OGTT (plasma insulin, glucose, C-peptide) with the test group were averaged. The standard deviation and standard error were calculated from this data set. The BMI and fasting plasma C-peptide were plotted, and regression analysis was performed for the data produced by the test group and controls. The same process was conducted for BMI vs 24-hour–urine C-peptide concentrations in both groups. The data were compiled and aforementioned calculations were performed with Excel (Microsoft Corp, Redmond, Washington).
Table 1.
Clinical Characteristics of Adolescent Test Subjects and Controls
| BMI >85th Percentile Adolescent Test Group | BMI <85th Percentile Control Group | |
|---|---|---|
| Age | 12.9 ± 2.6 | 15.3 ± 3.9 |
| Sex | Males, 8; females, 11 | Males, 6; females, 9 |
| Height, cm | 165.5 ± 14.4 | 164.9 ± 12.7 |
| Height percentile | 80.6 ± 19.6 | 73.3 ± 21.9 |
| Weight, kg | 103.7 ± 31.8 | 59.4 ± 12.7 |
| Weight percentile | 99 ± 0.0 | 72.3 ± 15.8 |
| Body mass index, kg/m2 | 37.1 ± 6.7 | 21.3 ± 2.2 |
| Body mass index percentile | 98.8 ± 0.5 | 64.8 ± 19.3 |
| Waist circumference, cm | 279.9± 6.1 | 191.5 ± 15.5 |
| Waist circumference percentile | 99 ± 0.0 | 57.7 ± 13.6 |
| Body fat, % | 43.3 ± 8.1 | 20.8 ± 8.55 |
The Graphpad internet statistical calculator was utilized to perform a 2-tailed t test with the mean fasting plasma C-peptide and 24-hour–urine concentrations from the adolescent test group and controls to determine if the differences between the groups were statistically significant.
RESULTS
Table 1 contains the clinical characteristics of the study subjects. All subjects had a Tanner stage of 2 or greater. The laboratory data acquired from the test group (N = 19) and controls (N = 15) show mean fasting insulin concentrations of 33.0 μU/mL for the test group and 18.7 μU/mL for the controls. The HOMA–Insulin Resistance (HOMA-IR) score for the test group and controls were determined to be 3.96 (±1.84) and 2.34 (±0.95), respectively. Mean HbA1c values were also measured for the test group (5.44) and controls (5.22). P values for the laboratory data categories were < .05, except for HbA1c (p = .33). The mean plasma glucose, insulin, and C-peptide concentrations for the 19 test subjects measured during a glucose tolerance test (OGTT) are presented in Table 2.
Table 2.
Insulin, C-peptide, and Glucose Concentrations (Mean) During OGTT of Adolescent Test Subjects
| Time, min | Insulin, μU/ml | C-peptide, ng/mL | Glucose, mg/dL |
|---|---|---|---|
| −10 | 29.84 | 3.82 | 89.4 |
| 0 | 38.73 | 3.82 | 95.84 |
| 30 | 143.47 | 11.11 | 108.46 |
| 60 | 174.10 | 12.68 | 118.07 |
| 90 | 157.89 | 10.81 | 122.53 |
| 120 | 202.36 | 11.36 | 109.92 |
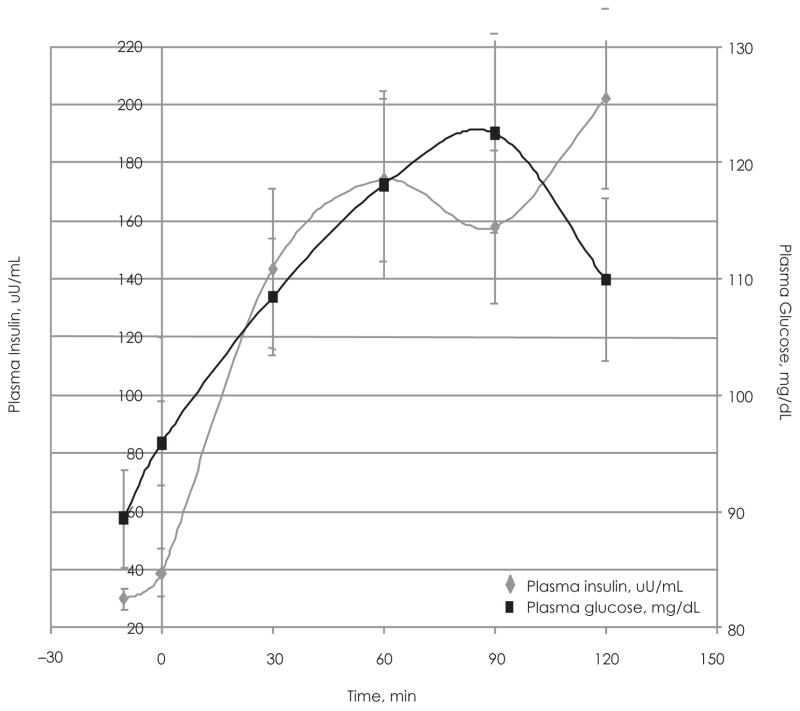
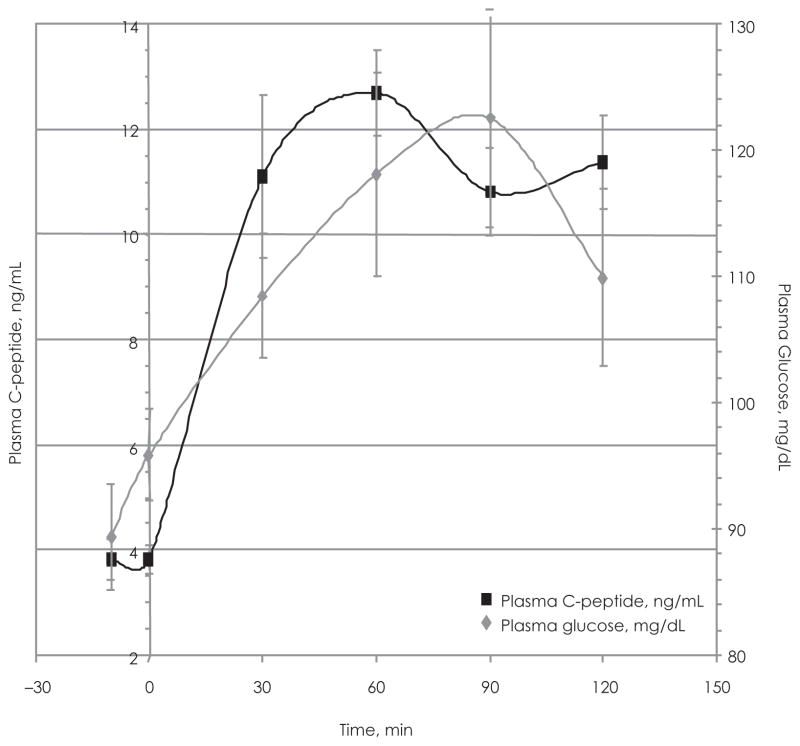
The fluctuations in plasma C-peptide during the OGTT are closely followed by plasma insulin levels (Figure 1). The relationship between insulin and plasma glucose (Figure 2) indicates that the test group maintained adequate glucose tolerance with mean glucose concentrations ranging between 89.4 and 109.92 mg/dL (Table 2). The graph shows that the insulin and glucose peaks occur at 60 and 90 minutes, respectively (Figure 2). The relationship between plasma C-peptide and plasma glucose is very similar to that of insulin and plasma glucose (Figure 3).
Figure 1.
Plasma Insulin vs Plasma C-peptide During the Oral Glucose Tolerance Test (OGTT) in the Adolescent Test Group
Plasma insulin concentration vs time (during OGTT) plotted with the plasma C-peptide concentration vs time for the test group. Determined by RIA using 100 μL of diluted samples.
Figure 2.
Plasma Insulin vs Plasma Glucose During the Oral Glucose Tolerance Test (OGTT) of the Adolescent Test Group (N = 19)
Plasma insulin concentration vs time (during OGTT) plotted along side plasma glucose concentration vs time for the test group. Determined by RIA using 100 μl of diluted samples.
Figure 3.
Plasma C-peptide vs Plasma Glucose During the Oral Glucose Tolerance Test (OGTT) of the Adolescent Test Group (N = 19)
Plasma C-peptide concentration vs time (during OGTT) plotted along side plasma glucose concentration vs time for the test group. Determined by RIA using 100 μl of diluted samples.
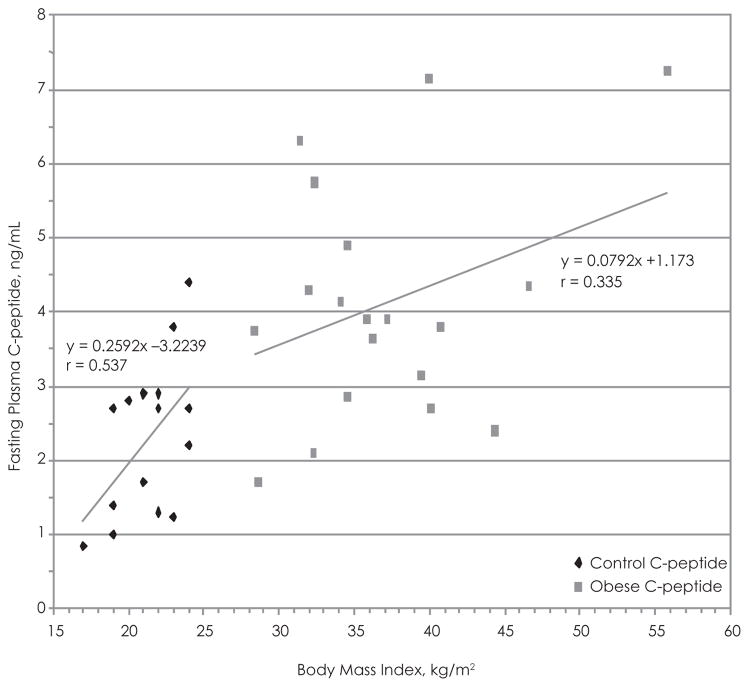
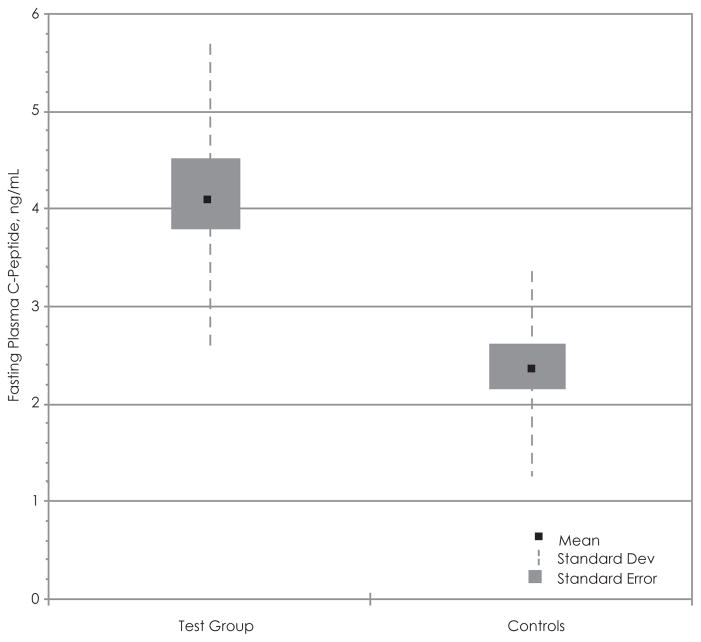
Using the data acquired from the adolescent test subjects and the controls, we attempted to establish if there was any correlation with BMI vs fasting plasma C-peptide levels (Figure 4) and BMI vs 24-hour–urine C-peptide (Figure 5). There appears to be a significant positive relationship between BMI and fasting plasma C-peptide in the control group (r = 0.54), while the positive correlation between the 2 variables in the test group is not statistically significant (r = 0.34) (Figure 6). Box and whisker plots were produced using the mean, standard deviation, and standard error calculated with Excel (Figure 6). The t test of the data comparing plasma C-peptide between the test group and controls shows a t value of 3.72, df 31 (nT =18, nC =15), standard error difference 0.487, and p < .05. The 95% confidence interval ranges from 0.82 to 2.81. Therefore, the difference in fasting plasma C-peptide concentrations between the 2 groups is statistically significant and unlikely to have occurred by chance.
Figure 4.
Body Mass Index vs Fasting Plasma C-peptide in the Adolescent Test Group and Controls Fasting Plasma C-peptide Concentrations vs BMI in the Test Group Compared to the Controls
Best-fit line was used to determine the correlation.
Figure 5.
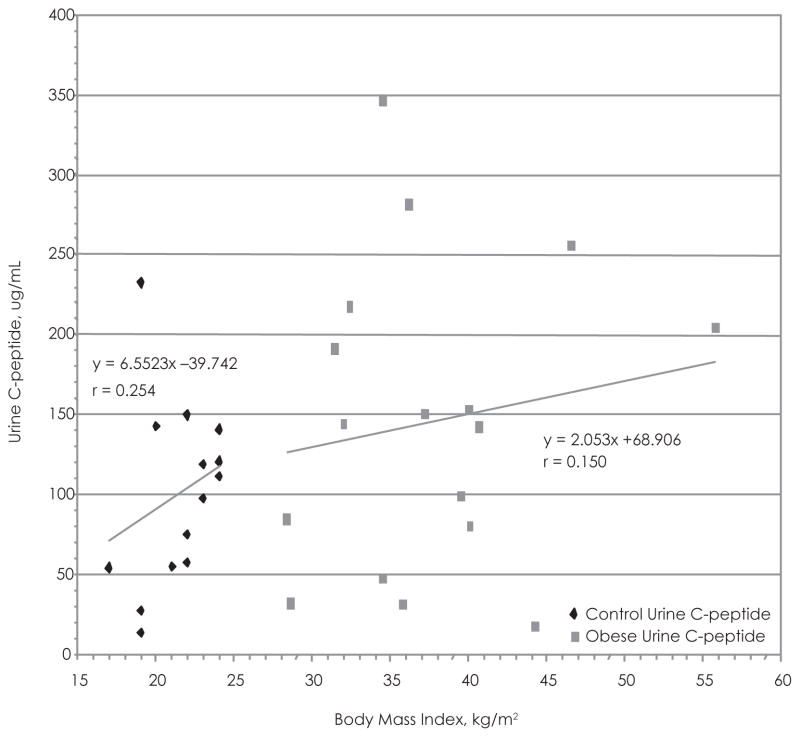
Body Mass Index vs 24-hour–Urine C-peptide in the Adolescent Test Group and Controls
Twenty four-hour urine C-peptide concentrations versus BMI of the test subjects compared to the controls. Urine was diluted ×100. Best-fit line used to determine correlation.
Figure 6.
Statistical Comparison of Fasting Plasma C-peptide in the Adolescent Test Group and Controls
Box and whisker plot of comparing the fasting plasma C-peptide concentrations between the test group and controls.
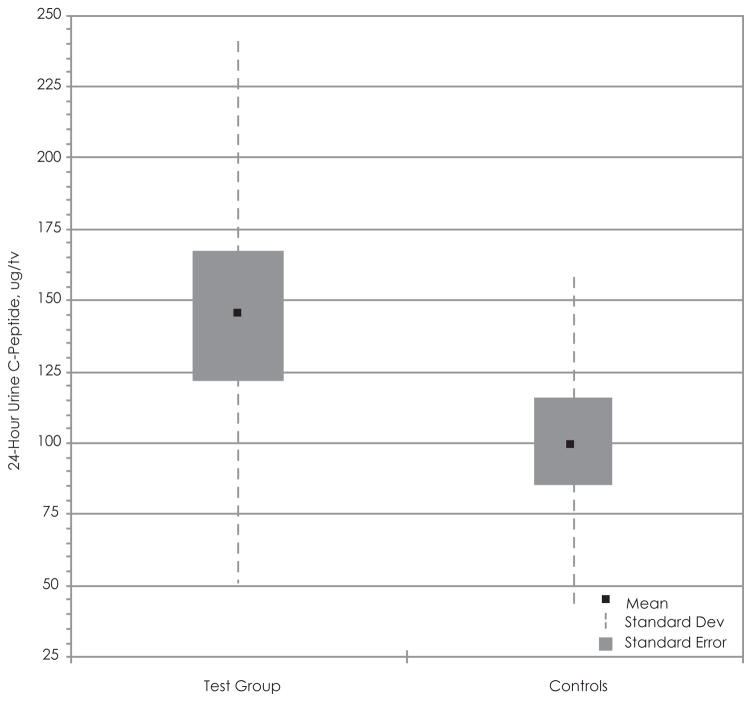
When evaluating the relationship between BMI and 24-hour–urine C-peptide, we noted the presence of an outlier (BMI, 32.3; urine C-peptide, 569.2), which obscured the regression analysis. The outlier was removed from the data set, and the regression analysis demonstrated a positive correlation between the 2 variables in the test group (r = 0.254) and the control group (r = 0.254) (Figure 5). Nevertheless, this positive correlation is not statistically significant. The box and whisker plot shows that the mean 24-hour–urine C-peptide of the test group is greater than the controls but that there is extreme variability in our data (Figure 7). The t test of the data comparing 24-hour–urine C-peptide levels shows a t value of 0.1.58, df 29 (nT =17, nC =14), and p < .05 after removal of the outlier. The 95% confidence interval ranges from 13.5 to 104.9. The difference between the 24-hour–urine C-peptide concentrations between the 2 groups is not statistically significant.
Figure 7.
Statistical Comparison of 24-Hour–Urine C-peptide in the Adolescent Test Group and Controls
Box and whisker plot of comparing the 24-hour urine C-peptide concentrations between the test group and controls.
DISCUSSION
As childhood obesity rates continue to soar, there is an increasing need for accurate and inexpensive methods by which to detect insulin resistance. As insulin resistance progresses, an initial compensatory hyperinsulinemia develops. The elevation of insulin facilitates glucose tolerance and contributes to adiposity. C-peptide will be elevated as an indirect indicator of insulin production. The data derived from this study indicate that there appears to be a positive relationship between BMI and plasma C-peptide concentration. None of the adolescent test subjects exhibited impaired glucose tolerance. So, the significance of elevated C-peptide in these subjects appears to be consistent with mild insulin resistance. This is congruent with the calculated HOMA scores, which were at threshold of insulin resistance.
Our data show the insulin and glucose peaks in the adolescent test subjects occur at different times during the OGTT. This result is unlike what would be expected among subjects with adequate insulin sensitivity, which would exhibit peaks in for all 3 parameters at or near 90 minutes. Plasma C-peptide, insulin, and glucose concentrations should peak during the same time period. The aberrations in C-peptide, insulin, and glucose trends during the OGTT may be indicative of the obesity (BMI ≥85th percentile) and the mild insulin resistance exhibited by the adolescent test subjects. Only a single run of the OGTT was conducted, and it is therefore unclear whether multiple runs would attenuate the observed deviations of if the irregularities would be reproduced.
C-peptide has a longer half-life than insulin and is excreted in the urine without undergoing any biochemical alterations. Thus, urine C-peptide concentration has the ability to serve as an accurate indicator of long-term insulin production and is a direct reflection of plasma C-peptide levels.3,4 Our study shows that mild insulin resistance in the adolescent test group corresponds to an elevation of 24-hour urine C-peptide, which is not as marked as the increase in fasting plasma C-peptide.
Much of the research has demonstrated that C-peptide not only functions as an accurate indicator of insulin secretion rates but may be associated with other medical disorders.8–11 and has diagnostic value, which has been the focus of multiple studies. Although most of the prior investigations included adult test subjects exclusively, a few of the more recent studies have focused on the pediatric population. Sinha et al observed that C-peptide was a very sensitive indicator of glucose tolerance in adolescent subjects with impaired glucose tolerance but not diabetes.9 Caprio et al showed that mild insulin resistance occurs during puberty. They reported that despite identical oral glucose administration, C-peptide responses were markedly greater in adolescents than in preadolescents or adults.
The prevalence of insulin resistance and glucose intolerance is increasing among adolescents and preadolescents.18,19 Body mass index in the adult population has been shown to be tightly associated with the development of insulin resistance. Although not as pronounced as with adults, a similar relationship has been shown in the pediatric population.4 Our efforts to counteract this trend and prevent potential future medical complications will require that we promote healthy lifestyle practices and develop methods of early detection for the pediatric population. C-peptide may serve as one effective means by which to advance toward the accomplishment of this goal.
CONCLUSIONS
Plasma and urine C-peptide in the pediatric population may serve as an accurate indicator of hyperinsulinemia during the early stages of insulin resistance and will require further study. We observed a positive correlation between plasma C-peptide and BMI, and modestly with 24-hour–urine C-peptide. The significance of this relationship has been elucidated in prior studies containing obese and diabetic adult subjects and has recently been reported in obese adolescents. Further studies are warranted, which include a greater sample of African American obese adolescents and controls while performing multiple runs of the OGTT and 24-hour–urine collections in both groups. Given the postulated health benefits of C-peptide, its role in the pediatric population will need to be explored further.
References
- 1.Munte CE, Vilela L, Kalbitzer HR, et al. Solution structure of humal proinsulin C-peptide. FEBS J. 2005;272(16):4283–4293. doi: 10.1111/j.1742-4658.2005.04843.x. [DOI] [PubMed] [Google Scholar]
- 2.McDonald TJ, Knight BA, Shields BM, et al. Stability and reproducibility of a single-sample urinary C-peptide/creatinine ratio and its correlation with 24-hour urinary C-peptide. Clin Chem. 2009;129312(1) doi: 10.1373/clinchem.2009.129312. [DOI] [PubMed] [Google Scholar]
- 3.Hoogwerf BJ, Laine DC, Greene E. Urine C-peptide and creatinine (Jaffe method) excretion in healthy young adults on varied diets: sustained effects of varied carbohydrate protein, and meat content. Am J Clin Nutr. 1986;43:350–360. doi: 10.1093/ajcn/43.3.350. [DOI] [PubMed] [Google Scholar]
- 4.Marques RG, Fontaine MJ, Rogers J. C-peptide: much more than a byproduct of insulin biosynthesis. Pancreas. 2004;29(3):231–238. doi: 10.1097/00006676-200410000-00009. [DOI] [PubMed] [Google Scholar]
- 5.Johansson BL, Borg K, Fernqvist-Forbes E, et al. Beneficial effects of C-peptide on incipient nephropathy and neuropathy in patients with type 1 diabetes mellitus. Diabet Med. 2000;17(3):181–189. doi: 10.1046/j.1464-5491.2000.00274.x. [DOI] [PubMed] [Google Scholar]
- 6.Samnergard B, Jacobson SH, et al. C-peptide prevents glomerular hypertrophy and mesangial matrix expansion in diabetic rats. Nephrol Dial Transplant. 2005;20(3):532–538. doi: 10.1093/ndt/gfh683. [DOI] [PubMed] [Google Scholar]
- 7.Kamiya H, Zhang W, Ekberg K, et al. C-peptide reverses nociceptive neuropathy in type 1 diabetes. J Am Diabetes Assoc. 2006;55(12):3581–3587. doi: 10.2337/db06-0396. [DOI] [PubMed] [Google Scholar]
- 8.Hansen A, Johansson B, Wahren J, et al. C-peptide exerts beneficial effects on myocardial blood flow and function in patients with type 1 diabetes. J Am Diabetes Assoc. 2002;51(10):3077–3082. doi: 10.2337/diabetes.51.10.3077. [DOI] [PubMed] [Google Scholar]
- 9.Sinha R, Fisch G, Teague B, et al. Prevalence of impaired glucose tolerance among children and adolescents with marked obesity. N Engl J Med. 2002;346(11):802–810. doi: 10.1056/NEJMoa012578. [DOI] [PubMed] [Google Scholar]
- 10.Despres JP, Nadeau A, Tremblay A, et al. Role of deep abdominal fat in the association between regional adipose tissue distribution and glucose tolerance in obese women. J Am Diabetes Assoc. 1989;28(3):304–309. doi: 10.2337/diab.38.3.304. [DOI] [PubMed] [Google Scholar]
- 11.Ruhl CE, Everhart JE. Association of diabetes, serum insulin, and c-peptide with gallbladder disease. Hepatology. 2000;31(2):299–303. doi: 10.1002/hep.510310206. [DOI] [PubMed] [Google Scholar]
- 12.Chitturi S, Abeygunasekera S, Farrell GV, et al. NASH and insulin resistance: Insulin hypersecretion and specific association with insulin resistance syndrome. Hepatology. 2002;35(2):373–379. doi: 10.1053/jhep.2002.30692. [DOI] [PubMed] [Google Scholar]
- 13.Birdsall MA, Farquhar CM, White HD. Association between polycystic ovaries and extent of coronary artery disease in women having cardiac catheterization. Ann Intern Med. 1997;126(1):32–35. doi: 10.7326/0003-4819-126-1-199701010-00005. [DOI] [PubMed] [Google Scholar]
- 14.Wei EK, Pollak MN, Rifai N, et al. C-peptide, insulin-like growth factor binding protein-1, glycosylated hemoglobin, and the risk of distal colorectal adenoma in women. Cancer Epidemiol Biomarkers Prev. 2006;15:750. doi: 10.1158/1055-9965.EPI-05-0820. [DOI] [PubMed] [Google Scholar]
- 15.Pollak MN, Chapman JW, Shepherd L, et al. Insulin resistance, estimated by serum C-peptide level, is associated with reduced event-free survival for postmenopausal women in NCIC CTG MA.14 adjuvant breast caner trial. J Clin Oncol. 2006;24:524. [Google Scholar]
- 16.Van Cauter E, Mestrez F, Sturis J, et al. Estimation of insulin secretion rates from c-peptide levels. Comparison of individual and standard kinetic parameters for C-peptide clearance. A J Am Diabetes Assoc. 1992;41(3):368–377. doi: 10.2337/diab.41.3.368. [DOI] [PubMed] [Google Scholar]
- 17.Faber OK, Hagen C, Binder C, et al. Kinetics of human connecting peptide in normal and diabetic subjects. J Clin Invest. 1978;62(1):197–203. doi: 10.1172/JCI109106. [DOI] [PMC free article] [PubMed] [Google Scholar]
- 18.Caprio S, Plewe G, Diamond MP, et al. Increased insulin secretion in puberty: a compensatory response to reduction in insulin sensitivity. J Pediatr. 1989;114(6):963–967. doi: 10.1016/s0022-3476(89)80438-x. [DOI] [PubMed] [Google Scholar]
- 19.Jensen RA, Gilliam LK, Torn C, et al. Multiple factors affect the loss of measurable C-peptide over 6 years in newly diagnosed 15-to 35-year-old diabetic subjects. J Diabetes Complications. 2007;21(4):205–213. doi: 10.1016/j.jdiacomp.2006.01.004. [DOI] [PubMed] [Google Scholar]


