

Abstract
Background
Seven national 2020 Strategic Impact Goals for cardiovascular health (Life’s Simple 7 [LS7]) estimates for major ethnic/racial groups are available, but not for diverse Hispanics/Latinos. Herein, we describe and examine LS7 profiles of diverse Hispanic/Latino groups.
Methods
HCHS/SOL (analytic n = 15,825; ages 18–74 years) data were used to estimate LS7 metrics. LS7 metrics were operationalized as Ideal, Intermediate, or Poor and indexed as an additive score. We calculated Hispanic/Latino group and sex-specific prevalence estimates for LS7 metrics and used survey-based regression models to examine (1) associations between LS7 scores and pertinent sociocultural characteristics and (2) relationships between LS7 scores and coronary heart disease, and stroke and transient ischemic attacks prevalence.
Results
Few HCHS/SOL participants met all 7 Ideal LS7 criteria (<1%), and a similarly small proportion did not meet any Ideal LS7 criteria (1.1%). We found significant variability in LS7 distributions between men and women and across HCHS/SOL Hispanic/Latino heritages. We also found a substantial sex-adjusted age gradient in LS7 cardiovascular health (ie, ≥4 Ideal LS7s). Finally, higher Ideal LS7 scores were associated with decreased odds of both coronary heart disease and self-reported stroke/transient ischemic attack; these associations persisted after model covariate adjustments.
Conclusions
Hispanic/Latino LS7s compared favorably with existing national estimates; however, we found areas for improvement. Several Hispanic/Latino LS7 strengths and weaknesses varied by sex and heritage, providing important information to guide targeted health promotion efforts toward achieving 2020 goals.
The American Heart Association (AHA) established 7 national goals in 2010 “to improve the cardiovascular health (CVH; also known as Life’s Simple 7 [LS7]) of all Americans by 20% while reducing cardiovascular disease (CVD) and stroke-related deaths by 20%” by year 2020.1, p587 For the nation to achieve its 2020 Goals, knowing the current LS7 epidemiology of all Americans including understudied major ethnic/racial groups is vital for success. By year 2020, Hispanics/Latinos are projected to represent nearly one-fifth of the US population. Hispanics/Latinos are culturally, demographically, ethnically, and socioeconomically diverse, yet rarely is this variability examined in health research.2–4 Thus, a more granular understanding of the nearly 20% of US residents who identify themselves as being from one of several Hispanic/Latino heritages would benefit targeted efforts to improve CVH by 20% by 2020; however, these estimates simply do not exist.
There are major knowledge gaps in our current understanding of the CVH of Hispanics/Latinos. Hispanics/Latinos share many cultural commonalities, yet presuming that all groups are indistinguishable and can be treated as one aggregated and homogeneous group in research can lead to incorrect inferences that mask important and actionable health information. Given current scientific gaps and 2020 Goals, we sought to provide 2010 baseline LS7 metrics of Hispanic/Latino CVH to facilitate monitoring progress. We examine the Goals’ combined total of 7 CVH metrics by aggregated Hispanic/Latino heritages, followed by detailed analyses of individual LS7 components by disaggregated Hispanic/Latino heritages. To achieve these aims, we use baseline (2008–2011) data from the HCHS/SOL.
Methods
Study sample
The HCHS/SOL is a multiethnic, multisite, prospective cohort study of 16,415 community-dwelling Hispanic/Latino adults (18–74 years old). The sample design was formulated to estimate community representative baseline CVD risk factors for Hispanics/Latinos overall and for specific heritages, including Central Americans, Cubans, Dominicans, Mexicans, Puerto Ricans, and South Americans. Data were collected from field centers located in 4 major US cities with substantial Hispanic/Latino population concentrations: Bronx, NY; Chicago, IL; Miami, FL; and San Diego, CA. Participants were selected by population-based multistage probability sampling of households within census blocks. Details regarding the HCHS/SOL sampling approach and methods have been published previously.5,6
The HCHS/SOL received support contracts and grants from the National Institute of Health, and additional details are provided in the Funding section below. The authors are solely responsible for the design and conduct of this study, and all study analyses, drafting and editing of the manuscript, and its final contents.
Measures
Individual LS7 indicators were coded to reflect AHA specifications (Table I). Each LS7 measure was coded as a 3-category indicator that grouped individuals’ scores as meeting Ideal (2), Intermediate (1), or Poor (0) criteria. Participants’ LS7 criterion scores were then summed (range 0–14), with higher scores indicating better CVH. We also considered a second LS7 index (range 0–7) based on the sum of Ideal criteria. Lastly, we generated a dichotomous LS7 CVH cutpoint (≥4 Ideal indicators) based on previous associations with lower 20-year cumulative coronary heart disease (CHD) incidence and other adverse health outcomes.7–9
Table I.
AHA 2020 LS7 definitions
| Definitions
| |||
|---|---|---|---|
| LS7s | Poor | Intermediate | Ideal |
| Diet* | 0–1 | 2–3 | 4–5 |
| Physical activity | None | 1–149 min/wk moderate, or 1–74 min/wk vigorous, or 1–149 min/wk combined intensity |
≥150 min/wk moderate, or ≥75 min/wk vigorous, or ≥150 min/wk combined |
| Smoking | Current | Former but quit ≤1 y | Never or former but quit >1 y |
| BMI (kg/m2) | ≥30 | ≥25–<30 | <25 |
| BP (mm Hg) | Systolic ≥140 or diastolic ≥90 | Systolic 120–139 or diastolic 80–89 or treated to control | Systolic <120 and diastolic <80 |
| Cholesterol (mg/dL) | >240 | 200–<240 or treated to control | <200 |
| Fasting glucose (mg/dL) | ≥126 | ≥ 100 and < 126 or treated to control | <100 |
AHA diet score includes 5 criteria: ≥4.5 servings/d of fruits and vegetables, ≥7-oz servings/wk of Fish, ≥3 servings/d of grain, ≤4.5 servings/wk of sweetened beverages, and <1500 mg/d of sodium.
The 3 self-reported behavioral measures included diet, physical activity, and smoking (Table I). Two 24-hour dietary recalls of 5 food categories were averaged and scored as Ideal (4 or 5 criteria), Intermediate (2 or 3 criteria), and Poor (<2 criteria). Participants with extreme sex-specific energy intakes (ie, lowest or highest 1 percentile for either 24-hour recall) were classified as having a Poor diet. Second, self-reported daily engagement (minutes) in moderate or vigorous physical activity was multiplied times 7 to yield weekly averages.10 Third, self-reported smoking practices were classified according to Goals (Table I). In addition to self-reported measures, the LS7 indicators include 4 biological markers: body mass index (BMI), blood pressure (BP), total cholesterol, and fasting blood glucose (Table I). Body mass index was calculated as weight (nearest 0.1 kg) divided by height (in cm2, nearest centimeters). After a 5-minute rest, 3 seated BP measurements were conducted with an automatic sphygmomanometer, and the averaged second and third readings were used. Blood samples including fasting blood were collected following standardized protocols. Total cholesterol was measured by using a cholesterol oxidase enzymatic method. Fasting blood glucose was measured with a hexokinase enzymatic method (Roche Diagnostics, Roche Diagnostics, Indianapolis, IN).
Covariates
Analyses controlled for sex (male, female) and age in years (4 categories: 18–44, 45–54, 55–64, and 65–74). Additional sociocultural covariates included education (<high school, high school, some college, >college), household income (unreported, ≤$20,000, $20,001–$50,000, >$50,000), marital status (single, married/partner, separated/divorced/widowed), nativity and years of US residency (US-born, <5, 5–15, 15+), language preference (Spanish/English), and health insurance coverage (uninsured/insured).
Analytic procedures
Analytic procedures for complex survey sample designs, specifically Taylor Series Linearization, in the Stata software package (13.1; Stata, College Station, TX) were used, including appropriate subpopulation analytic procedures for generating estimates. Participants not reporting a specific single Hispanic/Latino heritage (n = 590) were excluded. Missing values on the individual LS7 indicators ranged from a low of n = 19 for BP to high physical activity (n = 174). A total of n = 460 respondents (3.6% of the analytic sample) had missing LS7 values (final analytic n = 15,825). This study protocol was reviewed and approved by the Michigan State University institutional review board and participating sites’ institutional review boards.
Data analyses were conducted in 5 steps. First, we analyzed and presented population-weighted descriptive statistics for the variables of interest by Hispanic/Latino heritage (Table II). Second, to facilitate comparison with national estimates from the National Health and Nutrition Examination Survey (NHANES), we generated prevalence estimates for counts of Ideal LS7 indicators that are adjusted to the 2010 census age standard distribution for the total sample as well as by sex (Table III). To facilitate interpretation and visualization, we plotted these estimated prevalence rates in Figure 1. Third and following the above-stated rationale, we provided age-standardized prevalence estimates for the trichotomous LS7 indicators (ie, Ideal, Intermediate, and Poor) and their 95% CIs for the total sample, by Hispanic/Latino heritage, and stratified by sex (Supplementary Table I). We used a Pearson χ2 test of independence with Rao and Scott second-order correction to test whether the LS7 indicators were similarly distributed across heritage groups.11 Fourth, we used logistic regression models to generate a health profile for the HCHS/SOL participants by computing age- and sex-adjusted prevalence estimates and their 95% CIs for our dichotomous LS7 CVH indicator (ie, presence of ≥4 Ideal indicators) by age groups, sex, education, income, insurance status, language preference, marital status, and nativity/years of US residence. In addition, we used linear regression models to compute similar profiles using mean levels of LS7 based on 2 generated indices using the sum of the dichotomous (ie, 0 not Ideal, 1 Ideal; range 0–7) and trichotomous (ie, 0 Poor, 1 Intermediate, and 2 Ideal; range 0–14) LS7 indicators (Table IV). Subsequently, we computed and plotted total and sex-specific prevalence estimates and their 95% CIs for our LS7 CVH indicator by Hispanic/Latino heritage (Figure 2). Fifth and as a proof of concept, we fitted logistic regression models to test the relationship between LS7 scores (range 0–14) and the prevalence of 2 CVDs: CHD, and self-reported stroke and/or transient ischemic attacks (TIAs). Coronary heart disease was measured based on a combination of self-reported medical history and electrocardiogram reports of possible old myocardial infarction, angina, myocardial infarction, or procedure (eg, angioplasty, stent, and bypass). Stroke and TIA were based on self-reported responses to probes on (1) whether the participant was ever told by a doctor “that you had a mini-stroke or TIA?” or (2) “that you had a stroke?” We generated unadjusted and covariates adjusted coefficients for the total sample, as well as the sex-stratified subsamples (Supplementary Table II). To facilitate the interpretation of our model results, we provided a plot for the estimated unadjusted and adjusted probabilities of CHD and self-reported stroke/TIA across the LS7 range for men and women (Supplementary Figure 1).
Table II.
Demographic characteristics of HCHS/SOL (baseline 2008–2011) by Hispanic/Latino heritage
| Dominican (n = 1473), % (95% CI) | Central American (n = 1732), % (95% CI) | Cuban (n = 2348), % (95% CI) | Mexican (n = 6472), % (95% CI) | Puerto Rican (n = 2728), % (95% CI) | South American (n = 1072), % (95% CI) | Total (n = 15,825), % (95% CI) | |
|---|---|---|---|---|---|---|---|
| Sex | |||||||
| Male | 39.6 (35.9–43.3) | 47.3 (44–50.5) | 52.3 (50.2–54.3) | 46.8 (45–48.7) | 50.6 (47.8–53.3) | 45.5 (41.6–49.6) | 47.8 (46.8–48.9) |
| Female | 60.5 (56.7–64.1) | 52.8 (49.5–56) | 47.8 (45.7–49.8) | 53.2 (51.3–55) | 49.4 (46.7–52.2) | 54.5 (50.4–58.5) | 52.2 (51.2–53.2) |
| Age (y) | |||||||
| 18–44 | 62.4 (58.3–66.4) | 64.3 (60.8–67.7) | 45.5 (42.6–48.4) | 67.2 (64.9–69.5) | 53.3 (50.1–56.4) | 55.9 (51.2–60.6) | 59.0 (57.5–60.5) |
| 45–54 | 19.3 (16.8–22) | 17.7 (15.4–20.2) | 21.4 (19.8–23.2) | 17.1 (15.7–18.5) | 21.2 (19–23.5) | 22.3 (19.1–25.7) | 19.2 (18.3–20.1) |
| 55–64 | 12.0 (10.3–13.9) | 11.7 (10.1–13.6) | 16.3 (14.7–18.1) | 10.6 (9.4–12.0) | 15.9 (13.8–18.3) | 13.3 (11.2–15.7) | 13.1 (12.3–13.9) |
| 65+ | 6.4 (4.7–8.6) | 6.3 (4.7–8.3) | 16.8 (14.6–19.2) | 5.1 (4.3–6.0) | 9.7 (8.0–11.6) | 8.5 (6.3–11.3) | 8.7 (8.0–9.5) |
| Education | |||||||
| Less than high school | 36.6 (33.2–40.2) | 46.2 (42.7–49.6) | 25.7 (23.5–28.1) | 44.0 (41.4–46.6) | 40.5 (37.2–43.8) | 27.4 (23.4–31.8) | 38.1 (36.6–39.6) |
| High school | 26.0 (22.6–29.7) | 20.4 (17.6–23.5) | 31.8 (29.6–34.1) | 21.9 (20.1–23.8) | 24.5 (22.0–27.0) | 22.8 (19.2–26.9) | 24.7 (23.6–26.0) |
| Some college | 23.6 (20.5–26.9) | 21.0 (18.4–23.7) | 20.2 (18.1–22.5) | 20.4 (18.8–22.1) | 24.4 (21.7–27.2) | 27.4 (23.9–31.1) | 21.8 (20.7–22.8) |
| College or more | 13.8 (11.8–16) | 12.5 (10.4–15.0) | 22.3 (20.2–24.5) | 13.8 (11.3–16.7) | 10.7 (8.7–13.1) | 22.4 (18.9–26.4) | 15.4 (14.1–16.8) |
| Income | |||||||
| ≤$20,000 | 48.5 (44.4–52.7) | 47.1 (43.3–51.0) | 45.9 (43.1–48.8) | 37.1 (34.1–40.1) | 45.2 (41.8–48.6) | 40.7 (36.7–44.9) | 42.4 (40.7–44.2) |
| $20,001–$50,000 | 33.3 (29.8–36.9) | 33.9 (30.5–37.5) | 30.5 (27.8–33.4) | 42.8 (40.7–45.0) | 32.9 (29.7–36.2) | 40.5 (36.7–44.3) | 36.8 (35.4–38.1) |
| ≥$50,001 | 7.5 (5.6–10) | 6.9 (5.2–9.1) | 7.6 (5.9–9.6) | 14.9 (12.3–17.9) | 13.0 (11.0–15.3) | 10.9 (8.6–13.8) | 11.4 (10.1–13.0) |
| Not reported | 10.7 (8.8–12.9) | 12.1 (10.2–14.3) | 16.0 (14.0–18.2) | 5.3 (4.6–6.1) | 8.9 (7.6–10.4) | 7.9 (5.9–10.4) | 9.4 (8.6–10.2) |
| Marital status | |||||||
| Single | 47.1 (43.5–50.7) | 39.4 (36.4–42.4) | 26.3 (23.8–28.9) | 28.2 (26.2–30.3) | 47.7 (44.6–50.8) | 30.0 (26.1–34.1) | 34 (32.7–35.3) |
| Married/partner | 37.0 (33.6–40.4) | 46.1 (42.9–49.2) | 51.3 (48.3–54.3) | 59.4 (57.0–61.8) | 33.3 (30.5–36.4) | 49.6 (45.3–53.8) | 49.5 (47.9–51) |
| Separated/divorced/widowed | 16.0 (13.6–18.7) | 14.6 (12.8–16.6) | 22.4 (20.2–24.8) | 12.4 (11.1–13.8) | 19.0 (16.7–21.5) | 20.5 (17.2–24.3) | 16.5 (15.6–17.5) |
| Nativity (years in the United States) | |||||||
| US born | 16.7 (13.3–20.9) | 7.4 (5.5–10.0) | 7.3 (5.6–9.3) | 23.7 (21.7–25.8) | 48.1 (45.1–51.2) | 5.6 (4.0–7.8) | 21.5 (20.0–23.0) |
| <5 | 11.2 (9.0–13.8) | 16.1 (13.6–18.9) | 30.6 (27.4–34.0) | 9.8 (8.3–11.5) | 3.3 (2.3–4.7) | 12.4 (9.6–15.8) | 13.8 (12.4–15.3) |
| 5–<15 | 25.9 (22.3–29.8) | 36.1 (32.3–40.1) | 31.9 (29.0–35.0) | 27.2 (25.1–29.4) | 7.5 (5.9–9.5) | 47.5 (43.4–51.6) | 26.5 (25.1–27.9) |
| 15+ | 46.2 (42.1–50.3) | 40.4 (36.8–44.2) | 30.2 (26.8–33.9) | 39.4 (37.1–41.7) | 41 (38.1–44) | 34.6 (30.6–38.7) | 38.3 (36.7–39.9) |
| Language preference | |||||||
| Spanish | 76.2 (71.3–80.5) | 87.7 (84.5–90.4) | 92.7 (90.8–94.2) | 78 (75.8–80.1) | 41.1 (37.7–44.6) | 89.8 (86.7–92.2) | 76 (74.2–77.7) |
| English | 23.8 (19.5–28.7) | 12.3 (9.6–15.5) | 7.4 (5.8–9.2) | 22 (19.9–24.2) | 58.9 (55.4–62.3) | 10.3 (7.9–13.3) | 24 (22.3–25.8) |
| Insurance status | |||||||
| Not insured | 29.2 (25.4–33.2) | 68.6 (64.4–72.5) | 58.1 (54.8–61.3) | 57.6 (54.8–60.4) | 21.5 (18.9–24.3) | 58.2 (53.9–62.5) | 49.8 (48.0–51.6) |
| Insured | 70.8 (66.8–74.6) | 31.4 (27.5–35.6) | 41.9 (38.7–45.2) | 42.4 (39.6–45.2) | 78.5 (75.8–81.1) | 41.8 (37.5–46.1) | 50.3 (48.5–52.0) |
Table III.
Unadjusted and age-adjusted to the 2010 Census, distributions of Ideal LS7s at HCHS/SOL baseline (2008–2011)
| Total sample (%) | Sex
|
Age (y)
|
|||||
|---|---|---|---|---|---|---|---|
| Male | Female | 18–44 | 45–54 | 55–64 | 65+ | ||
| Unadjusted HCHS/SOL No. of Ideal LS7 criteria | |||||||
| 7 | 0.1 | 0.1 | 0.2 | 0.2 | 0.0 | 0.0 | 0.0 |
| 6 | 6.0 | 4.6 | 7.3 | 9.6 | 1.6 | 0.4 | 0.2 |
| 5 | 16.7 | 13.4 | 19.7 | 24.3 | 8.7 | 4.1 | 2.2 |
| 4 | 23.2 | 22.6 | 23.7 | 28.2 | 20.3 | 13.2 | 10.7 |
| 3 | 25.1 | 28.3 | 22.1 | 22.7 | 29.6 | 28.9 | 25.1 |
| 2 | 19.5 | 21.4 | 17.7 | 11.6 | 26.9 | 32.8 | 35.7 |
| 1 | 8.4 | 8.4 | 8.4 | 3.0 | 11.0 | 18.2 | 24.0 |
| 0 | 1.1 | 1.2 | 1.0 | 0.3 | 2.0 | 2.5 | 2.1 |
| Census age-standardized* HCHS/SOL No. of Ideal LS7 criteria | |||||||
|
| |||||||
| 7 | 0.1 | 0.1 | 0.2 | N/A | N/A | N/A | N/A |
| 6 | 5.5 | 4.1 | 6.8 | N/A | N/A | N/A | N/A |
| 5 | 15.5 | 12.2 | 18.6 | N/A | N/A | N/A | N/A |
| 4 | 22.3 | 21.6 | 23.0 | N/A | N/A | N/A | N/A |
| 3 | 25.4 | 28.4 | 22.6 | N/A | N/A | N/A | N/A |
| 2 | 20.8 | 22.8 | 18.7 | N/A | N/A | N/A | N/A |
| 1 | 9.3 | 9.5 | 9.0 | N/A | N/A | N/A | N/A |
| 0 | 1.2 | 1.4 | 1.1 | N/A | N/A | N/A | N/A |
Age standardization is performed by applying weights based on a standard national census age distribution to the estimated prevalence in the HCHS/SOL data. By doing so, we reduce the confounding effects of age when comparing prevalence across data sets with differentage distributions (ie, the NHANES reported prevalence of LS7 criteria vs HCHS/SOL calculated prevalence).
Figure 1.
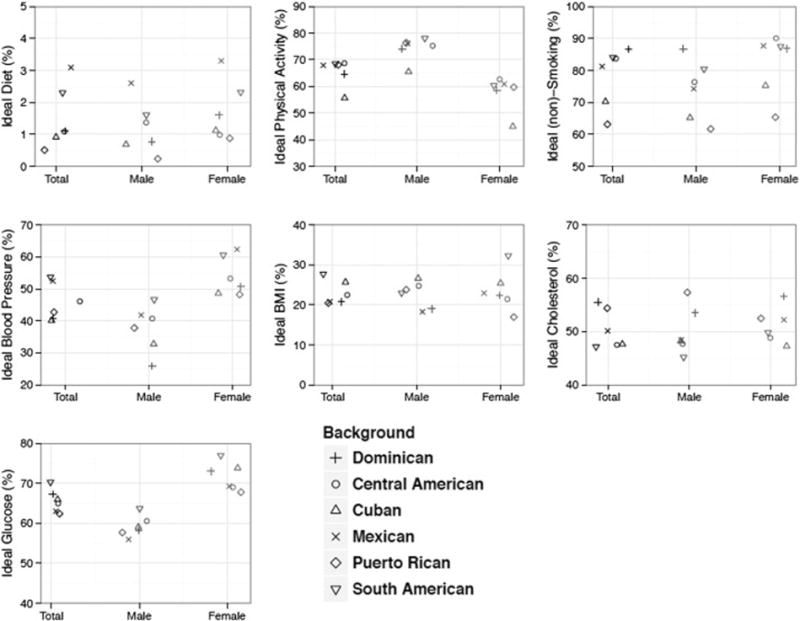
Prevalence (%) estimates of Ideal LS7 factors by sex and Hispanic/Latino heritage in HCHS/SOL (baseline 2008–2011). Note: with the exception of fasting blood glucose prevalence estimates for men (P = .0037), differences in estimated prevalences were significant at P < .001 based on a global Rao-Scott survey–adjusted χ2 test that the estimated prevalences from a 2-way (6 × 3) table are independent. Detailed descriptions of the LS7 criteria for Ideal, Intermediate, and Poor groups are provided in Table I.
Table IV.
Age- and sex-adjusted prevalence of ideal AHA LS7 and mean LS7 scores by age, education, income, acculturation, and lifestyle factors (HCHS/SOL baseline 2008–2011)
| ≥4 Ideals
|
AHA LS7 (0–7)
|
AHA LS7 (0–14)
|
||||
|---|---|---|---|---|---|---|
| % (95% CI) | F test | M (95% CI) | F test | M (95% CI) | F test | |
| Age (y)* | ||||||
| 18–44 | 62.6 (61.0–64.2) | P = .0000 | 3.89 (3.84–3.93) | P = .0000 | 9.27 (9.20–9.35) | P = .0000 |
| 45–54 | 30.5 (28.5–32.5) | 2.88 (2.82–2.93) | 7.89 (7.79–8.00) | |||
| 55–64 | 17.4 (15.6–19.2) | 2.45 (2.40–2.50) | 7.29 (7.18–7.40) | |||
| 65+ | 12.8 (10.1–15.5) | 2.24 (2.15–2.33) | 7.15 (6.99–7.31) | |||
| Sex* | ||||||
| Male | 39.6 (37.9–41.3) | P = .0000 | 3.18 (3.13–3.23) | P = .0000 | 8.38 (8.29–8.46) | P = .0000 |
| Female | 51.9 (50.3–53.5) | 3.52 (3.47–3.57) | 8.73 (8.64–8.81) | |||
| Education | ||||||
| Less than high school | 44.1 (42.3–46.0) | P = .0000 | 3.28 (3.22–3.33) | P = .0000 | 8.43 (8.34–8.52) | P = .0000 |
| High school | 45.0 (42.9–47.2) | 3.33 (3.27–3.39) | 8.47 (8.37–8.58) | |||
| Some college | 46.1 (43.7–48.6) | 3.39 (3.31–3.46) | 8.62 (8.50–8.73) | |||
| College or more | 52.4 (49.5–55.2) | 3.58 (3.49–3.66) | 8.97 (8.81–9.12) | |||
| Income | ||||||
| ≤$20,000 | 43.9 (42.1–45.8) | P = .0032 | 3.28 (3.23–3.33) | P = .0000 | 8.40 (8.31–8.48) | P = .0000 |
| $20,001–$50,000 | 47.0 (45.2–48.9) | 3.41 (3.35–3.46) | 8.67 (8.57–8.76) | |||
| ≥$50,001 | 50.7 (47.2–54.1) | 3.49 (3.39–3.59) | 8.91 (8.74–9.08) | |||
| Not reported | 45.6 (42.3–48.8) | 3.36 (3.27–3.44) | 8.46 (8.33–8.59) | |||
| Marital status | ||||||
| Single | 45.1 (43.0–47.2) | P = .4636 | 3.33 (3.27–3.39) | P = .4831 | 8.44 (8.34–8.53) | P = .0009 |
| Married/partner | 46.7 (44.9–48.4) | 3.37 (3.32–3.42) | 8.65 (8.56–8.74) | |||
| Separated/divorced/widowed | 45.9 (43.3–48.5) | 3.37 (3.30–3.45) | 8.55 (8.43–8.67) | |||
| Nativity (years in the United States) | ||||||
| US born | 44.6 (42.1–47.2) | P = .3705 | 3.30 (3.22–3.38) | P = .043 | 8.3 (8.17–8.44) | P = .0000 |
| <5 | 46.6 (43.6–49.5) | 3.43 (3.34–3.51) | 8.69 (8.54–8.84) | |||
| 5–15 | 47.2 (45.1–49.3) | 3.39 (3.33–3.46) | 8.69 (8.57–8.80) | |||
| 15+ | 45.7 (43.8–47.6) | 3.34 (3.29–3.39) | 8.57 (8.49–8.65) | |||
| Language preference | ||||||
| Spanish | 46.6 (45.1–48.0) | P = .0863 | 3.37 (3.33–3.42) | P = .0721 | 8.64 (8.56–8.72) | P = .0000 |
| English | 44.3 (41.8–46.8) | 3.30 (3.23–3.38) | 8.30 (8.18–8.42) | |||
| Inurance status | ||||||
| Not insured | 45.3 (43.8–46.8) | P = .1586 | 3.33 (3.28–3.38) | P = .0721 | 8.51 (8.43–8.60) | P = .0739 |
| Insured | 46.8 (44.9–48.6) | 3.39 (3.33–3.44) | 8.61 (8.52–8.71) | |||
M indicates mean value. Four or more Ideal LS7s as a CVH cut point based on previous work indicating that this threshold was associated with lowered 20-year cumulative CHD incidence and other adverse health outcomes. AHA LS7 (0–14) generated by summing across respondent indexed values on the individual trichotomous (ie, 0 Poor, 1 Intermediate, and 2 Ideal) LS7 indicators and higher scores indicate better CVH. AHA LS7 (0–7) generated by summing across respondent number of satisfied Ideal LS7 criteria (ie, 0 Not ideal, 1 Ideal) and higher scores indicate better CVH.
Figure 2.
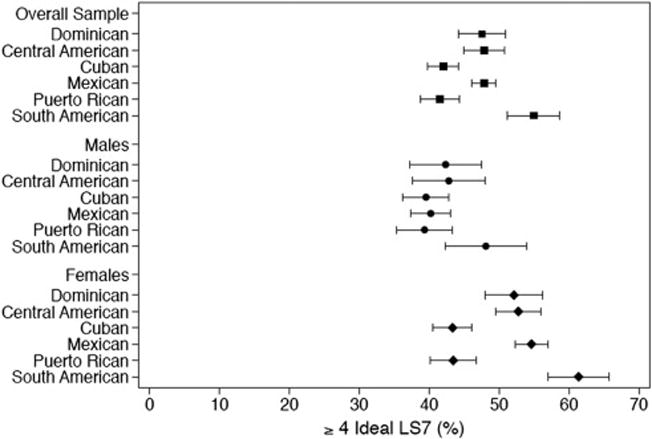
Prevalence estimates of AHA LS7 (≥4 Ideal LS7s) by Hispanic/Latino heritage and sex in HCHS/SOL (baseline 2008–2011). Note: 4 or more Ideal LS7s as a CVH cut point based on previous work indicating that this threshold was associated with lowered 20-year cumulative CHD incidence and other adverse health outcomes. Black squares are estimates for the overall sample, circles are for men, and diamonds are for women.
Results
Demographic characteristics
HCHS/SOL demographic statistics by Hispanic/Latino group are provided in Table II. Our estimates indicate significant distributional differences between heritage groups with respect to sex, age, education, income, marital status, nativity/years of US residency, language preference, and health insurance status.
LS7 counts
Few Hispanics/Latinos (Table III) met all 7 Ideal LS7 criteria (<1%) or no Ideal LS7 criteria (1.1%). Study results suggest age and sex gradients in the distribution of Ideal LS7 criteria attained (P < .001) with older age and being male being associated with fewer Ideal LS7s.
LS7 profile by sex and Hispanic/Latino heritage
Prevalence estimates for each individual LS7 indicators (eg, Ideal) overall and stratified by sex are presented in Figure 1 and detailed in Supplementary Table I. Unless otherwise specified, all reported tests of independence were significant at P < .001. Analyses of behavioral indicators showed that few Hispanic/Latinos met the Ideal diet criteria (1.7%), whereas nearly two-thirds (65.2%) met the Ideal physical activity criterion. More than three-quarters (76.5%) met the Ideal nonsmoking criteria. Women were more likely to have Ideal levels for diet (2.0% vs 1.3%) and nonsmoking (82% vs 70%), when compared with men. Fewer women (57.6%) met the Ideal physical activity criteria compared with men (73.7%). Regarding Hispanic/Latino group differences in LS7, more Mexican-origin persons reported (47.5%) meeting the Ideal or Intermediate diet criteria compared with others (36.7%). Cuban-origin individuals were least likely to meet the Ideal physical activity criteria (55.7%), and Puerto Rican had the lowest prevalence (63.3%) of meeting the Ideal smoking status criteria.
For LS7 biological markers, few Hispanics/Latinos met Ideal LS7 the BMI criterion (22.3%).1 Less than half of Hispanics/Latinos (46.5%) had Ideal BP, whereas slightly more than half (50.6%) met the Ideal total cholesterol criterion. Lastly, almost two-thirds (64.4%) of Hispanics/Latinos met the Ideal fasting blood glucose criteria. As with the behavioral indicators, we found some significant sex differences in the distributions of biological indicators. Women were 47% more likely than men to have met the Ideal BP criteria (55.1% vs 37.6%), and 23% more likely to have met the Ideal fasting blood glucose criterion (70.6% vs 57.6%). We also found significant Hispanic/Latino group differences with higher Ideal BP among the South American (54%) and Mexican (52.5%) groups compared with other groups combined (46.5%). Dominican (55.5%) and Puerto Rican (54.4%) groups were most likely to have met the Ideal total cholesterol criteria (cf, 50.6% total sample), whereas South Americans (70.5%) had the highest prevalence of meeting the Ideal fasting blood glucose criteria.
LS7 profiles
The estimated prevalence rates for meeting favorable CVH criterion (≥4 Ideal) and estimated means for the continuous LS7 indices are presented in Table IV. We found a substantial sex-adjusted age gradient in LS7’s (4+ Ideal LS7s and continuous index) favoring younger (18–44 years; 62.2%; mean 9.3 with a 95% CI of 9.2–9.4) compared with older (65–74 years) Hispanics/Latinos (12.8%; mean 7.2, 95% CI 6.99–7.3). Women (51.9%) were 30% more likely to meet our CVH criterion (4+ Ideal LS7s) compared with men (39.6%), adjusted for age.
We found important differences in LS7 distributions by Hispanic/Latino background (Figure 2; age- and sex-adjusted estimates). Cuban (42%) and Puerto Rican groups (41.5%) were significantly less likely to meet favorable CVH criterion than the reference group (Mexican-origin; 47.8%; age- and sex-adjusted). The South American heritage group (54.9%) had the highest proportion of persons meeting the CVH criterion. These between-Hispanic/Latino-group differences were largely driven by differences among women. Women of Cuban (43.3%) and Puerto Rican heritage (43.4%) were less likely to meet the CVH criteria relative to Mexican-origin women (54.6%), whereas South Americans had the highest prevalence of CVH criteria (61.4%), controlling for age. In age-adjusted analyses, findings for men of diverse Hispanic/Latino backgrounds were statistically indistinguishable.
We found significant variations in CVH criterion prevalence (age- and sex-adjusted) by household income and education (Table IV). Individuals reporting higher annual household incomes (>$50,000) were 15.5% more likely to have met our favorable CVH criterion than those reporting lower household incomes (<$20,000/y). Similarly, individuals reporting college or more were 19% more likely to have our CVH criterion than high school noncompleters. These results were consistent when we examined the continuous LS7 indices.
We did not find statistically significant differences in Ideal LS7 attainment across groups based on marital status, acculturation (nativity/years in United States), and language preference (Table IV). Some of these group comparisons achieved nominal statistical significance when examining the more granular continuous LS7 index outcomes, although results tended not to be statistically significant for both versions of the LS7 index (range 0–7 vs 0–14). There was no consistent trend in Ideal CVH or LS7 score across nativity/duration of US residence categories (Table IV).
LS7s, CHD, and self-reported stroke/TIA
We evaluated the association between Ideal LS7s and CHD (n = 1,103) and self-reported stroke/TIA (n = 393) in age- and sex-adjusted logistic regression models (Supplementary Table II). We found that higher Ideal LS7s (0–14) were associated with decreased odds of both CHD (odds ratio [OR] 0.86, 95% CI 0.82–0.90) and self-reported stroke/TIA (OR 0.85, 95% CI 0.79–0.92). Additional covariate adjustment (ie, household income, health insurance, language, Hispanic/Latino heritage, marital status, and nativity/US residency years) did not attenuate the associations between higher LS7s, CHD (OR 0.87, 95% CI 0.83–0.92) and self-reported stroke/TIA (OR 0.88, 95% CI 0.81–0.95) (Supplementary Table II). Sex-stratified analyses also indicated an inverse association between higher LS7 scores and lower odds of CHD and self-reported stroke/TIA. LS7 score associations with the odds of CHD in the age-adjusted model among women (OR 0.83, 95% CI 0.78–0.88) were slightly different compared with men (OR 0.87, 95% CI 0.82–0.93). Controlling for covariates partially attenuated the association between LS7 scores and the odds of CHD among women (OR 0.87, 95% CI 0.82–0.93), but the associations remained statistically significant among both men and women. We found similar sex-stratified associations between LS7 and the odds of self-reported stroke/TIA (adjusted OR 0.87 [95% CI 0.77–0.97] among men and adjusted OR 0.90 [95% CI 0.83–0.97] among women). Supplementary Figure 1 depicts the estimated marginal probabilities from sex-stratified logistic models of CHD and stroke adjusted for age and then other model covariates.
Discussion
To achieve the AHA 2020 Strategic Impact Goals of reducing cardiovascular morbidity and mortality, it is first essential to establish reliable 2010 LS7 baseline estimates for all populations. Our HCHS/SOL findings fill major gaps in current understanding of LS7 CVH of Hispanic/Latinos in toto and of important and rapidly expanding heritage groups. Although few Hispanics/Latinos met all Ideal LS7 goals, the prevalence was higher than reported nationally (ie, NHANES, 2003–2008).1,12 In addition, all of the behavioral and most biological LS7 markers compared well to the general population. We found noteworthy differences in LS7s between men and women and between HCHS/SOL Hispanic/Latino heritage groups. High BMI among Hispanics/Latinos is a salient exception to the trend for more favorable LS7s relative to the general US population, and serves as a clear public health target for CVH promotion and improvement efforts. In addition, healthy cardiovascular diets eluded most Hispanics/Latinos in this study and culturally informed efforts for improving diet could serve as a means of reducing BMI and further improving Hispanic/Latino CVH. In a similar vein, we found that nearly two-thirds of Hispanics/Latinos met Ideal physical activity levels, which was 21% higher than the general US population. Although not the sole focus of this study, this finding merits further investigation given the important precursory role of physical activity in the development of many cardiovascular-related conditions. Furthermore, given the high levels of obesity among Hispanics/Latinos reported herein and in previous studies, a logical inference is that Hispanics/Latinos are inactive and interventions are needed to increase activity.4,13,14 Our findings indicate that inactivity is not a problem for all Hispanics/Latinos, and that some are more (or less) active than others, for example, nearly three-quarters of men but only one-half of women, suggesting that women should be targeted for intervention. We also found that older age was associated with lower Ideal physical activity, which may partially explain why Cuban-heritage persons, who were the oldest group, reported the lowest levels of Ideal physical activity. Clearly, physical activity plays a major role in unhealthy weight gain and higher BMI; however, our findings suggest that a nuanced understanding of Hispanic/Latino health behaviors may prove useful in guiding well-considered and culturally informed efforts to reduce obesity.10
Ideal smoking is simply not smoking, which was the status of more than three-quarters of Hispanics/Latinos; however, there were exceptions. Women were more likely than men to be nonsmokers. Puerto Rican background persons were the least likely to be nonsmoker (Ideal), and one-third were current smokers, regardless of sex. Current smoking was second highest among Cuban-origin persons and was notably higher among men compared with women. Most Dominican-origin men and women were nonsmokers (87%), and they had the highest level of Ideal smoking. More detailed smoking information among Hispanics/Latinos in HCHS/SOL can be found in Kaplan et al.15
Ideal BP in HCHS/SOL was comparable, if not slightly higher than previously reported nationally.12 This finding comes despite a recent HCHS/SOL report by Sorlie et al16 showing significant hypertension treatment and control deficits among Hispanics/Latinos, especially among the large number of Hispanic/Latinos without health care insurance coverage.17 Ideal BP was less common among men compared with women in HCHS/SOL. Mexican and South American groups had the highest rates of Ideal BP. Conversely, Dominican, Central American, Cuban, and Puerto Rican groups had the highest prevalence of the Poor BP criteria. Ideal fasting blood glucose levels in HCHS/SOL were notably higher than was reported previously in NHANES.1 Proportionally, women meeting the Ideal fasting blood glucose criterion far exceeded that of men. Unlike other LS7 indicators, there was relative consistency for Ideal fasting blood glucose across Hispanic/Latino groups.
Hispanic/Latino health is often inversely associated with more US acculturation.18 That is, the health of US-born and more acculturated Hispanics/Latinos reportedly is poorer than that of immigrants, particularly more recent immigrants.19 Herein we found that acculturation (ie, years of US residency) was not strongly related to differences in LS7s. There are several reasons why our findings are inconsistent with previous work. First, most previous health and acculturation work has focused exclusively on younger Mexican-origin groups, whereas in HCHS/SOL, we examined several heritage groups of different ages. This suggests that the “Hispanic health paradox” may not apply to all Hispanic/Latino groups.20 Second, there is emerging work suggesting that the Negative Acculturation hypothesis may not apply to the health of older Hispanics/Latinos over the life course.21 In addition, the Acculturation-Health hypothesis argues for a nonlinear relationship between health and acculturation such that longer US residency introduces health benefits from increased wealth and greater access to important resources, namely, health care.21 If indeed recent immigrants are healthier, then it is vitally important to US public health policy to understand how to mitigate any possible negative health effects of acculturation.
Last, we found that higher total LS7s scores were associated with a lower prevalence of both CHD and self-reported stroke/TIA. Although higher LS7s were associated with lower CHD for both men and women, LS7s were associated with lower odds of stroke for women only. This finding suggests that better LS7 profiles are, in principle, associated with lower CVD risk among Hispanics/Latinos, which is consistent with previous work among whites and Hispanics/Latinos.7,8,22,23 The sex differences we observed for stroke may have a biological basis, but may also relate to differences in stroke awareness and self-reporting bias that left insufficient statistical power to detect meaningful relationships. More objective longitudinal surveillance of CHD and stroke end points in HCHS/SOL should improve the precision of estimates for these 2 important outcomes.
There are several limitations readers should consider when evaluating our study results. First, HCHS/SOL sampling frames were designed to be representative of the 4 targeted metropolitan areas described above and are not nationally representative. Second, although we examined several important LS7 correlates (eg, sex and nativity), we did not conduct detailed modeling to delve more deeply into these relationships in this more global report. The reported associations between LS7 and CVD were cross sectional, and directionality or causality should not be inferred because we are unable to gauge whether Ideal LS7 preceded onset of CVD. In addition and in general for LS7 metrics, each component is weighted equally. It is likely that some individual components (eg, BP) may be more predictive of CVD events (eg, stroke) than others. Additional work to calibrate and potentially differentially weight LS7 components could help improve the precision of LS7 associations with CVD events and mortality and could inform disease prevention efforts.
Clinical implications
The AHA 2020 goals are to improve CVH and reduce CVD disease burden and mortality nationally. For these goals to be successfully attained, patients and their health care providers must collaborate to ensure that reasonable individual CVH goals are established. Our findings provide valuable information for clinicians and public health practitioners in understanding and appreciating the CVH differences (eg, low smoking rates among Dominicans) among diverse Hispanics/Latinos. For clinicians and public health practitioners, our study results provide detailed Hispanic/Latino group-specific targets for improving CVH for the patients and communities they serve.
Conclusion
Hispanic/Latino CVH LS7 metrics in HCHS/SOL compared favorably with previous US national estimates, with the clear exception of excess obesity. In general, women had more favorable LS7s compared with men; however, obesity among women was a clear exception. Puerto Rican heritage men and women smoking prevalences were similar and higher than national LS7 averages reported in NHANES.12 This HCHS/SOL report serves as a 2010 baseline for setting Hispanic/Latino public health priorities and monitoring future progress in reaching Goals for reducing cardiovascular morbidity and mortality by 20% by year 2020. Hispanics/Latinos will continue to exert major influences on overall US economics, society, and policies in coming decades. For the US to maintain its global position, it is vital that Hispanic/Latino CVH maintenance and improvement be close to the heart of US public health policies.
Supplementary Material
Acknowledgments
The authors thank the staff and participants of HCHS/SOL for their important contributions (investigators’ Web site: http://www.cscc.unc.edu/hchs/).
Funding
Drs González and Tarraf receive support from National Institute on Aging R01 48642 and received support from National Heart, Lung, and Blood Institute (NHLBI) N01-HC 65233. The Hispanic Community Health Study/Study of Hispanic/Latinos was carried out as a collaborative study supported by contracts from the NHLBI to the University of North Carolina (N01-HC65233), University of Miami (N01-HC65234), Albert Einstein College of Medicine (N01-HC65235), Northwestern University (N01-HC65236), and San Diego State University (N01-HC65237). The following institutes/centers/offices contribute to the HCHS/SOL through a transfer of funds to the NHLBI: National Institute on Minority Health and Health Disparities, National Institute on Deafness and Other Communication Disorders, National Institute of Dental and Craniofacial Research, National Institute of Diabetes and Digestive and Kidney Diseases, National Institute of Neurological Disorders and Stroke, National Institutes of Health (NIH) Institution-Office of Dietary Supplements.
Role of funding source
This work was supported by the NIH/NHLBI. Its contents are solely the responsibility of the authors and do not necessarily represent the official views of the NIH.
Appendix. Supplementary data
Supplementary data to this article can be found online at http://dx.doi.org/10.1016/j.ahj.2016.02.008.
Footnotes
Disclosures
The authors report no conflicts of interest that could inappropriately influence or be perceived to influence this work.
References
- 1.Lloyd-Jones DM, Hong Y, Labarthe D, et al. Defining and setting national goals for cardiovascular health promotion and disease reduction. Circulation. 2010;121(4):586–613. doi: 10.1161/CIRCULATIONAHA.109.192703. [DOI] [PubMed] [Google Scholar]
- 2.González HM, Vega WA, Williams DR, et al. Depression care in the United States: too little for too few. Arch Gen Psychiatry. 2010;67(1):37–46. doi: 10.1001/archgenpsychiatry.2009.168. [DOI] [PMC free article] [PubMed] [Google Scholar]
- 3.Miranda PY, Tarraf W, González P, et al. Breast cancer screening trends in the United States and ethnicity. Cancer Epidemiol Biomarkers Prev. 2012;21(2):351–7. doi: 10.1158/1055-9965.EPI-11-0873. [DOI] [PMC free article] [PubMed] [Google Scholar]
- 4.Daviglus ML, T GA, et al. Prevalence of major cardiovascular risk factors and cardiovascular diseases among Hispanic/Latino individuals of diverse backgrounds in the United States. JAMA. 2012;308(17):1775–84. doi: 10.1001/jama.2012.14517. [DOI] [PMC free article] [PubMed] [Google Scholar]
- 5.LaVange LM, Kalsbeek WD, Sorlie PD, et al. Sample design and cohort selection in the Hispanic Community Health Study/Study of Latinos. Ann Epidemiol. 2010;20(8):642–9. doi: 10.1016/j.annepidem.2010.05.006. [DOI] [PMC free article] [PubMed] [Google Scholar]
- 6.Sorlie PD, Aviles-Santa LM, Wassertheil-Smoller S, et al. Design and implementation of the Hispanic Community Health Study/Study of Latinos. Ann Epidemiol. 2010;20(8):629–41. doi: 10.1016/j.annepidem.2010.03.015. [DOI] [PMC free article] [PubMed] [Google Scholar]
- 7.Folsom AR, Yatsuya H, Nettleton JA, et al. Community prevalence of ideal cardiovascular health, by the American Heart Association definition, and relationship with cardiovascular disease incidence. J Am Coll Cardiol. 2011;57(16):1690–6. doi: 10.1016/j.jacc.2010.11.041. [DOI] [PMC free article] [PubMed] [Google Scholar]
- 8.Ogagarue ER, Lutsey PL, Klein R, et al. Association of ideal cardiovascular health metrics and retinal microvascular findings: the Atherosclerosis Riskin Communities Study. J Am Heart Assoc. 2013;2(6) doi: 10.1161/JAHA.113.000430. [DOI] [PMC free article] [PubMed] [Google Scholar]
- 9.Rasmussen-Torvik LJ, Shay CM, Abramson JG, et al. Ideal cardiovascular health is inversely associated with incident cancer: the Atherosclerosis Risk in Communities Study. Circulation. 2013;127(12):1270–5. doi: 10.1161/CIRCULATIONAHA.112.001183. [DOI] [PMC free article] [PubMed] [Google Scholar]
- 10.Arredondo EM, Sotres-Alvarez D, Stoutenberg M, Arredondo EM, Sotres-Alvarez D, Stoutenberg M, et al. Physical activity levels in U.S. Latino/Hispanic adults: results from the Hispanic Community Health Study/Study of Latinos. American Journal of Preventive Medicine. 2015 Epub ahead of print. [Google Scholar]
- 11.Rao JN, Scott AJ. On chi-squared tests for multiway contingency tables with cell proportions estimated from surveydata. Ann Stat. 1984:46–60. [Google Scholar]
- 12.Shay CM, Ning H, Allen NB, et al. Status of cardiovascular health in US adults: prevalence estimates from the National Health and Nutrition Examination Surveys (NHANES) 2003–2008. Circulation. 2012;125(1):45–56. doi: 10.1161/CIRCULATIONAHA.111.035733. [DOI] [PMC free article] [PubMed] [Google Scholar]
- 13.Flegal KM, Carroll MD, Kit BK, et al. Prevalence of obesity and trends in the distribution of body mass index among US adults, 1999–2010. JAMA. 2012;307(5):491–7. doi: 10.1001/jama.2012.39. [DOI] [PubMed] [Google Scholar]
- 14.Perez LG, Arredondo EM, Elder JP, et al. Evidence-based obesity treatment interventions for Latino adults in the U.S.: a systematic review. Am J Prev Med. 2013;44(5):550–60. doi: 10.1016/j.amepre.2013.01.016. [DOI] [PMC free article] [PubMed] [Google Scholar]
- 15.Kaplan RC, Bangdiwala SI, Barnhart JM, et al. Smoking among U.S. Hispanic/Latino adults: the Hispanic Community Health Study/Study of Latinos. Am J Prev Med. 2014;46(5):496–506. doi: 10.1016/j.amepre.2014.01.014. [DOI] [PMC free article] [PubMed] [Google Scholar]
- 16.Sorlie PD, Allison MA, Aviles-Santa ML, et al. Prevalence of hypertension, awareness, treatment, and control in the Hispanic Community Health Study/Study of Latinos. Am J Hypertens. 2014;27(6):793–800. doi: 10.1093/ajh/hpu003. [DOI] [PMC free article] [PubMed] [Google Scholar]
- 17.Foundation KF. Rate of nonelderly uninsured by race/ethnicity. U.S.: 2014. [Google Scholar]
- 18.Lara M, Gamboa C, Kahramanian MI, et al. Acculturation and Latino health in the United States: a review of the literature and its sociopolitical context. Annu Rev Public Health. 2005;26:367–97. doi: 10.1146/annurev.publhealth.26.021304.144615. [DOI] [PMC free article] [PubMed] [Google Scholar]
- 19.Abraido-Lanza AF, Chao MT, Florez KR. Do healthy behaviors decline with greater acculturation? Implications for the Latino mortality paradox. Soc Sci Med. 2005;61(6):1243–55. doi: 10.1016/j.socscimed.2005.01.016. [DOI] [PMC free article] [PubMed] [Google Scholar]
- 20.Markides KS, Coreil J. The health of Hispanics in the southwestern United States: an epidemiologic paradox. Public Health Rep. 1986;101(3):253–65. [PMC free article] [PubMed] [Google Scholar]
- 21.González HM, Ceballos M, Tarraf W, et al. The health of older Mexican Americans in the long run. Am J Public Health. 2009;10(99):1879–85. doi: 10.2105/AJPH.2008.133744. [DOI] [PMC free article] [PubMed] [Google Scholar]
- 22.Ford ES, Greenlund KJ, Hong Y. Ideal cardiovascular health and mortality from all causes and diseases of the circulatory system among adults in the United States/clinical perspective. Circulation. 2012;125(8):987–95. doi: 10.1161/CIRCULATIONAHA.111.049122. [DOI] [PMC free article] [PubMed] [Google Scholar]
- 23.Dong C, Rundek T, Wright CB, et al. Ideal cardiovascular health predicts lower risks of myocardial infarction, stroke, and vascular death across whites, blacks, and Hispanics: the Northern Manhattan Study. Circulation. 2012;125(24):2975–84. doi: 10.1161/CIRCULATIONAHA.111.081083. [DOI] [PMC free article] [PubMed] [Google Scholar]
Associated Data
This section collects any data citations, data availability statements, or supplementary materials included in this article.