Abstract
Effective physician workforce management requires that the various organizations comprising the House of Medicine be able to assess their current and future workforce supply. This information has direct relevance to funding of graduate medical education. We describe a dynamic modeling tool that examines how individual factors and practice variables can be used to measure and forecast the supply and demand for existing and new physician services. The system we describe, while built to analyze the pathologist workforce, is sufficiently broad and robust for use in any medical specialty. Our design provides a computer-based software model populated with data from surveys and best estimates by specialty experts about current and new activities in the scope of practice. The model describes the steps needed and data required for analysis of supply and demand. Our modeling tool allows educators and policy makers, in addition to physician specialty organizations, to assess how various factors may affect demand (and supply) of current and emerging services. Examples of factors evaluated include types of professional services (3 categories with 16 subcategories), service locations, elements related to the Patient Protection and Affordable Care Act, new technologies, aging population, and changing roles in capitated, value-based, and team-based systems of care. The model also helps identify where physicians in a given specialty will likely need to assume new roles, develop new expertise, and become more efficient in practice to accommodate new value-based payment models.
Keywords: pathologist, physician workforce supply and demand, software modeling tool
Introduction
A thorough understanding of physician workforce supply and demand is requisite for effectively managing and planning a nation’s health care. In the United States and elsewhere, physician workforce trajectories across specialties and subspecialties have been forecast at national and state levels (Table 1). Some analyses are elaborate, such as “The Complexities of Physician Supply and Demand: Projections Through 2025” published in 20083 and revised in 2015, 13 while others provide only baseline estimates, plotting one or a few scenarios.
Table 1.
Illustrative List of Studies Conducted on Physician Workforce.
| Authors | Study Year | Geography & State | Study Name | Organization | Scenarios |
|---|---|---|---|---|---|
| United States | |||||
| Erikson et al1 | 2007 | United States | Future Supply and Demand for Oncologists: Challenges to Assuring Access to Oncology Services (forecast until 2020) | ASCO | Multiple scenarios (9) |
| HRSA and The Lewin Group2 | 2008 | United States | The Physician Workforce: Projections and Research into Current Issues Affecting Supply and Demand | Health Resources & Svc Admin, US DHHS | Multiple scenarios (8) |
| Dill and Salsberg3 | 2008 | United States | The Complexities of Physician Supply and Demand: Projections Through 2025 | Center for Workforce Studies, AAMC | Multiple scenarios (>12) |
| Colwill et al4 | 2008 | United States | Will Generalist Physician Supply Meet Demands Of An Increasing And Aging Population? | U Missouri–Columbia | Multiple scenarios (4) |
| Forte and Armtrong5 | 2009 | New York | New York Physician Supply and Demand through 2030 | The Center for Healthcare Workforce Studies, School of Public Health, U Albany | Multiple scenarios (8) |
| Staiger et al6 | 2009 | United States | Comparison of Physician Workforce Estimates and Supply Projections | Grant from National Institute on Aging | Multiple scenarios (4) |
| Cribbs7 | 2010 | Virginia | Physician Forecasting in Virginia 2008 - 2030 | Healthcare Workforce Data Center, Virginia Dept Health Professions | Multiple scenarios |
| Petterson et al8 | 2012 | United States | Projecting US Primary Care Physician Workforce Needs: 2010-2025 | Agency for Healthcare Research and Quality | Multiple scenarios (3) |
| Withy et al9 | 2012 | Hawaii | Hawai’i Physician Workforce Assessment 2010 | U Hawai’i, HIS Global Insight | Multiple scenarios (3) |
| Dall et al10 | 2013 | United States | Supply and demand analysis of the current and future US neurology workforce | IHS Healthcare & Pharma; American Academy of Neurology and others | Multiple scenarios (6) |
| Robboy et al11 | 2013 | United States | Pathologist workforce in the United States: I. Development of a predictive model to examine factors influencing supply | College of American Pathologists | Base case only |
| Fraher12 | 2014 | United States | Model for US physician workforce: Need date | University of North Carolina at Chapel Hill | Multiple scenarios |
| Dall et al13 | 2015 | United States | The Complexities of Physician Supply and Demand: Projections Through 2025 | Center for Workforce Studies, AAMC | Multiple scenarios (>12) |
| Worldwide | |||||
| Basu and Gupta14 | 2005 | Canada | A physician demand and supply forecast model for Nova Scotia | Ministère de la Santé, Canada | Multiple scenarios |
| Scheffler et al15 | 2008 | Global | Forecasting the global shortage of physicians: an economic- and needs-based approach | U California, Berkeley, CA, WHO, London Business School | Multiple scenarios (3) |
| Koike et al16 | 2009 | Japan | Estimation of physician supply by specialty and the distribution impact of increasing female physicians in Japan | Health and Labour Sciences Research Grants | Base case only |
| Barber and Lopez-Valcarcel17 | 2010 | Spain | Forecasting the need for medical specialists in Spain: application of a system dynamics model | U Las Palmas de Gran Canaria, Campus Universitario de Tafira | Multiple scenarios |
| Yuji et al18 | 2012 | Japan | Forecasting Japan’s Physician Shortage in 2035 as the First Full-Fledged Aged Society | U Tokyo | Base case only |
| Tsai et al19 | 2012 | Global | Predicting the demand of physician workforce: an international model based on “crowd behaviors” | Grant from Health Department, Executive Yuan, Taiwan, ROC | Base case only |
| Health Workforce Australia20 | 2012 | Australia | Health Workforce 2025—Doctors, Nurses and Midwives—Volume 1 | Health Workforce Australia | Multiple scenarios (>10) |
| de Graaf-Ruizendaal and de Bakker21 | 2013 | Netherlands | Construction of decision tool to analyze local demand and local supply for GP care using a synthetic estimation model | Dept Health, Welfare and Sport in the Netherlands | Base case only |
| Suphanchaimat et al22 | 2013 | Thailand | Projecting Thailand physician supplies between 2012 and 2030: application of cohort approaches | Ministry of Public Health | Base case only |
| Santric-Milicevic et al23 | 2013 | Serbia | Physician and nurse supply in Serbia using time-series data | U Belgrade | Base case only |
Abbreviations: AAMC, Association of American Medical Colleges; ASCO, American Society of Clinical Oncology; US DHHS, US Department of Health and Human Services; WHO, World Health Organization.
These studies may be useful at a high level for policy makers but in general incompletely address important issues at the specialty level where decisions must be made about how to implement change and allocate resources to manage the changes. Identified deficiencies are:
Availability of modeling tools for medical specialty use: Most studies on workforce which survey a state or nation emanate from stakeholders such as state or national agencies of health (eg, the US Department of Health and Human Services, the Dutch Department of Health, Welfare and Sport, etc), industry associations (eg, Association of American Medical Colleges [AAMC], American Society of Clinical Oncology, etc) and universities (eg, University of Missouri, State University of New York at Albany, University of Tokyo, etc). These organizations gather information used to develop estimates by other agencies (physician associations, eg, American Medical Association [AMA], US Census Bureau, US Centers for Diseases Control, etc), and these estimates then form the basis for reports and board modeling. The physician organizations depend on these published reports, but the lack of granularity hinders the groups from proactively managing their own future workforce. Rarely are the individual physician organizations able to utilize the published studies to plot their own scenarios for types of future demand, which is important because the individual associations are often the most aligned to the market dynamics that impact their specialty.
Effort analytics of workforce supply and demand: Most models report physician supply and demand in aggregate. Few dig deeper to understand how physicians allocate their time. With the emergence of value-based care and payment models such as Accountable Care Organizations, physician organizations have an immediate need to understand what their providers do and their beneficiaries receive. Physicians wear multiple hats (care provider, educator, administrator, investigator, etc). We believe there is a critical and underserved need for physician workforce models that permit assessments at such granular levels.
Ability to test multiple scenarios and alter “what if” conditions and variables: Most workforce studies incorporate only a limited set of scenarios, rarely more than 5. These scenarios are defined prior to conducting the analysis so do not incorporate information about new models of practice collected from the field. This limits the relevance of the modeling to our rapidly changing health care environment. These models also lack flexibility where the user can identify and alter single variables to determine levels of demand or gaps between supply and demand.
The scenario-based workforce analysis tool we present is an interactive model that permits the user the ability to incorporate a wide range of user-defined parameters for modeling future needs and scenarios, and the ability to adapt the model to new information such as expanded scope of practice or clinical care scenarios. We have reported supply11 and demand24 for the specialty of pathology using this model. This report describes the interactive model itself and its methodological origins.
Methods
Introduction to the Scenario-Based Workforce Analysis Tool
Our tool’s origin lies in the multiyear transformation initiative (called the Case-for-Change, now known as “Capability and Society Advancement”) undertaken by the College of American Pathologists (CAP, or College).25 The initiative focused on developing an in-depth understanding of the current workforce and its practice models, identifying new and emerging market forces (political, economic, commercial, and technology related), and ascertaining and measuring the impact these forces have on the workforce and pathology practice models. The goal was to identify existing and new services as well as emerging technologies in which pathologists might play critical roles in the future.
Scenarios
A scenario refers to independent variables (such as change in residency slots for a specialty or adoption rate for a new technology) that affect the numbers of a dependent population (for example, supply or demand of healthcare professional in that specialty), frequently defined in futuristic sense. Scenario analysis permits charting various paths that independent variables can take and their consequent impact on the dependent variables. While scenario analysis does not reduce the level of uncertainty associated with the market forces, it allows stakeholders to better assess the effects of the most and least likely future events.
New services
The practice of pathology (and many other specialties) is evolving due to changes brought about by dynamic market forces, changing practice models, and new technologies. In pathology, there is growing demand for new services (eg, genetic testing, in vivo microscopy, and clinical informatics) not associated with the traditional role or expertise of most practicing pathologists.
Supply Model Section
Our inventory-based model of supply rests on full-time equivalent (FTE) values where actual physician numbers are converted into FTEs based on the average hours in a week that a particular type of physician works. The model estimates workforce by determining the current supply and then adds or subtracts net annual increases or decreases, respectively. The model also partially incorporates complementary workforces (pathologist assistants [PAs] and PhDs working in the laboratory). The key determinants are:
Current Supply (Base Year): The modeling process starts by calculating the pool of active pathologists, stratified by age and gender. It includes all actively practicing pathologists, whether board certified or not, across all practice settings (ie, hospital-based laboratories, independent laboratories, research, academia, industry, etc). The definition of “active” excludes pathologists who have retired or are trainees in residency or fellowship programs. These data largely come from the AMA Masterfile or specialty associations. A key challenge in this step includes ascertaining the accurate count of pathologists who are board certified and estimation of those who are not. Also, we needed to understand what portion of the pathologist workforce is composed of board-certified clinicians, typically hematologists and internists, who are certified by their respective clinical Boards but not by the American Board of Pathology. Comparison of state registration declarations against the specialty boards’ records usually resolves this issue. In our model, we treated internists who were also board certified by the American Board of Pathology as if they were full-time pathologists, even though we were unable to determine what percentage of their efforts might be devoted to truly clinical practices.11,24 Slightly differently, we treated only dermatopathologists who were also board certified in general pathology by the American Board of Pathology as full-time pathologists, as many dermatologists who take their dermatopathology boards continue to devote substantial efforts to their clinical practices or examine specimens largely from their own practices.
Additions to Workforce: This step aims at estimating annual net addition to workforce. “Net additions” include trainees who completed their residency or fellowship in the United States or abroad and subsequently enter the practice of pathology in the United States. Medical school graduates entering residency include those from US allopathic medical schools, osteopathic medical schools, and international medical schools. These data came from the Accreditation Council for Graduate Medical Education and the National Resident Matching Program. Important considerations included determination of (1) trainees joining the workforce (net of dropouts and those seeking additional training) and (2) current gender composition.
-
Separations from the workforce: Separation results largely from retirement and mortality. Less common reasons include change in specialty, permanent emigration, and temporary emigration of trainees completing their residency training in the United States, who are then required to return to their home country for a minimum of 2 years owing to immigration rules.
Mortality: The mortality rate data for US physicians came from the Census Bureau or physician associations. The mortality rate for a particular age-group usually changes little over the years and can be considered to remain constant over the forecasting period.
Retirement: For some specialties, specific data are not available from public domain sources. Specialty-specific surveys can be performed or information about overall physician levels from published reports can be used. We surveyed active pathologists who provided information on their intended ages of retirement for part-time and full-time retirement, which we then stratified by respondents’ ages. The planned ages of retirement proved to differ from the actual ages of retirement increasingly in the younger decades as documented by Association of AAMC’s study and made adjustments accordingly.3
Emigration: Many international medical graduates (IMGs) leave after completing their residency training, usually due to visa requirements. “J” visa émigrés are eligible to reapply for return after 2 years abroad, but the number that returns is uncertain. Other IMGs leave later on a voluntary basis, seeking job opportunities elsewhere. Extensive information on net emigration is rarely available due to difficulty in tracking individual candidates and that sourced from the published literature is of uncertain quality.26 We have assumed a constant rate of emigration for all future years.
Residents Taking Up Nonmedical Professions: In addition to residents who change specialties, some leave the medical profession entirely after completing their training. The percentage is sourced from the FREIDA database.27
Full-Time Equivalent Conversion: The model uses the concept of the “physician FTE” which is defined as a physician working the average number of hours a full-time physician works. For pathologists, our FTE calculations compute the count of FTEs of active pathologists, based on the work hour variations in the workforce across age-groups and gender. (Note: FTE is a fixed number but to calculate it requires a count of all individuals, further refined by assessing each cohort’s average hours divided by the number of individuals in the cohort.)
- Extender Workforce: The extender workforce can be estimated by identifying the supply of advanced care practitioners who support a specialty in its work, adjusted to relative productivity. In case of pathologists, we focused on estimating the supply of PAs. The key steps were:
- Estimating Total Current Pool11: We considered the total count of active PAs to include those certified by the American Society of Clinical Pathology (ASCP) Board of Certification (formerly, the ASCP Board of Registry) and those who are not certified. From our surveys, opinions of team members, and interviews with executives of the American Association of Pathology Assistants and others, we found that the definition of PAs include both certified and noncertified PAs. We obtained the number of certified PAs from ASCP. For noncertified PAs, we estimated the count through an indirect survey-based approach. We asked pathologists to provide the number of pathologists and PAs working in their respective practice settings and calculated an average industry-level pathologist to PA ratio, which was prorated to the current pathologist supply.
- Conversion of Physician Extender Headcount to FTE Pathologists: The PAs do not substitute for pathologists completely but can be viewed as performing, under supervision, a portion of FTE work that a pathologist might otherwise perform, predominantly in autopsy and surgical pathology gross dissection. For PAs, we estimated relative productivity by conducting a survey of pathology practice managers asking the following: (1) number of PAs employed in their particular setting and (2) number of pathologists required to replace the work effort performed by these PAs. From this total, we then calculated the required replacement factor. Noting that PAs also perform work that pathologists would not normally perform, only a portion of the PA effort counts as equivalent to a portion of Pathologist FTE.
- Growth in Physician Extender Numbers: While both certified and noncertified PA extenders add to the extender workforce, due to regulatory changes, we have not projected additions to the noncertified pool, although some are undoubtedly added annually. For the certified workforce, we used statistics on certified PAs added annually to the workforce provided by the industry association.
Demand Model Section
In contrast to “supply,” which looks at the numbers of physicians in practice, and how this physician population changes related to individuals entering and leaving the field, “demand” examines what physicians do, that is, what is requested of them. Demand looks at how physicians spend their time across services types and service locations and anticipates new services in their infancy and anticipated growth. It allows for testing of work scenarios with high impact variables and their comparison with others.
Compared to supply estimation, demand analysis is much more complex. Our framework for demand looks at deviations from an assumed present equilibrium between US physician supply and per capita physician demand. Forecasting future demand requires knowledge of many factors, including the change in overall US population, age and gender mix, mix and intensity of existing and new services, insurance coverage mix, change in disease incidence as well as changes in clinical practice patterns.
In this article, we outline demand principles that apply to all specialties. When making estimates for a particular physician specialty, other specialty-specific factors may need to be considered as well. To understand the detailed methodology used in estimating the pathologist workforce, please see Robboy et al.24
Population mix: The increase in population across age and gender cohorts directly affects the demand for physician services. Population projections are available through the year 2060 across age-groups, gender, and insurance providers. These projections use US Census data sets adjusted for net international migration. In this manuscript, the numerical value used for each variable represents what we believe to be the “most likely” net migration values. This data set is also called “the middle value.” Sometimes ranges for net migration are given above or below (high and low values).
Insurance mix: The different insurance cohorts (government-sponsored Medicare and Medicaid), employer-sponsored private insurance, and individually purchased private insurance consume physician services differently.24 Our model adjusts for differences in utilization and the projected change in the insurance mix (provided by the Centers for Medicare and Medicaid Services).
Disease incidence: Changes in disease incidence or degrees of illness can be important drivers of change in demand for types of physician services. For example, in the past, the introduction of the polio vaccine eliminated the iron lung specialty. Today, nurse practitioners and other physician extenders are increasingly managing chronic care geriatric medicine that physicians largely performed in prior years.
Level of services utilized: No published sources explicitly stratify how various patient profiles differentially utilize physician services, but such data can be estimated through the National Ambulatory Medical Care Survey and the National Hospital Ambulatory Medical Care Survey. The samples provide data on patient demographics, waiting time, medication therapy, procedures, payment sources, and so on from a national sample of hospital outpatient departments. To assess pathologist demand, we chose as our proxy, findings about biopsy utilization rates and complete blood count (CBC) ordering rates.
Other demands (administrative and other services): Physicians provide a range of services to patients directly and indirectly. Some relate more closely to the service location. The demand for research and teaching services, for example, largely mirrors the service location (academic medical center). The total effort devoted to both teaching and research relates more to the number of programs at such centers than to the trainee numbers within the programs. Based on historical numbers of residency and fellowship programs in the United States and anticipated new program startups, demand can be projected.
Gap Analysis (and Market Force Modules)
New market forces continually emerge that impact demand/supply beyond the above-mentioned variables. For example, the advent of genetic analysis of somatic tissues for cancer and germline testing for heritable conditions is currently expanding greatly the scope of services pathologists provide. These include technological development, laboratory performance, and quality control appropriate to the new services, and diagnostic and patient care consultations in the ever-increasing complexity and scope of genomic pathology. The concept of genomic medicine as a new area of endeavor extends to many specialties. As this new field develops, each specialty will need to determine and better understand how genomic medicine and other emerging areas will affect their field. Our model allows such new science and other new technologies to be evaluated and quantified as to their impact on physician supply and demand. This article examines genomic pathology and several other new areas, each in their turn.
Results
Overview
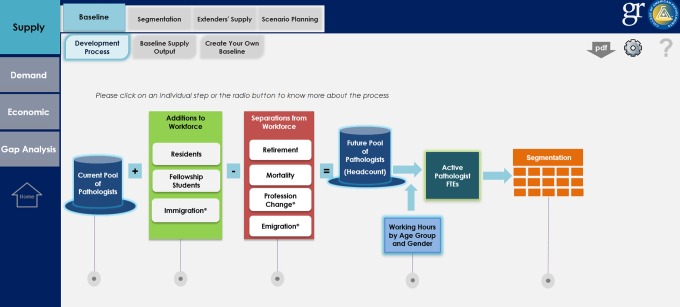
The model permits the user to work in Supply, Demand, Economic or Gap Analysis modules, and within each, for example, supply deeper levels of choice (Figure 1). Each figure is a screen with which a user interacts in the modeling program.
Figure 1.
Initial screen overview. The left-hand margin discloses 4 major modules. The upper margin (for choice selected as Supply) displays subblock Baseline and secondary subblock Development Process. The associated screen discloses the methodology for determining supply.
Supply Model Features
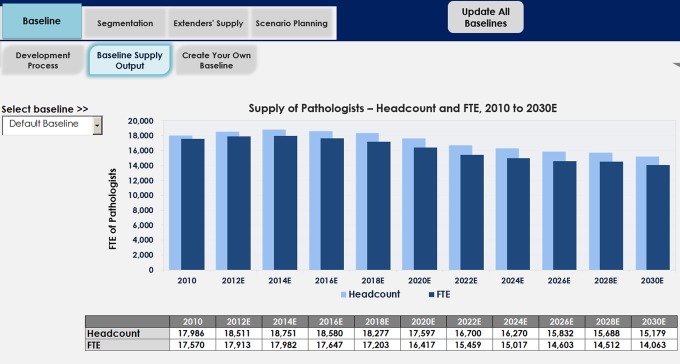
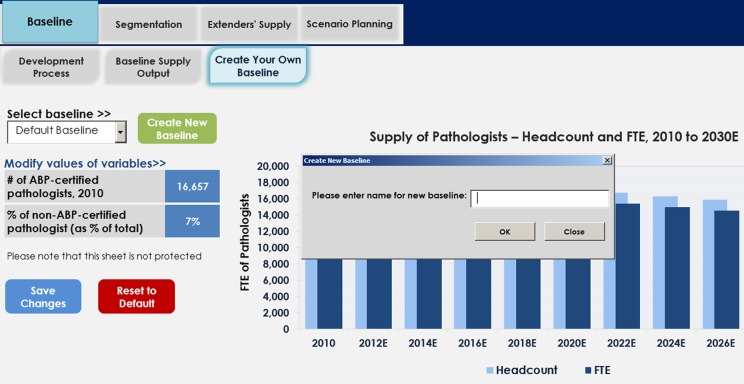
Baseline Supply: Physician supply is shown at aggregate levels, with numbers presented both as absolute headcounts and or recalculated into FTEs (Figure 2). The FTE count adjusts for physicians working part time. It also permits the user to make adjustments to the workforce. For example, the baseline can be further refined by the percentage of physicians serving as pathologists who are either practicing as pathologists but not boarded in pathology or clinicians (eg, hematologists) who may be board certified in internal medicine but not in pathology (Figure 3).
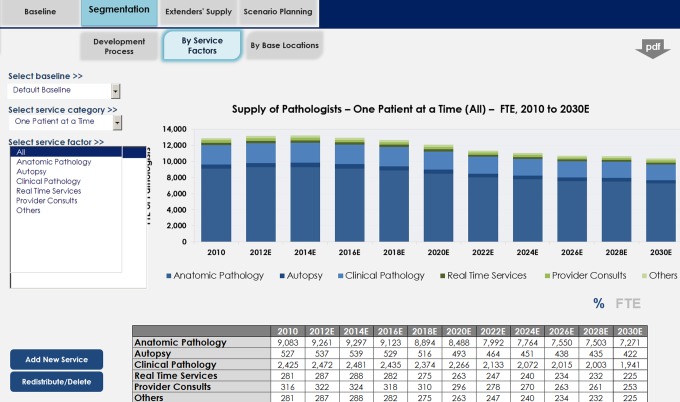
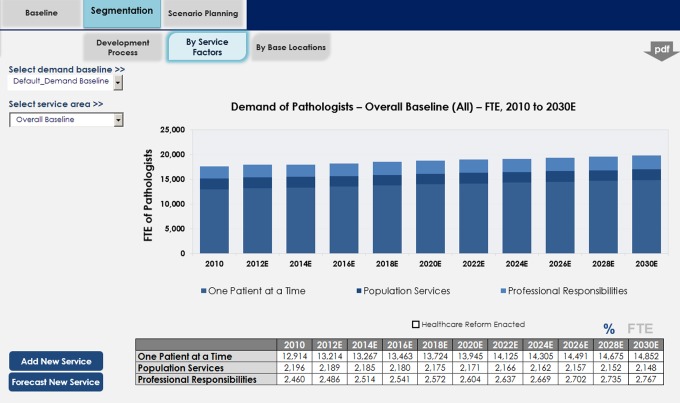
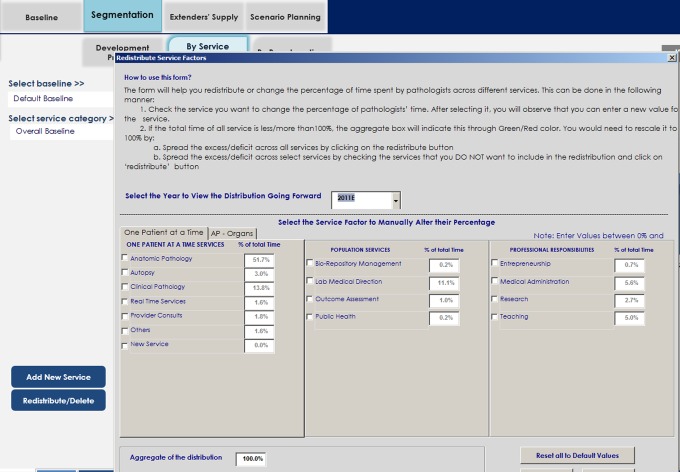
Segmentation of Supply (Table 2): This section addresses the important but rarely addressed understanding of the multiple services physicians provide in different locations (eg, hospital, clinic, industry, etc). Over the course of a career, moreover, many physicians also take on additional roles beyond their immediate categorical or subspecialty clinical certification. Commonly, these relate to seniority or experience (consultant to junior colleagues), and frequently they are administrative (committee service). The CAP workforce team segmented the supply (and therefore demand) into 16 services across 3 broad categories: One patient at a time, population services, and professional responsibilities (Figure 4). Several categories, for example, anatomic pathology, were further segmented into multiple subspecialties, for example, breast pathology, gastrointestinal pathology, and so on (Figure 5). As health care evolves, new services will likely emerge that will require entirely new areas of pathologist expertise, for example, molecular diagnostics and in vivo microscopy. New services can be added, including defining their supply (see “advanced features” subsequently).
Extender’s Supply: The tab “Extender’s Supply” enumerates the supply of advanced clinical practitioners who serve as physician extenders (Figure 6) and can also be segregated by service locations.
- Supply Scenario Planning and Comparison: When analyzing physician workforce, some variables invariably are desired that previously have not been programmed. Our modeling tool permits creation of new user-defined scenarios within the supply, demand, and gap analysis sections. It also permits comparing the effects of differing variables.
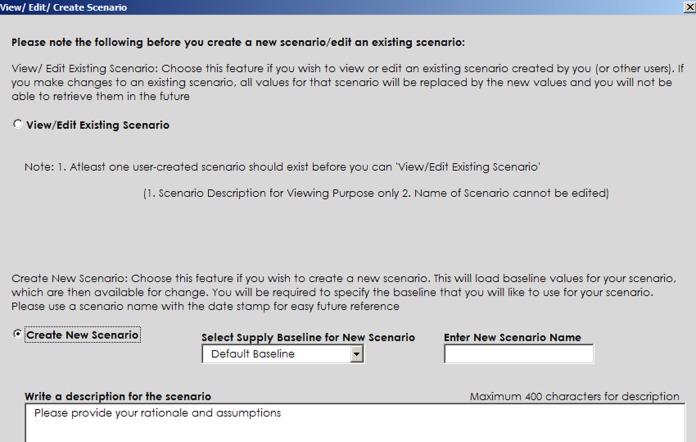
- Scenario Creation: Involves creating a new scenario or editing an existing one (Figure 7).
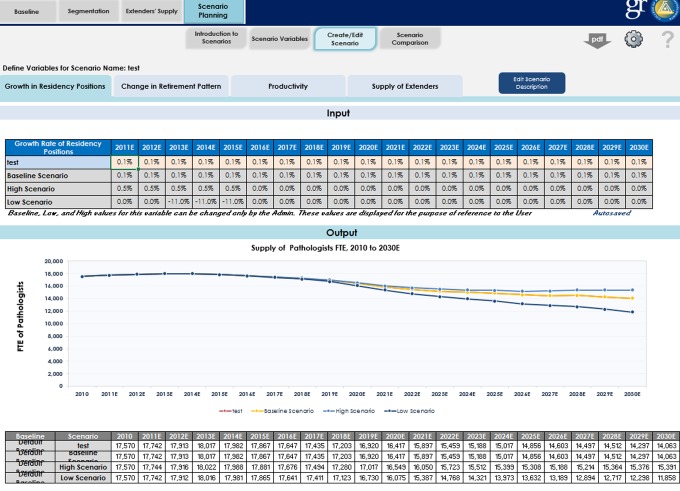
- Scenario Development: Once a new scenario has been created, a screen specific for the scenario variables can be updated at will. Underlying reasons/rationale can be documented and saved in the model (Figure 8).
- Scenario Comparison: Scenarios can be compared at aggregate levels, at service area levels, and at practice locations levels (Figure 9).
Figure 2.
Pathologists as Headcount and full-time equivalents (FTEs).
Figure 3.
Creating a user-defined baseline, assigning a name, or altering the percentage of nonboarded pathologists or clinicians serving in pathologist roles.
Table 2.
Taxonomy and Examples of Pathologist Services.*
| One Patient At A Time | Individual patients—each item includes all techniques for developing a diagnosis (eg, light microscopy and in vivo microscopy) and subsequent testing (eg, molecular, genetic, and immunohistochemistry) |
| Anatomic pathology (AP) and Surgical Pathology | Based on organ and system-based pathology, for example, breast, skin, GI, GU and gynecologic systems, pulmonary, blood and lymph nodes, etc and includes tumor board time as pathologist who rendered diagnosis. Institutions variably classify molecular/genomic pathology as AP or LM |
| Cytopathology | Gynecologic (cervical smears), body cavity fluids, fine needle aspiration (FNA) |
| Autopsy | General and forensic |
| Laboratory medicine (LM) | Microbiology, clinical chemistry, hematology, general laboratory, transfusion medicine (blood bank) |
| Genomic pathology | Genomic analysis of somatic (cancer) specimens, germline specimens, tissue human leukocyte antigen (HLA) typing, and infectious disease |
| Real-time services | Pathologist sees patient to perform FNA, bone marrow biopsy, in vivo microscopy |
| Provider consults | After rendering a diagnosis, time pathologist consults or speaks with clinician to discuss therapeutic implications, uses EHR for similar purposes, or attends tumor boards as an interested expert; acute care consultation |
| Population Services | Services groups of patients, communities but not the individual patient |
| Laboratory medical direction (LMD) | Relates to management and operation of laboratories, maintaining quality standards, policies, certifications, regulatory compliance, CAP inspections. |
| Outcome assessment/utilization management | Determines if tests performed are useful, need upgrading with new or different methodology, or should be expunged from the test menu offered; quality assurance studies; engaging other physicians to improve patient outcomes |
| Biorepository management | Oversees patient protection, tissue sample quality, clinical information quality, bioinformatics and logistics |
| Public health | Includes point-of-care (POC) management of chronic disease; ongoing wellness management, epidemiology |
| Clinical informatics | Collection, classification, manipulation, storage, retrieval and dissemination of information to solve problems in pathology in the care of patients |
| PROFESSIONAL RESPONSIBILITIES | To institutions, pathology, including the next generation of pathologists & self |
| Medical administration (nonoperational) | Professional activities associated with institutional committees (executive, strategic, and library committee) and to managerial and operational aspects of pathology laboratories on a broad level (eg, personnel and credentialing) |
| Teaching | Relates to residents, medical students, allied health &other physician groups |
| Research | Generally translational research, but includes basic science |
| Life-long learning activities, including that used to discharge LMD activities or improve patient care activities. | Maintenance of certification, compliance with federal and state regulations, journal reading |
| Professional Societal Obligation | Work in CAP committees, advocacy, participation in events, and leadership |
| Entrepreneurship (Practice management) | Running a practice, promoting practice, including client relationship building and management; developing new models of practice, and potentially disruptive start-ups/model expansions |
Abbreviation: CAP, College of American Pathologists.
*Adapted from Robboy et al.24
Figure 4.
Distribution of pathologist full-time equivalents (FTEs) into 3 major service areas (1 patient at a time, population services, and professional responsibilities).
Figure 5.
Distribution of pathologist full-time equivalents (FTEs) in individual subspecialty service areas comprising the overarching category “One patient at a time.”
Figure 6.
Supply of extender workforce (pathologists’ assistants) with option to segment by service areas and practice locations.
Figure 7.
Creating a new scenario.
Figure 8.
Documenting assumptions.
Figure 9.
Cells changeable to create a new scenario, edit an existing scenario, or compare variables.
Demand Model Features
Baseline Demand: The baseline demand subsection, which works similarly to the supply section, offers an overview of physician demand at aggregate levels (Figure 10), including at the most likely (middle) level and at high and low ranges.
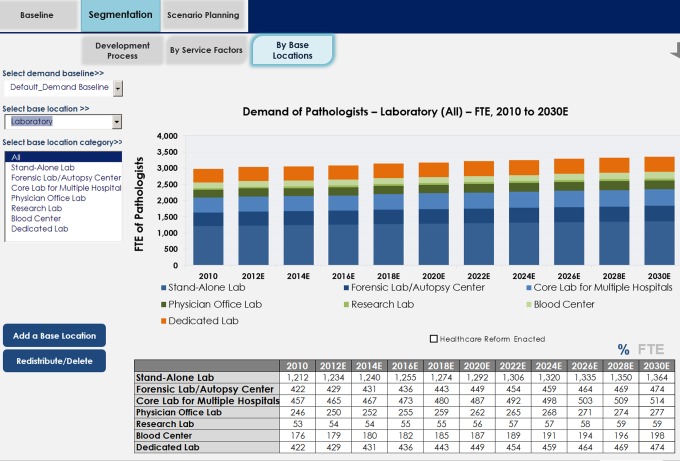
Segmentation of Demand: Segmentation permits viewing demand of physician services across service areas and practice locations (Figure 11). In addition, users can create new services that are likely to be demanded in the future. This process resembles that outlined under supply.
Scenario Planning: This tool allows scenario creation by permitting values of variables that impact demand to be altered. Some such variables include disease incidence rates, rates of insurance across population groups (higher rate of consumption by population cohort with insurance coverage vs the ones without it), changes in size of population groups, and their utilization of physician services (eg, increased demand for obstetrical services if the population trends toward more females in child-bearing age). For manageability, the ability to change some variables was restricted.
Figure 10.
Baseline demand, overall, which can be segmented by high- to low-level aggregates of service lines.
Figure 11.
Demand, presegmented by high-level groupings service lines, further segmented by more detailed service lines.
Gap Analysis (and Market Force Modules)
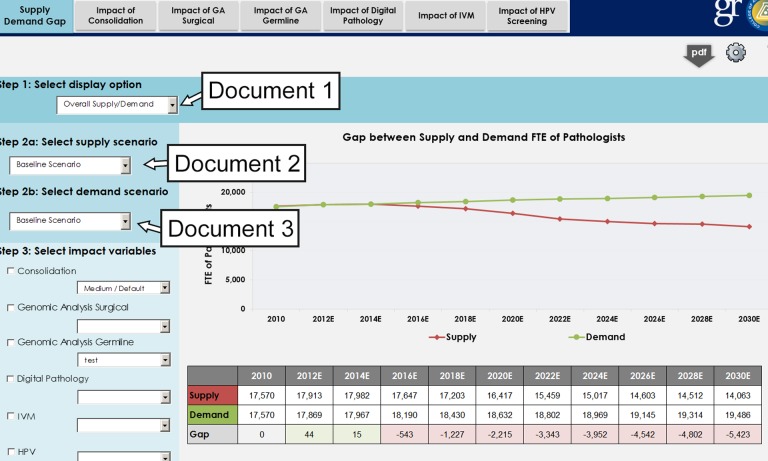
Gap analysis allows for comparison of physician supply and demand and overlay various market forces for numerous variables. A single screen enables users to both define and compare demand and supply FTE gaps across 3 dimensions (Figure 12) including aggregate or service factor or service location level (dimension 1), across scenarios developed in supply and demand blocks (dimension 2), across market force modules (and their in-built scenarios; dimension 3).
Figure 12.
Three dimensions of data selection for gap analysis, using overall supply and demand as an example.
Gap Analysis of Service Areas, Adding New Service Areas, or Changing Mix of Service Areas
Advances in technology and identification of new diseases continually introduce new services or new ways of performing those services. An obvious example in pathology is genomic medicine, requiring either new skill sets by existing pathologists and/or a new pathologist workforce capable of practicing in this area. An example in the surgical field, not explored here, is the introduction of robotic surgery (surgical arms), requiring surgeons in an increasing number of surgical subspecialties to add a new skill to adopt this new method of providing their existing scope of practice. Our model permits users to add additional new services.
The workforce implication of genomic medicine, as an example of gap analysis, is explored subsequently in detail, specifically for performing DNA analysis of tumor specimens. The field is rapidly changing. This example shows how gene analysis is rapidly undergoing change as the “next-generation sequencing” technology advances (from large panel, to exome, to genome analyses). We describe the impact this has on the physician effort as the testing transitions from the research laboratory (circa 2010) into accepted daily clinical use.
The analytic steps required to track the process were:
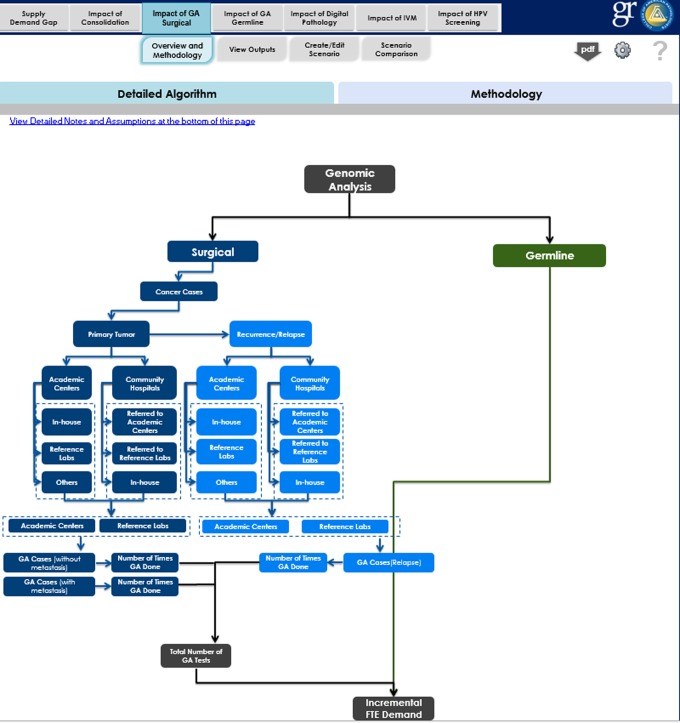
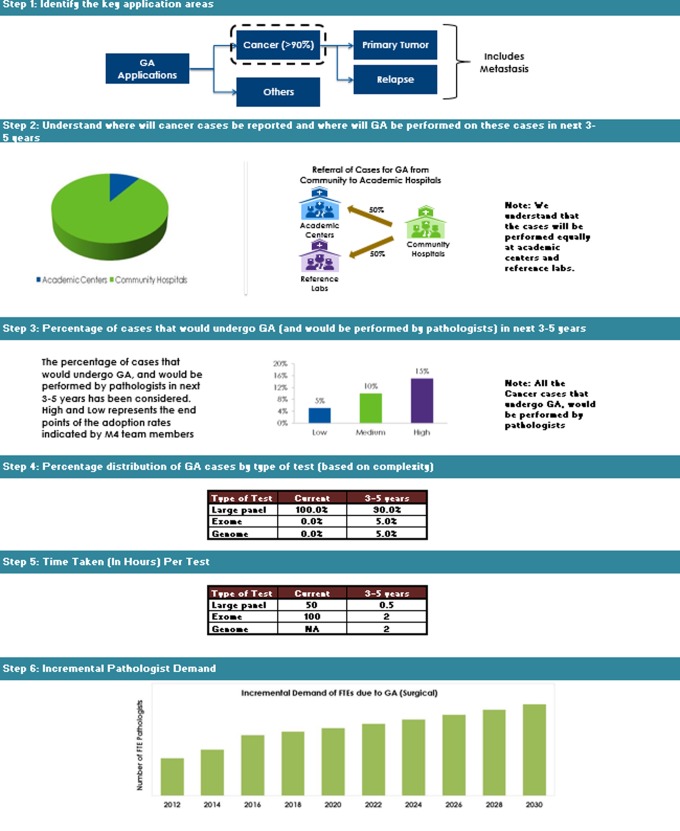
algorithm (Figure 13) and methodology (Figure 14) preparation when adding a new service13;
initiate addition of new service in the segmentation section of supply/demand model;
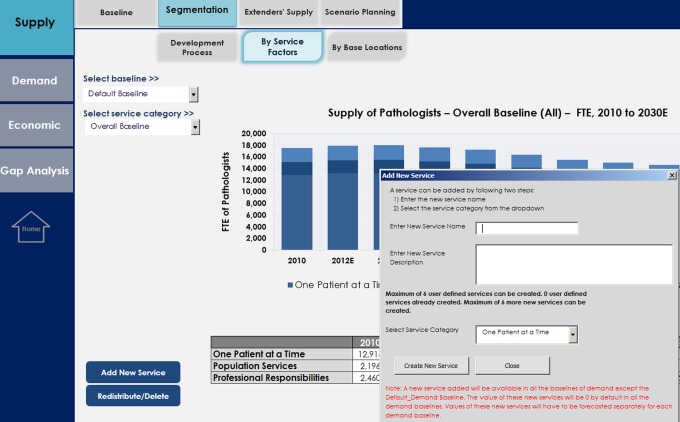
complete new screen prompts for name of service with short textual description of service (done via supply module; Figure 15);
replace default assigned null values with appropriate estimates (use “Distribute Supply” functionality, see Figure 16) because the new service may also reduce or replace other services; and
assign the overall share of the physician time (%) to a new service (Figure 17).
Figure 13.
Algorithm for genomic analysis of tissues, usually for cancer.
Figure 14.
Methodology to perform genomic analysis of tissue specimens, usually for cancer.
Figure 15.
Adding new service and providing basic details (name, category, etc).
Figure 16.
Assigning pathologist time involved in each of types of analytic tests (large panel analysis, exome analysis, and genome analysis for each of year when technology is rapidly changing). Seven key variables need scoring for realistic forecasts.
Figure 17.
Assigning overall share of physician time (%) to a new service.
Economics
The economics section has particular policy implications. The data on average payments for various physician services when coupled with the supply and demand FTEs data from the other 2 blocks of the tool afford a powerful assessment of the total value of services that will be demanded. It also shows how much of that valuation the physician specialty may garner and also what portion will not be realized should the supply be lacking.
Note on user tools
We have built several tools for both user and administrator use, including (1) version log (of any changes in structure or assumptions of analysis); (2) help tool; (3) methodology tool to understand how a particular demand was calculated; and (4) a PDF feature to download the current screen on a user’s desktop.
Discussion
Prediction is difficult, especially when it’s about the future, as attributed to such diverse persons as the New York Yankee baseball player and manager, Yogi Berra, and Nobel prize physicist, Niels Bohr. Prediction about the physician workforce is no exception. Modeling tools are helpful in examining the current status, the availability of goods or manpower, and the demands placed upon the system, in turn permitting projections by asking what would happen as conditions change.
In an ambitious program begun by the CAP (or College) nearly 5 years ago, we sought to develop an in-depth understanding of the current workforce and practice modes, identify new and emerging market forces (political, economic, commercial, and technology related), and ascertain and measure the impact these forces might have on pathology practice models and workforce. The goal was to identify existing and new services as well as emerging technologies where pathologists might play critical roles in the future.
We used this to examine both the supply11 and the demand24 trajectories of the pathologist workforce through the year 2030. This manuscript presents the details of the modeling methodology and makes the modeling process available to a broader group of stakeholders in the medical industry.
Strengths
Our modeling tool, while specific for the discipline of pathology, was built to be generalizable to any specialty in medicine with only minor modifications. From a high-level point of view, our focus was on a user such as a medical organization trying to determine its specialty’s future rather than on a public policy assessment of health care needs for the nation as a whole. The model also partially incorporates data about associated physician extenders (in our case, pathologists’ assistants) and close associates (such as clinical PhDs who are key in some laboratory operations, and nonpathologist physicians who may direct some subspecialty clinical laboratories). Besides other named specialties, we envisaged that this model could assess service lines crossing practices. An example is oncology, where different specialties and professionals work as an integrated clinical service (oncologist, surgeon or nurse practitioner who see the patients, specialists such as the radiologist, pathologist, or radiation therapist), and all provider groups can be included.
This model, by encouraging pathology to develop a robust taxonomy, describes broadly and at a granular level what these providers do and where. Thus, pathologists deliver direct patient care (diagnostic “one patient at a time”), supervise quality laboratory testing for patient populations (laboratory medical direction—“population services”), and engage in other professional services (research, teaching, and medical administration—“professional responsibilities”). The model details where the work is done, for example, in an academic medical center, or multiple types of hospitals, specialized facilities, or core facilities spanning multiple institutions. By broadly framing an all-encompassing taxonomy, refinements can be introduced easily, as new meaningful data become available. As the emerging trend today is for pathologists to practice as subspecialists, our model can easily be refined to enumerate the many smaller groupings not currently specified. Anatomic pathology, for which we have data and forecasts for the major subspecialties, can be expanded readily to include the numerous smaller subspecialties. Laboratory medicine, also, can be further segmented by work areas to allow analysis of chemistry, microbiology, genomic medicine, and blood bank and transfusion medicine, and so on. Any other specialty wishing to employ our model would first need to develop its own specialty-specific detailed taxonomy.
Over time, every job function may become archaic. Ideally, all specialties should render archaic activities obsolete, before someone else does. Any modeling tool required the capability to record and even forecast such change, such as what our model has done to identify the manpower needs for the emerging practice area of genomic medicine. Through a detailed but flexible taxonomy and gap analysis functionality, the impact of new as well as fading areas can be measured and indeed forecast, which is certainly useful for planning fellowship programs and future practitioner numbers.
The model has been built so that parameters can be evaluated at settings with 3 levels of likelihood (high, low, and middle) or by values considered the most likely. As demographic data such as census data, mortality, retirement, and so on change, the modeling system permits updating of such external governmental tables without the need for programmer assistance. Other important features are that gap analyses can be performed that can forecast differences (“gaps”) between the anticipated supply and demand and that entirely new areas of practice (be it a specialty or new field based on new technology) can be built into the working model by the end user. This model allows for testing of assumptions where supply and especially demand can be assessed across many specific areas. The model is flexible and allows “what if” queries. Specifically, the user may manually alter key parameters, thereby assessing the effects of projected or hypothetical changes.
A final strength of this work lies in the ability to quantitatively model some effects that may result from changes coming in American medicine. As one example, we looked at certain disruptive alterations likely to ensue as consequences, whether desirable or not, of American health care reform. In pathology, system consolidation is forcing some smaller laboratories to close or combine. We were able to model what the effect would be if 1% of laboratories closed each year, starting in 2014, or if the laboratory medical direction stayed stable, or increased 1% or 2% biennially due to new regulations. We also began work to estimate the impact that introducing molecular human papillomavirus (HPV) testing and anti-HPV vaccines might have on medicine during the next half decade. Due to the difficulty collecting sufficient data in these nascent areas of endeavor and the controversies that ensued in interpreting the data we did collect, these types of efforts never made it to the final model. We believe that future versions of our model will further explore these areas.
Limitations
The very process of identifying so many variables in a modeling tool reveals potential shortcomings, and this project was no exception. Currently, the data for our model is national in scope. We have not attempted modeling at the state level. The model also inadequately accounts for the pathology services performed by nonpathologist physicians. For example, some dermatologists whom the American Board of Pathology has certified to practice dermatopathology split their efforts between their pathology and clinical services. This is true also for some internists, especially hematologists, only some of whom are coboarded by the American Board of Pathology.
Our work also points up the inadequately reliable public data about pathologists, which is likely true for many other specialties constituting the House of Medicine. Most data about pathologists currently comes from group practices typical of universities or private practices, whether large and small. However, data to analyze efforts by service location are inadequate. We have limited data about pathologist supply and demand for independent commercial labs and little data about pathologist activities in research organizations or the biopharmaceutical industry. In addition, for some variables, we have estimated that physician work effort will change little in the coming years, for example, transfusion medicine but may be in error in assuming that past evidence of stability translates into future stability in such variables. This will be true for any specialty performing workforce modeling.28
Our study lacked a detailed database, either qualitative or quantitative, on where tests were actually performed (service location). For example, great variability exists in community hospitals as to what percentage of laboratory medicine testing is performed inhouse and what is performed in an outside reference or commercial laboratory. And in each instance, how does the effort of the pathologists within the hospital segregate to oversight of performance, laboratory medical direction, working with other clinicians, and providing direct services to patients. So while we could model the overall trajectory of the pathologist workforce supply and demand, there was little insight into how changes in demand might later affect where and how pathologists might be practicing.
There is value to determine how reducing the cost of health care might affect provider demand. To do so, we must anticipate the innovations and disruptions that will drive reducing costs, such as by shifting some of today’s physician tasks to nonphysician staff25 or shifting greater amounts of health care to the ambulatory setting. To do so in pathology, we need better to integrate what physician assistants and nonphysician doctoral scientists do. For example in pathology, some PA effort substitutes directly for pathologist effort but much does not. Without PAs, certain services would likely go undone, for example, tissue preparation for biorepository use and specimen photography. We are uncertain how PA efforts differ quantitatively between academic medical centers and community hospitals, for example, in grossing specimens for subsequent microscopic examination, which limits our understanding of the potential PA role if the anticipated decrease in pathologist numbers materializes. Both PAs and nonphysician doctoral scientists bring distinct skills that need integration into a more holistic view of laboratory workforce demand. We anticipate analogous issues across all specialties. Clearly, as more comprehensive data are collected about pathology assistants and PhD clinical scientists, their efforts will be integrated more fully into future pathology workforce analyses.
Final limitations in this first software version are technical in nature. Our modeling tool is available only offline, although multiple users can access it through a shared network. Also, this modeling version supports the addition of a maximum of up to six new services, although this could readily be increased.
Summary
We have developed and described the functions of a model and the software to drive it which permits analysis of pathologist activities, both for supply and for demand. The model was developed with generalized concepts that would, with little tweaking, be applicable to any medical specialty. The functionality and output of the model, which has been reported elsewhere,11,24 supports analysis of the anticipated future supply of pathologists through 2030 and types of demand that the pathologist workforce will likely experience. The software model supports quantitative forecasting for both current and new areas of effort. This model can test hypotheses and examine implications for pathologist workforce requirements, including financial consequences. In developing the model, we also developed a new taxonomy for the practice of pathology, which includes work done for populations as a whole as well as for individual patients one at a time and thus differs from the taxonomies of other clinical specialties.
Medicine in general, and not just pathology, is experiencing unprecedented change at this time. We foresee that emerging technologies will drastically alter the laboratory and other areas in medicine (eg, nanotechnology, telemedicine, remote diagnostics, and team care throughout patients’ lives with real-time capture of patient data) in sickness or health, regardless of location. New technologies employed today, such as genomic medicine and clinical informatics, represent significant opportunities for pathologists. We foresee the changing delivery of health care will motivate all physicians to provide and ensure the highest quality of diagnostic testing and accurate reporting of clinical information to improve outcomes and maximize patient safety. The corresponding challenge we foresee will be to develop and apply modeling tools that integrate and evaluate demand across disciplines. Such tools will more accurately determine the numbers of physicians and others in the health care team required to efficiently and effectively care for patients and populations of patients in providing correct diagnosis, chronic disease prevention and management, and optimal treatment decisions.
Footnotes
Declaration of Conflicting Interests: The author(s) declared no potential conflicts of interest with respect to the research, authorship, and/or publication of this article.
Funding: The author(s) disclosed receipt of the following financial support for the research, authorship, and/or publication of this article: The College of American Pathologists funded the development of the software model. The authors received no financial support for the authorship and/or publication of this article.
References
- 1.Erikson C, Salsberg E, Forte G, Bruinooge S, Goldstein M. Future supply and demand for oncologists: challenges to assuring access to oncology services. J Oncol Pract. 2007;3:79–86. [DOI] [PMC free article] [PubMed] [Google Scholar]
- 2.The Physician Workforce: Projections and Research into Current Issues Affecting Supply and Demand. Washington, DC: U.S. Department of Health and Human Services, Health Resources and Services Administration, Bureau of Health Professions; 2008. [Google Scholar]
- 3.Dill MJ, Salsberg ES. The Complexities of Physician Supply and Demand: Projections Through 2025. Washington DC: American Association of Medical Colleges (Center for Workforce Studies; ); 2008. [Google Scholar]
- 4.Colwill JM, Cultice JM, Kruse RL. Will generalist physician supply meet demands of an increasing and aging population? Health Aff (Millwood). 2008;27:w232–w241. [DOI] [PubMed] [Google Scholar]
- 5.Forte GJ, Armstrong DP. New York Physician Supply and Demand through 2030. Rensselaer, NY: The Center for Health Workforce Studies, University of Albany; 2009. [Google Scholar]
- 6.Staiger DO, Auerbach DI, Buerhaus PI. Comparison of physician workforce estimates and supply projections. JAMA. 2009;302:1674–1680. [DOI] [PMC free article] [PubMed] [Google Scholar]
- 7.Cribbs JS. Physician Forecasting in Virginia 2008 - 2030. Henrico, VA: Virginia Department of Health Professions, Healthcare Workforce Data Center,; 2010. [Google Scholar]
- 8.Petterson SM, Liaw WR, Phillips RL, Jr, Rabin DL, Meyers DS, Bazemore AW. Projecting US primary care physician workforce needs: 2010-2025. Ann Fam Med. 2012;10:503–509. [DOI] [PMC free article] [PubMed] [Google Scholar]
- 9.Withy K, Dall T, Sakamoto D. Hawai’i physician workforce assessment 2010. Hawaii J Med Public Health. 2012;71:6–12. [PMC free article] [PubMed] [Google Scholar]
- 10.Dall TM, Storm MV, Chakrabarti R, et al. Supply and demand analysis of the current and future US neurology workforce. Neurology. 2013;81:470–478. [DOI] [PMC free article] [PubMed] [Google Scholar]
- 11.Robboy SJ, Weintraub S, Horvath AE, et al. Pathologist workforce in the United States: I. Development of a predictive model to examine factors influencing supply. Arch Pathol Lab Med. 2013;137:1723–1732. [DOI] [PubMed] [Google Scholar]
- 12.Fraher E. Interactive Workforce Model Will Bring Invaluable New Data and Insight to Physician Shortage Debate. The Physician’s Foundation; 2014. FutureDocs Forecasting Tool. Web site http://www2.shepscenter.unc.edu/workforce/index.php. Accessed January 1, 2015. [Google Scholar]
- 13.Dall T, West T, Chakrabarti R, Iacobucci W. The Complexities of Physician Supply and Demand: Projections from 2013 to 2025. Washington, DC: Association of American Medical Colleges; 2015. [Google Scholar]
- 14.Basu K, Gupta A. A physician demand and supply forecast model for Nova Scotia. Cah Sociol Demogr Med. 2005;45:255–285. [PubMed] [Google Scholar]
- 15.Scheffler RM, Liu JX, Kinfu Y, Dal Poz MR. Forecasting the global shortage of physicians: an economic- and needs-based approach. Bull World Health Organ. 2008;86:516–523B. [DOI] [PMC free article] [PubMed] [Google Scholar]
- 16.Koike S, Matsumoto S, Kodama T, Ide H, Yasunaga H, Imamura T. Estimation of physician supply by specialty and the distribution impact of increasing female physicians in Japan. BMC Health Serv Res. 2009;9:180. [DOI] [PMC free article] [PubMed] [Google Scholar]
- 17.Barber P, Lopez-Valcarcel BG. Forecasting the need for medical specialists in Spain: application of a system dynamics model. Hum Resour Health. 2010;8:24. [DOI] [PMC free article] [PubMed] [Google Scholar]
- 18.Yuji K, Imoto S, Yamaguchi R, et al. Forecasting Japan’s physician shortage in 2035 as the first full-fledged aged society. PLoS One. 2012;7:e50410. [DOI] [PMC free article] [PubMed] [Google Scholar]
- 19.Tsai TC, Eliasziw M, Chen DF. Predicting the demand of physician workforce: an international model based on “crowd behaviors”. BMC Health Serv Res. 2012;12:79. [DOI] [PMC free article] [PubMed] [Google Scholar]
- 20.Health Workforce Australia 2012. Health Workforce 2025. Doctors, Nurses and Midwives, Vol 1 Adelaide, Australia: Health Workforce Australia; 2012. [Google Scholar]
- 21.de Graaf-Ruizendaal WA, de Bakker DH. The construction of a decision tool to analyse local demand and local supply for GP care using a synthetic estimation model. Hum Resour Health. 2013;11:55. [DOI] [PMC free article] [PubMed] [Google Scholar]
- 22.Suphanchaimat R, Wisaijohn T, Thammathacharee N, Tangcharoensathien V. Projecting Thailand physician supplies between 2012 and 2030: application of cohort approaches. Hum Resour Health. 2013;11:3. [DOI] [PMC free article] [PubMed] [Google Scholar]
- 23.Santric-Milicevic M, Vasic V, Marinkovic J. Physician and nurse supply in Serbia using time-series data. Hum Resour Health. 2013;11(1):27. [DOI] [PMC free article] [PubMed] [Google Scholar]
- 24.Robboy SJ, Crawford JM, Cohen MB, et al. The pathologist workforce in the United States: II. An interactive modeling tool for analyzing future qualitative and quantitative manpower demand for services. Arch Pathol Lab Med. 2015;139. [DOI] [PubMed] [Google Scholar]
- 25.Bauer SN. Building a fact-based case for change. CAP Today; 2010. [Google Scholar]
- 26.Cooper RA. Physician migration: a challenge for America, a challenge for the world. J Contin Educ Health Prof. 2005;25(1):8–14. [DOI] [PubMed] [Google Scholar]
- 27.FREIDA Online. Online graduates’ career plans. 2008 [cited 2013 Jan 1]; Web site http://www.ama-assn.org/ama/pub/education-careers/graduate-medical-education/freida-online.page. Accessed January 1, 2013.
- 28.Fraher EP, Stitzenberg KB. Building better oncology data systems and workforce models in a rapidly changing health care system. J Oncol Pract. 2013;9(1):1–2. [DOI] [PMC free article] [PubMed] [Google Scholar]


