Abstract
Megakaryocytes are naturally polyploid cells that increase their ploidy by endomitosis. However, very little is known regarding the mechanism by which they escape the tetraploid checkpoint to become polyploid. Recently, it has been shown that the tetraploid checkpoint was regulated by the Hippo-p53 pathway in response to a downregulation of Rho activity. We therefore analyzed the role of Hippo-p53 pathway in the regulation of human megakaryocyte polyploidy. Our results revealed that Hippo-p53 signaling pathway proteins are present and are functional in megakaryocytes. Although this pathway responds to the genotoxic stress agent etoposide, it is not activated in tetraploid or polyploid megakaryocytes. Furthermore, Hippo pathway was observed to be uncoupled from Rho activity. Additionally, polyploid megakaryocytes showed increased expression of YAP target genes when compared to diploid and tetraploid megakaryocytes. Although p53 knockdown increased both modal ploidy and proplatelet formation in megakaryocytes, YAP knockdown caused no significant change in ploidy while moderately affecting proplatelet formation. Interestingly, YAP knockdown reduced the mitochondrial mass in polyploid megakaryocytes and decreased expression of PGC1α, an important mitochondrial biogenesis regulator. Thus, the Hippo pathway is functional in megakaryocytes, but is not induced by tetraploidy. Additionally, YAP regulates the mitochondrial mass in polyploid megakaryocytes.
Introduction
Megakaryopoiesis is a unique model of differentiation characterized by a physiological polyploidization and a maturation that leads to platelet production.1,2 Polyploidy in megakaryocytes (MKs) is achieved by endomitosis, which corresponds to defective cytokinesis and karyokinesis.3–5 An increase in ploidy is believed to augment cell size, a crucial parameter for increasing platelet production.6,7 While the modal ploidy of MKs in the bone marrow is 16N, the ploidy of individual MKs can reach 64N or more.7,8 This indicates that MKs are able to escape the 4N control called the tetraploid checkpoint either because they are devoid of the tetraploid checkpoint machinery or can overcome this checkpoint that normally exists in most cell types except embryonic stem cells and undifferentiated embryos.9
Key checkpoints exist in cells and include the tetraploid checkpoint that ensures cessation of proliferation and apoptosis of tetraploid cells. This is essential as tetraploidy not only promotes genetic instability, but also contributes to tumorigenesis.10,11 Reports have identified the Hippo-p53 pathway as an important component of the tetraploid checkpoint.12,13 The conserved Hippo tumor suppressor pathway consists of the STE (yeast Sterile20 kinase) family protein kinases (MST1/2) which when activated can phosphorylate LATS1/2.14 This activates the kinase activity of LATS1/2 leading to direct interaction and phosphorylation of the transcription co-activators YAP/TAZ. Phosphorylated YAP/TAZ is sequestered in the cytoplasm resulting in the inhibition of target gene transcription.15 In contrast when upstream kinases are inactive, YAP/TAZ can translocate into the nucleus and activate transcription of their target genes. More recent studies have described the tumor suppressor LATS2 as a key link between p53 and tetraploid arrest. p53 has long been known to play a central role in this checkpoint since p53 knockout cells were found to be prone to accumulate tetraploid cells that divide subsequently.16,17 The Hippo pathway is triggered in response to tetraploidy.12 This stabilizes p53 through direct interaction of LATS2 with MDM2 leading to p53 stabilization and proliferation arrest of tetraploid cells.13
The role of p53 during MK differentiation has been previously studied. It has been shown that p53−/− mice showed increased numbers of MKs with higher ploidy, more particularly in stress conditions.18–20 Further, p53 stabilization by MDM2 inhibitors was found to impair all stages of megakaryopoiesis including polyploidy and proplatelet formation.20,21 However, no information exists about the Hippo pathway in MKs. In this study we analyzed the role of the Hippo-p53 pathway in the regulation of human MK polyploidy. MKs were observed to harbor a functional Hippo-p53 pathway that responds to genotoxic stress, but not to polyploidy by decoupling the Hippo pathway from Rho activity.
Methods
Cultures of megakaryocytes and erythroblasts derived from human CD34+ cells in serum-free liquid medium
Leukapheresis and cord blood samples were obtained after approval from the Assistance Publique des Hopitaux de Paris. All adult participants in this study gave their informed written consent in accordance with the Declaration of Helsinki. The study was approved by the Local Research Ethics Committee of Hospital Saint Louis, Paris, France, for the cord blood samples and the Local Research Ethics Committee of Institut Gustave Roussy, Villejuif, France. Details of culture conditions are given in the Online Supplementary Appendix.
Cell sorting and flow cytometry
Cell sorting and analysis of ploidy level were previously described.4
Real-time quantitative PCR
Primers for qRT-PCR were designed using Primer Express Software (Perkin-Elmer Applied Biosystems, Foster City, CA, USA) and were synthesized by Eurogentec (Angers, France). qRT-PCR was carried out in the ASI Prism GeneAmp 5700 (Perkin-Elmer Applied Biosystems) using the Power SYBR-Green PCR Master Mix (ABI) containing the specific primers (1.2 mM). The expression levels of all genes were calculated relatively to HPRT and PPIA1. Details of primer sequences are provided in the Online Supplementary Appendix.
Immunofluorescence
The cells were plated on poly-L-lysine-coated slides (O. Kindler GmbH&Co, Freiburg, Germany) for 1 h at 37°C. Immunofluorescence staining was performed using mouse anti-p53, anti-β1-tubulin (Sigma-Aldrich) or anti-YAP antibodies and appropriate secondary antibodies conjugated with Alexa-488 or Alexa-546 (Molecular Probes Life Technology). TOTO-3 iodide or DAPI (Molecular Probes, Life Technology) was applied for nuclear staining. Cells were examined under a Zeiss LSM 510 laser scanning microscope (Carl Zeiss, Le Pecq, France) or Leica TCS SP8 MP (Leica Microsystems, Wetzlar, Germany) with a 63X oil immersion objective.
Western blot analysis
Western blots were performed as described previously.22 Details of the primary antibodies are given in the Online Supplementary Appendix.
Proplatelet formation assay
CD41+GFP+ or CD41+mCherry+ MKs were sorted at day 8 of culture and proplatelet formation was evaluated as previously described.22 A total of 200 cells per well were counted during four days. Images were obtained using an inverted microscope (Carl Zeiss, Göttingen, Germany) at a magnification of 40X using the Axio v.4.6 software.
Transmission electron microscopy
Details of transmission electron microscopy may be found in the Online Supplementary Appendix.
Statistical analysis
Student’s t-test and one-way Anova test were used to determine the significance of the data.
Results
Hippo-p53 pathway proteins are expressed in megakaryocytes
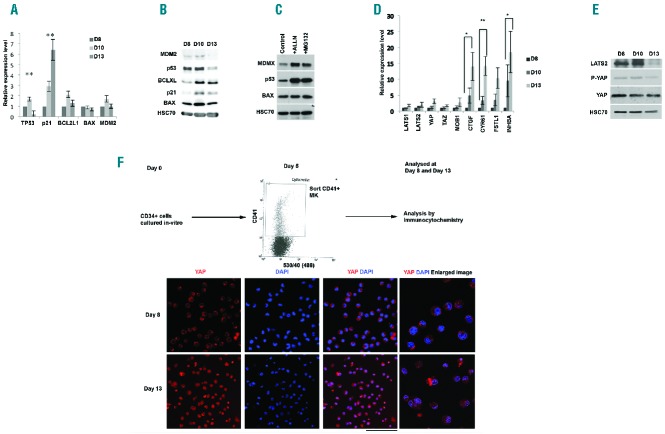
The Hippo-p53 pathway constitutes the tetraploid checkpoint.12 We investigated the status of this pathway in human MKs at different ontogenic stages. Analysis of previously reported global microarray expression data revealed that key genes of the pathway were expressed in MKs derived from human cord blood and adult cytapheresis23 (Online Supplementary Figure S1). This was confirmed by real-time analysis of mRNA expression in in vitro cultured mature MKs (defined as CD41+CD42+ cells) derived from cord blood and adult cytapheresis (Online Supplementary Figure S1). Furthermore, adult MKs were sorted on day 6 of culture on the expression of CD41 and further cultured to the end of MK maturation. Representative data of the ploidy distribution across the days of culture are shown in Online Supplementary Figure S2. We observed an initial increase followed by a marked decrease in the p53 transcript level at the end of MK maturation with a corresponding increase in the expression of p21. No statistically significant change was observed in the mRNA expression of BCL2L1, BAX and MDM2 (Figure 1A). In agreement with the mRNA expression profile, p53 protein expression remained constant and decreased at the end (day 13) of in vitro MK differentiation (Figure 1B). Moreover, two negative regulators of p53, MDM2 and MDMX, were also present in MKs (Figure 1B and C). Treatment of sorted CD41+ MKs with the proteasome inhibitors ALLN and MG132 dramatically increased the expression of p53, demonstrating that p53 was mainly regulated by proteasomal degradation during MK differentiation (Figure 1C). The mRNA expression of Hippo pathway genes LATS1, LATS2 and TAZ remained invariant during the course of MK maturation. However, a consistent and significant increase in the expression of the transcriptional targets of YAP (CTGF, CYR61, FSTL1 and INHBA) was observed indicating that YAP activity increased in mature MKs (Figure 1D). This was associated with an unchanged YAP protein level (Figure 1E), but with an increased nuclear localization of the protein (Figure 1F). Reminiscent of p53, the LATS2 protein expression remained fairly constant and decreased only at the very end of MK maturation (Figure 1E). Interestingly and in contrast to the mRNA levels, protein expression of LATS2 and p21 decreased at day 13 of in vitro culture. This may be due to the fact that day 13 MKs are at the very end of their maturation with a heterogeneous population of MKs in terms of ploidy and proplatelet production. Together, our results reveal that genes of the Hippo-p53 pathway are expressed throughout the various stages of MK maturation.
Figure 1.
Expression of Hippo-p53 pathway genes in megakaryocytes (MKs). (A) qRT-PCR data indicating relative expression of p53 and related genes on days 10 and 13 with respect to day 8 of in vitro cultured CD41+CD42+ MKs normalized against HPRT. Data represent mean±SEM (n=3; **P<0.01). (B) Protein expression of p53, p21, BAX, MDM2 and BCL-XL (BCL2L1) in the CD41+ sorted cells during MK differentiation and investigated by Western blot analysis. HSC70 indicates the loading in each lane. (C) The CD41+ sorted cells was treated with proteasome inhibitors (ALLN or MG132) for three hours, then p53 level was investigated by Western blot. HSC70 indicates the loading in each lane. (D) qRT-PCR data indicating relative expression of Hippo pathway genes on days 10 and 13 with respect to day 8 of in vitro cultured CD41+CD42+ MKs normalized against HPRT. Data represent mean±SEM (n=3; *P<0.05, **P<0.01) Similar results were obtained using PPIA. (E) Western blot analysis of Hippo pathway proteins and their expression in CD41+ MKs on different days of culture. HSC70 indicates the loading in each lane. (F) Confocal microscopic image of CD41+ MKs on different days of culture and stained for YAP and showing its localization in the cytosol and nucleus. DAPI was used to stain the nucleus. 150 cells were counted and categorized according to the distribution of YAP between nucleus (N) and cytosol (C). Day 8: N>C(6%), N=C(21%), N<C(73); Day 13: N>C(74%), N=C(14%), N<C(12%). Scale bar=100 μm.
Hippo-p53 pathway is functional in megakaryocytes
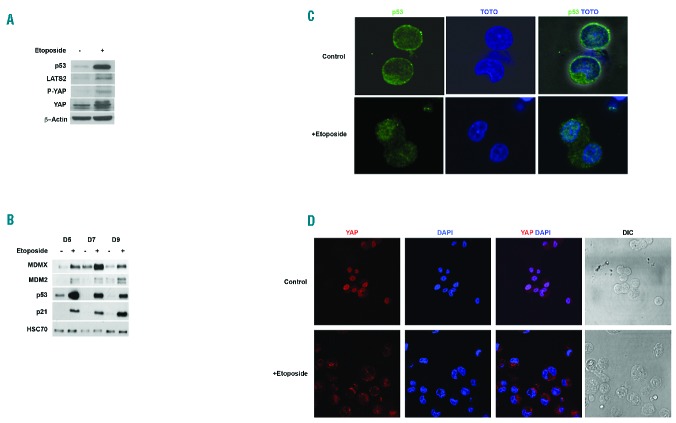
To understand whether Hippo-p53 signaling pathway was functional in MKs, cells were treated with a genotoxic agent (etoposide). Staining for p53-BP1 confirmed the genotoxicity of a 3-h treatment with 10 μM etoposide in MKs (Online Supplementary Figure S3). MKs were exposed to etoposide at various days of culture. Etoposide induced a drastic increase in the expression of both LATS2 and p53 (Figure 2A). Consistent with the canonical Hippo pathway, increased phosphorylation of YAP on ser127 was observed (Figure 2A). Enhanced LATS2 expression leading to increased p53 stability was reflected by increased p21 expression (Figure 2B). Under basal conditions, p53 protein was mostly cytoplasmic (>95%) in MKs. Upon etoposide exposure, p53 trafficked from the cytoplasm to the cell nucleus (Figure 2C). Moreover, consistent with its increased phosphorylation, YAP was completely sequestered in the cytoplasm of mature MKs (Figure 2D). Taken together, etoposide-induced genotoxic stress was found to activate the Hippo-p53 axis in MKs.
Figure 2.
Hippo-p53 axis is activated by genotoxic stress. (A) Western blot analysis of Hippo-p53 pathway proteins in CD41+ megakaryocytes treated with/without 10 μM etoposide for five hours. β-actin was used as loading control. (B) Western blot analysis of p53 and its target genes performed after 12 hours of etoposide treatment at different days (D) of culture (D5, D7 and D9). HSC70 was used as loading control. (C) p53 localization in untreated and 12-h etoposide treated CD41+ MK cells. Cells were stained with anti-p53 antibody. TOTO-3 was used to stain the nucleus. Scale bar=20 μm. (D) YAP localization in untreated CD41+ MK cells and CD41+ MK cells treated by 10 μM etoposide for five hours on day 10 of culture. Cells were stained with anti-YAP antibody. DAPI was used to stain the nucleus. Cells (150) were counted and categorized according to the distribution of YAP between nucleus (N) and cytosol (C). Whereas for control cells, nearly 70% had YAP staining the nucleus, none of the cells in etoposide treated samples showed nuclear localization of YAP. Scale bar=30 μm.
Hippo-p53 pathway is not activated in polyploid megakaryocytes
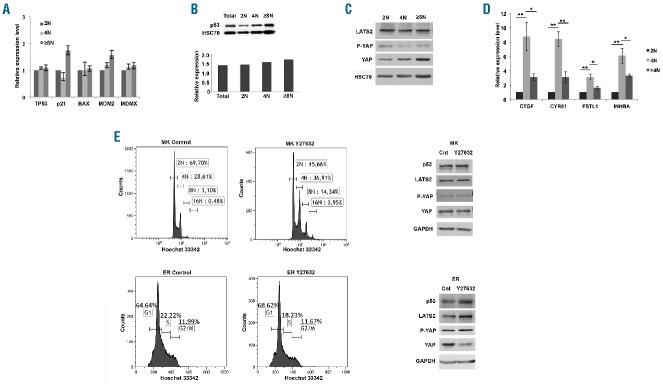
We next checked whether polyploidy could induce the activation of Hippo and p53 pathway genes. MKs were sorted based on their ploidy level into diploid (2N), tetraploid (4N) and polyploid (≥8N) cell populations. We did not detect any significant link between ploidization and the mRNA expression of p53, BAX, p21, MDM2 and MDMX genes (Figure 3A). Similarly, we did not detect any significant link between p53 protein expression and ploidy (Figure 3B). The expression of LATS2 also remained invariant at the different ploidy levels (Figure 3C and densitometric quantification in Online Supplementary Figure S4). YAP expression remained fairly constant in the three ploidy states with a modest but not significant decrease in the phosphorylation of YAP in 4N ploidy stage (Figure 3C and Online Supplementary Figure S4). However, a pronounced increase in the expression of YAP target genes was observed in 4N and polyploid MKs indicating an increase in YAP transcriptional activity and, therefore, an inactivation of the Hippo pathway (Figure 3D). Thus, our data indicate that, in MKs, the Hippo-p53 pathway failed to sense polyploidy as a genotoxic stress.
Figure 3.
Hippo-p53 axis is not activated by polyploidy. (A) qRT-PCR data indicating relative expression of p53 and related genes in cultured megakaryocytes (MKs) at different ploidy levels: 4N and ≥8N in comparison to 2N CD41+CD42+ MKs and normalized against HPRT. Data represent mean±SEM of 3 independent experiments. No significant difference was observed. (B) p53 expression in the CD41+ MKs sorted on ploidy and investigated by Western blot analysis. HSC70 indicates the loading in each lane. The mean density of p53 normalized against HSC70 is indicated in the histogram plot below. (C) Protein expression of Hippo pathway genes in the CD41+ MKs sorted on ploidy and investigated by Western blot analysis. HSC70 indicates the loading in each lane. (D) qRT-PCR data indicating relative expression of YAP downstream target genes in MK cells of ploidy 4N and ≥8N with respect to 2N of in vitro cultured CD41+CD42+ MKs and normalized against HPRT. Data represent mean±SEM (n=4; *P<0.05, **P<0.01). (E) Western blot analysis of the expression of Hippo-p53 pathway proteins in CD41+ MKs and CD71+ erythroblasts (ER) treated for five hours with 10 μM Y27632. GAPDH was used as a loading control. The corresponding DNA ploidy/cell cycle analysis analyzed after 72 hours of culture with/without 10 μM Y27632 for each sample with Hoechst 33342 staining is provided. Data are representative of 3 independent experiments. Densitometric analysis of the western blots are provided in Online Supplementary Figure S3. A significant increase in the percentage of polyploid MKs was observed with Y27632 (Control MKs = 3.50 ± 0.2%, MK + Y227632= 18.15 ± 2.5%, n=3; P<0.004)
RhoA/ROCK pathway has been widely studied in relation to MK differentiation. RhoA and ROCK proteins are well expressed in MKs and have been shown to regulate ploidy and proplatelet formation.4,22,24 Because, reduced RhoA activity in tetraploid cells induced Hippo-p53 signaling, and as MK differentiation and ploidization are associated with a decrease in RhoA activity,24 we checked if a further decrease in RhoA activity through ROCK inhibition (Y27632) could induce Hippo-p53 signaling in MKs. CD41+CD42+ MKs and CD71+ erythroblasts sorted on day 5 of in vitro culture were treated with Y27632. ROCK inhibition induced p53 expression in erythroblasts and reduced YAP expression increasing the ratio of phosphorylated YAP-S127 to total YAP (Figure 3E and densitometric quantification in Online Supplementary Figure S4). However, Y27632 treatment did not induce p53 expression in MKs. In addition, there was no accompanying change in the expression of LATS2 or YAP and in the phosphorylation of YAP on ser127 (Figure 3E). Furthermore, increased MK ploidy was observed upon prolonged exposure to Y27632, a result that we have previously reported.4 Lastly, treatment of erythroblasts with ROCK inhibitor decreased the expression of YAP downstream target genes (Online Supplementary Figure S5) without any effect on their expression in MKs. This indicated that, in MKs in contrast to erythroblasts, RhoA activity is uncoupled from the Hippo pathway.
p53 knockdown does not affect ploidy, but increases proplatelet formation in megakaryocytes
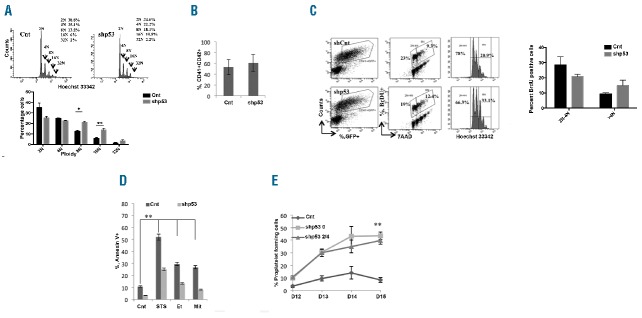
To determine whether p53 knockdown facilitates human MK differentiation, CD34+ cells were induced into MK differentiation and transduced at day 3 or 4 of culture with GFP+ lentivirus encoding scrambled sequence or shp53 constructs (shp53-0, shp53-2, shp53-4). Transcript analysis of sorted GFP+CD41+ cells after 72-h transduction demonstrated that shp53-0 alone almost completely depleted p53, whereas a combination of shp53-2 and shp53-4 (shp53-2/4) reduced the mRNA level by approximately 60% (Online Supplementary Figure S6i). A decrease in p53 expression was also seen at the protein level (Online Supplementary Figure S6ii). Reduced p53 expression was accompanied by a decrease in the expression of p53 targets such as p21, BAX, MDM2, DR5 and PUMA (Online Supplementary Figure S6i). We also checked whether p53 expression was similarly down-regulated at the different ploidy states (Online Supplementary Figure S7). In subsequent experiments, we used shp53-0 and confirmed our results with shp53-2/4. p53 knockdown had a modest effect on 2N and 4N ploidy MKs while significantly increasing the percentage of MKs with ploidy 8N and 16N (Figure 4A). It had no effect on MK differentiation as the percentage of mature CD41+CD42+ MKs was not significantly modified in culture (n=5, 54%–61%) (Figure 4B). Furthermore, p53 downregulation had limited effects on the MK cell cycle as attested by the incorporation of BrdU in the control and p53 knockdown samples at different ploidy states (Figure 4C). Lastly, as changes in p53 expression are frequently associated with genomic instability, we examined the separation of chromosomes and the number of centromeres during mitosis and endomitosis. We observed that centrosomes were paired and localized correctly, and that the segregation and separation of these chromosomes was normal (Online Supplementary Figure S8). At the same time, p53 downregulation decreased MK response to apoptotic stimuli as observed in MK cells treated with 2 μM staurosporin, 4 μM etoposide and 1 μg/mL mitomycin C (Figure 4D). Next, we analyzed the proplatelet formation in p53 knockdown MKs. No effect was observed on proplatelet branching (Online Supplementary Figure S9i). However, p53 knockdown increased the number of proplatelet-forming MKs. At day 14 of culture, a 4-fold increase was observed with shp53-0 and 3.5-fold increase with shp53-2/4 (P=0.015) (Figure 4E). p53 knockdown also caused a marked increase in cytoplasmic maturation as observed by an increased development of the demarcation membrane system (Online Supplementary Figure S9ii). At the same time, p53 knockdown did not affect the mRNA level of Hippo pathway genes (data not shown). Our results clearly indicate that p53 knockdown has a minor effect on ploidy level, further demonstrating that, in basal conditions, p53 is not a major determinant of MK polyploidization, but markedly increases proplatelet formation.
Figure 4.
p53 knockdown increases proplatelet formation. Cells were transduced at day 4 of culture with a control lentivirus encoding scrambled shRNA (Cnt) or lentiviruses encoding either shRNA p53-0 or shRNAs p53-2/4. (A) Representative image of the ploidy level of GFP+ CD41+CD42+ cell population as analyzed by Hoechst staining. The percentage of cells at each ploidy level was calculated. Data represent mean±SEM of 4 independent experiments (*P<0.006, **P<0.002). (B) Flow cytometric analysis of mature MKs expressing CD41 and CD42 in the GFP+ cells at day 9 of culture (n=5; P=0.03). (C) Flow cytometric analysis showing percentage of BrdU positive cells in control and p53 knockdown MKs (CD41+ GFP+ cells) at day 7 of culture. Data represent the mean±SEM of 3 independent experiments. (D) Annexin V binding assay on p53 knockdown or control cells at day 7 of culture exposed to 2 μM staurosporine (STS), 4 μM etoposide (Et), 1 μg/mL mitomycine C (Mit) and DMSO for 24 h was performed by flow cytometry. Data represent mean±SEM (n=3; **P≤0.01). (A) GFP+ CD41+ sorted cells were seeded at 2×10³ cells/well in a 96-well plate. The percentage of proplatelet-forming megakaryocytes (MKs) was estimated by counting MKs exhibiting one or more cytoplasmic processes with areas of constriction. A total of 200 cells per well were counted during four days. Error bars in histograms represent the standard deviation (SD) of one representative experiment performed in triplicate wells. Similar results were obtained in 4 repeated experiments (n=4; **P=0.015).
Knockdown of YAP moderately decreases proplatelet formation and does not affect megakaryocyte ploidy
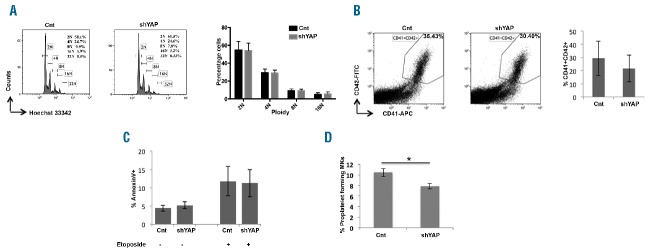
To determine the effects of YAP on human MK differentiation, CD34+ cells were induced into MK differentiation and transduced at day 3 or 4 of culture with mCherry+ lentivirus encoding scrambled or shYAP. Western blot and real-time PCR analysis on the sorted mCherry+CD41+ cells after 72 h of transduction demonstrated the efficacy of shYAP with more than a 70% decrease in mRNA expression and a corresponding decrease in protein expression (Online Supplementary Figure S10i and ii). Reduction in YAP expression was also accompanied by a decrease in the expression of YAP target genes (Online Supplementary Figure S10ii). shRNA mediated knockdown of YAP did not significantly affect MK ploidy (Figure 5A), although YAP knockdown by the shRNA was identical in all ploidy classes (Online Supplementary Figure S11). YAP knockdown did not affect MK differentiation as the percentage of mature CD41+CD42+ MKs was not modified in culture in comparison to control cells (Figure 5B). At the same time, YAP knockdown had no significant effect on apoptosis as observed in MKs treated with etoposide (Figure 5C). In addition, we analyzed the proplatelet formation in YAP knockdown MKs. A moderate but significant decrease in the number of cells bearing proplatelets was consistently observed in YAP knockdown MKs (Figure 5D). Taken together, the results clearly indicate that YAP knockdown does not significantly affect ploidy, but decreases proplatelet formation. Given the increased expression of YAP target genes with the ploidy level and MK maturation, it was plausible that YAP had pleotropic functions in MK biology.
Figure 5.
YAP knockdown does not affect ploidy. Cells were transduced at day 4 or day 5 of culture with a control mCherry+ lentivirus encoding either scrambled (Cnt) or shYAP. (A) Representative image of ploidy distribution in mCherry+CD41+CD42+ cells analyzed by Hoechst staining. The percentage of cells at each ploidy level was calculated. Corresponding histogram plot represents the mean±SEM of mean ploidy of 5 independent experiments. (P>0.05, indicates that differences between the 2 samples are not significant). (C) Flow cytometric analysis of mature MKs expressing CD41 and CD42 in the mCherry+ cells at day 9 of culture. Data represent mean±SEM of 4 independent experiments. (N=4; P>0.05 indicates that the difference between the samples is not significant.) (D) Annexin V binding assay in scrambled and YAP knockdown megakaryocyte (MK) cells exposed to 10 μM etoposide (Et) for five hours was performed by flow cytometry. Data represent mean ± SEM of 4 independent experiments. (n=4; P>0.05 indicates that the difference between the samples is not significant.) (D) mCherry+CD41+ sorted cells were seeded at 2×10³ cells/well in a 96-well plate. The percentage of PPT-forming MKs was estimated by counting MKs on day 11 or day 12, exhibiting one or more cytoplasmic processes with areas of constriction. shYAP slightly but significantly decreased proplatelet formation. Data represent mean±SEM of 4 independent experiments (n=4; * P<0.014).
YAP sustains the expression of PGC1α in megakaryocytes
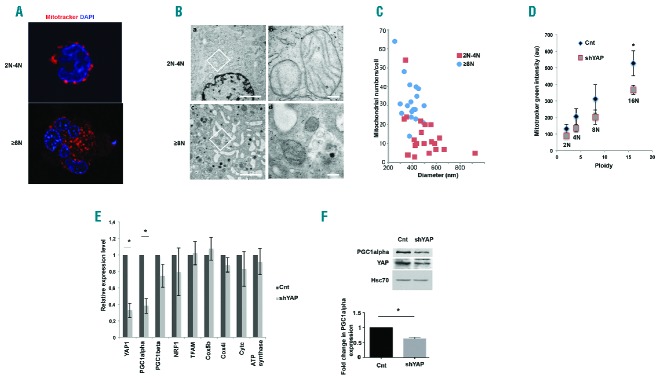
Therefore, we tried to understand the implications of increased YAP activity in polyploid MKs. We hypothesized that the increased cell size associated with polyploidy would require increased energy production. We therefore analyzed the mitochondria in MKs at different ploidy levels. Live cell imaging of mitochondria revealed that diploid and tetraploid (2N-4N) nuclei containing MKs and polyploid MKs have small, punctate mitochondria. Mitochondria were perinuclear in 2N-4N ploidy MKs while they were dispersed throughout the cytoplasm in polyploid MKs (Figure 6A). Electron micrographs also confirmed the perinuclear and dispersed localizations of mitochondria in the two ploidy classes. Furthermore, mitochondria were observed to have clearly defined inner membrane with well-defined cristae (Figure 6B). Next, we analyzed the mitochondrial mass in the various ploidy states of MKs. Increase in MK ploidy was accompanied by an increase in mitochondrial mass (Figure 6C and D). An increase in the number of mitochondria was also evident in the electron micrographs of polyploid MKs. Furthermore, mitochondria in polyploid MKs were observed to be smaller in comparison to diploid-tetraploid MKs (Figure 6C and Online Supplementary Figure S12). We also analyzed the expression of key genes involved in mitochondrial biogenesis and mitochondrial fission-fusion kinetics in the three ploidy states. The mRNA expression of these genes remained unaltered with ploidy (Online Supplementary Figure S13i and ii). Taken together, this indicated that polyploidization was accompanied by an increase in mitochondrial mass.
Figure 6.
YAP knockdown decreases mitochondrial mass. (A) Fluorescence microscopic image of CD41+ megakaryocytes (MKs) stained with mitotracker red. DAPI was used to stain the nucleus. Scale bar=20 μm. (B) Electron micrographs of sections of MKs of 2N-4N ploidy (a,b) and ≥8N (c,d) ploidy states. Representative image shown at 4400× magnification (a,c) and mitochondria indicated at higher magnification of 21600× (b,d) of a field within marked by a box. Scale bars indicate 1 μm (a,c) and 200 nm (b,d). (C) The corresponding graph indicates the number of mitochondria versus the median mitochondrial diameter in 2N-4N and ≥8N ploidy MKs. The parameters are measured on ultrathin sections by TEM using a photo series taken at the same magnification. Further statistical analysis is provided in Online Supplementary Figure S12. (D) MK cells were transduced at day 4 or day 5 of culture with a control mCherry+ lentivirus encoding either scrambled (Cnt) or shYAP. Cells were stained with mitotracker green, Hoechst and anti-CD41 antibody. The fluorescence intensity of mitotracker green in each individual ploidy state (2N, 4N, etc.) was plotted against ploidy number and fitted against a straight line passing through origin by least square fit method (n=4; *P<0.07). (E) qRT-PCR data indicating relative expression of YAP and genes involved in mitochondrial biogenesis and oxidative phosphorylation in MK cells transduced with the indicated vectors. Relative expression of shYAP samples with respect to control (Cnt) was calculated. Data were normalized against HPRT. Data represent mean±SEM of 3 independent experiments (n=3; P<0.003). (F) Protein expression of PGC1α and YAP in the CD41+ MKs sorted on mCherry+ Cnt or mCherry+ shYAP and investigated by Western blot analysis. HSC70 indicates the loading in each lane. Densitometric analysis showing the normalized expression of PGC1alpha (mean±SEM) of 3 independent experiments (P<0.006).
We next analyzed the effects of YAP knockdown on mitochondrial mass of MKs. Staining of mitochondria using mitotracker green followed by live cell imaging revealed that mitochondrial morphology remained unaltered in YAP knock-down MKs (Online Supplementary Figure S14). YAP knockdown did not alter the mitochondrial mass in 2N-4N MKs. However, a significant decrease in mitochondrial mass was observed in cells with ploidy of greater than 8N (Figure 6D). Remarkably, YAP knockdown substantially decreased the expression of PGC1α, a key regulator of mitochondrial biogenesis (Figure 6E and F). PGC1α expression was also found to be constant between diploid, tetraploid and polyploid MKs (Online Supplementary Figure S13i). However, neither ploidy nor YAP knockdown had any significant effect on the expression of key genes of the oxidative phosphorylation system or other genes regulating mitochondrial biogenesis (Figure 6E and Online Supplementary Figure S4). To check if the reduced mitochondrial mass affected cellular energetics, we assessed the ATP content along with cellular NAD+/NADH ratio (Online Supplementary Figure S15i and ii). No change in the ATP content was observed in diploid and tetraploid cells. However, a decrease was observed in the ATP content of polyploid cells demonstrating again that the regulation of YAP is important in polyploid MK cells. However, the NAD+/NADH ratio remained unchanged in the three ploidy classes analyzed. Thus, YAP was found to regulate mitochondrial mass along with the expression of a key mitochondrial biogenesis regulator PGC1α.
Discussion
Megakaryocytes are endowed with unconventional properties that make them unique systems to study various biological processes, especially the switch from mitotic mode of cell division to endomitosis whereby the cells become polyploid. Thus, MKs provide an ideal platform to study how naturally polyploid cells overcome the tetraploid checkpoint that normally arrests cell cycle. It was previously reported that the Hippo-p53 pathway maintains the tetraploid checkpoint and reduction of RhoA activity induced by extra centromeres was found to activate Hippo-p53 pathway.12
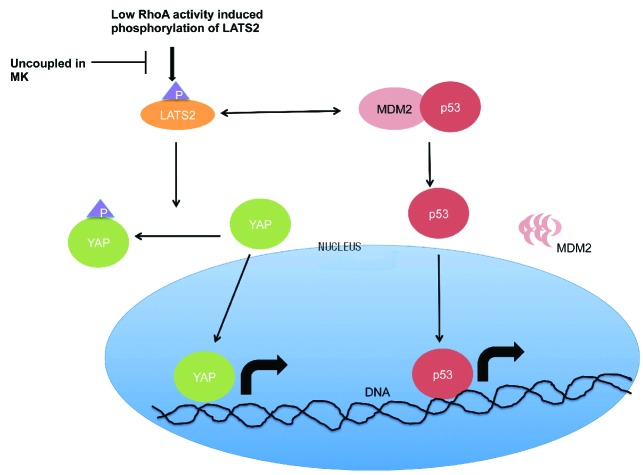
Here, we provide evidence for a functional Hippo-p53 axis in MKs. Figure 7 shows a schematic representation that highlights the key players of the Hippo-p53 pathway. Previous reports have demonstrated the importance of the Hippo pathway in fly hematopoiesis.25,26 It was also reported that key proteins of the Hippo pathway are expressed in mantle cell lymphoma.27 Furthermore YAP, a key component of the Hippo pathway, is highly expressed in stem cells and decreases progressively during differentiation.28 Therefore, we first confirmed the expression of the Hippo and p53 pathway genes in MKs derived from cord blood or adult blood.
Figure 7.
Illustration of Hippo-p53 pathway in megakaryocytes (MKs). Low RhoA activity leads to increased Hippo pathway activity by increasing the expression and phosphorylation of LATS2 leading to increased interaction with MDM2. The interaction between LATS2 and MDM2 inhibits MDM2-p53 interaction thereby releasing p53, which can now enter the nucleus and act as a transcription factor blocking cell cycle progression. At the same time, increased expression and phosphorylation of LATS2 increases phosphorylation of YAP. YAP is thus sequestered away from the nucleus, thereby blocking its transcriptional activity. In MKs, the cells fail to respond to decreased RhoA activity and do not increase the expression of LATS2 or phosphorylation of YAP.
While various mechanisms induce the Hippo pathway activity, tetraploidy and induction of apoptosis activate both p53 and the Hippo pathway.12,29 We employed a genotoxic agent etoposide to decipher the functionality of the Hippo-p53 pathway in MKs and found that it activates this pathway. Next, we analyzed the expression of the components of this pathway in diploid, tetraploid and polyploid MKs. No appreciable change in their expression was detected between the various ploidy states. However, a consistent increase in the expression of YAP and its target genes was observed during polyploidization, as well as during the course of MK differentiation. This indicates that the Hippo-p53 pathway does not sense polyploidy as a stress in MKs. This is in agreement with previous reports that indicated that tetraploid cells re-entering the cell cycle harbored an inactive Hippo pathway.12 Although ploidization has minor effects on p53 expression and its activity, p21 expression markedly increased during late stages of megakaryopoiesis. This is related to regulation by other signaling pathways, such as the MAPK/ERK pathway.30,31
The activation of the Hippo-p53 pathway in tetraploid cells was reported to be acutely dependent upon RhoA activity. As RhoA activity was reported to decrease during the first endomitotic division of MKs, we assessed the effects of decreased RhoA activity on Hippo-p53 pathway.12,24 Our data demonstrate that, in contrast to erythroblasts, the Hippo pathway is decoupled from RhoA activity in MKs. Importantly, decreased RhoA activity had previously been linked to increased YAP phosphorylation in HEK293A cells.32 Our results show that decreased Rho/ROCK signaling did not induce YAP phosphorylation in MKs in contrast to erythroblasts. Moreover, in erythroblasts, inhibition of ROCK was also found to decrease the expression of total YAP protein while increasing the ratio of phosphorylated YAP to total YAP. This was consistent with previous reports that demonstrate that phosphorylation of YAP on S127 induced its degradation.33
p53 knockdown induced a moderate, but significant increase in MK polyploidization, without significant increase in DNA replication. It is likely that the modest increase in polyploidization could be the consequence of a decreased basal apoptosis in p53 knockdown MKs. This is in agreement with previous results on p53−/− mice that show that p53 knockout only increased MK ploidy under stress conditions such as during induced thrombocytopenia, but not in basal conditions in the bone marrow.16,17 However, p53 knockdown significantly increased proplatelet formation in accordance with our previous reports.21,34 Furthermore, YAP knockdown caused no significant change in ploidy, but a consistent and significant decrease in the percentage of proplatelet bearing MKs was observed.
Given the observed increase in YAP target gene expression both during the course of MK differentiation as well as polyploidization, we tried to identify its possible effects. Previous works had suggested links between mitochondria and the Hippo-p53 pathway.35,36 We hypothesized that polyploid MKs would have a large energy demand to sustain their size and functionality, and it is plausible that this could be regulated by the Hippo-p53 pathways. YAP knockdown was found to decrease mitochondrial mass in polyploid MKs with a ploidy greater than 8N while keeping the mitochondrial mass unchanged in diploid and tetraploid MKs. Although mitochondria in polyploid MKs were on average smaller when compared to mitochondria in diploid MKs, no significant differences could be observed in the expression of genes regulating mitochondrial fission-fusion dynamics. Instead, YAP knockdown substantially decreased the expression of PGC1α, a key mitochondrial biogenesis factor37 which was associated with a decrease in ATP content in polyploid MKs. However, no significant change was observed in the NAD+/NADH ratio. Neither was any change observed in the expression of factors regulating biogenesis such as TFAM, which are themselves regulated by PGC1α. Thus, it appears that the expression level of PGC1α in YAP knockdown MKs is sufficient to drive biogenesis, albeit at a slower rate. Interestingly, activation of Yorkie (the fly homolog of YAP) did not alter the expression of PGC1α in Drosophila. Instead, activation of Yorkie increased mitochondrial fusion without altering the cellular ATP content.35 YAP-mediated regulation of mitochondrial mass may explain its effects on proplatelet formation because it has recently been shown that mitochondria play a key role in platelet formation and function, particularly in stress conditions by controlling ROS production.38,39 Interestingly, mitochondria in diploid and tetraploid MKs were found clustered around the nucleus whereas in polyploid MKs they were distributed in the cytoplasm. The perinuclear localization of mitochondria has been previously reported to be associated with high nuclear ROS levels and increased expression of hypoxia-associated genes.40 Therefore, it is plausible that mitochondrial biogenesis and its direct impact on the energetics of the cell could affect proplatelet formation. Further research is required to fully understand the impact of cellular energetics on demarcation membrane formation, proplatelet formation and, ultimately, platelet function.
In summary, our results clearly show the existence of functional Hippo-p53 machinery in MKs that is not activated during MK polyploidization, suggesting that the decrease in RhoA activity is not sensored in MKs. Finally, our study revealed the unexpected role of YAP in the regulation of mitochondrial biogenesis in polyploid MKs and proplatelet formation.
Supplementary Material
Footnotes
Check the online version for the most updated information on this article, online supplements, and information on authorship & disclosures: www.haematologica.org/content/100/12/1469
Funding
This work was supported by grants from Ligue Nationale Contre le Cancer (“Equipe labellisée HR 2013 and 2016”: AR, IP, ND, WV, HR) and Institut National de la Santé et de la Recherche Médicale (INSERM). AR was funded by a grant from FRM (SPF20140129106). IP and WV are partners of the Laboratory of Excellence Globule Rouge-Excellence funded by the program “Investissements d’avenir”.
References
- 1.Bluteau D, Lordier L, Di Stefano A, et al. Regulation of megakaryocyte maturation and platelet formation. J Thromb Haemost. 2009;7(Suppl 1):227–234. [DOI] [PubMed] [Google Scholar]
- 2.Deutsch VR, Tomer A. Advances in megakaryocytopoiesis and thrombopoiesis: from bench to bedside. Br J Haematol. 2013;161(6):778–793. [DOI] [PubMed] [Google Scholar]
- 3.Geddis AE, Kaushansky K. Endomitotic megakaryocytes form a midzone in anaphase but have a deficiency in cleavage furrow formation. Cell Cycle. 2006;5(5): 538–545. [DOI] [PubMed] [Google Scholar]
- 4.Lordier L, Jalil A, Aurade F, et al. Megakaryocyte endomitosis is a failure of late cytokinesis related to defects in the contractile ring and Rho/Rock signaling. Blood. 2008;112(8):3164–3174. [DOI] [PubMed] [Google Scholar]
- 5.Lordier L, Pan J, Naim V, et al. Presence of a defect in karyokinesis during megakaryocyte endomitosis. Cell Cycle. 2012;11(23): 4385–4389. [DOI] [PMC free article] [PubMed] [Google Scholar]
- 6.Sher N, Von Stetina JR, Bell GW, Matsuura S, Ravid K, Orr-Weaver TL. Fundamental differences in endoreplication in mammals and Drosophila revealed by analysis of endocycling and endomitotic cells. Proc Natl Acad Sci USA. 2013;110(23):9368–9373. [DOI] [PMC free article] [PubMed] [Google Scholar]
- 7.Ravid K, Lu J, Zimmet JM, Jones MR. Roads to polyploidy: the megakaryocyte example. J Cell Physiol. 2002;190(1):7–20. [DOI] [PubMed] [Google Scholar]
- 8.Zimmet J, Ravid K. Polyploidy: occurrence in nature, mechanisms, and significance for the megakaryocyte-platelet system. Exp Hematol. 2000;28(1):3–16. [DOI] [PubMed] [Google Scholar]
- 9.Horii T, Yamamoto M, Morita S, Kimura M, Nagao Y, Hatada I. p53 suppresses tetraploid development in mice. Sci Rep. 2015;5:8907. [DOI] [PMC free article] [PubMed] [Google Scholar]
- 10.Davoli T, de Lange T. The causes and consequences of polyploidy in normal development and cancer. Annu Rev Cell Dev Biol. 2011;27:585–610. [DOI] [PubMed] [Google Scholar]
- 11.Dewhurst SM, McGranahan N, Burrell RA, et al. Tolerance of whole-genome doubling propagates chromosomal instability and accelerates cancer genome evolution. Cancer Discov. 2014;4(2):175–185. [DOI] [PMC free article] [PubMed] [Google Scholar]
- 12.Ganem NJ, Cornils H, Chiu SY, et al. Cytokinesis failure triggers hippo tumor suppressor pathway activation. Cell. 2014;158(4):833–848. [DOI] [PMC free article] [PubMed] [Google Scholar]
- 13.Aylon Y, Michael D, Shmueli A, Yabuta N, Nojima H, Oren M. A positive feedback loop between the p53 and Lats2 tumor suppressors prevents tetraploidization. Genes Dev. 2006;20(19):2687–2700. [DOI] [PMC free article] [PubMed] [Google Scholar]
- 14.Yu FX, Guan KL. The Hippo pathway: regulators and regulations. Genes Dev. 2013;27(4):355–371. [DOI] [PMC free article] [PubMed] [Google Scholar]
- 15.Zhao B, Wei X, Li W, et al. Inactivation of YAP oncoprotein by the Hippo pathway is involved in cell contact inhibition and tissue growth control. Genes Dev. 2007;21 (21):2747–2761. [DOI] [PMC free article] [PubMed] [Google Scholar]
- 16.Margolis RL. Tetraploidy and tumor development. Cancer Cell. 2005;8(5):353–354. [DOI] [PubMed] [Google Scholar]
- 17.Fujiwara T, Bandi M, Nitta M, Ivanova EV, Bronson RT, Pellman D. Cytokinesis failure generating tetraploids promotes tumorigenesis in p53-null cells. Nature. 2005;437(7061):1043–1047. [DOI] [PubMed] [Google Scholar]
- 18.Apostolidis PA, Woulfe DS, Chavez M, Miller WM, Papoutsakis ET. Role of tumor suppressor p53 in megakaryopoiesis and platelet function. Exp Hematol. 2012;40(2):131–142.e4. [DOI] [PMC free article] [PubMed] [Google Scholar]
- 19.Fuhrken PG, Apostolidis PA, Lindsey S, Miller WM, Papoutsakis ET. Tumor suppressor protein p53 regulates megakaryocytic polyploidization and apoptosis. J Biol Chem. 2008;283(23):15589–15600. [DOI] [PMC free article] [PubMed] [Google Scholar]
- 20.Iancu-Rubin C, Mosoyan G, Glenn K, Gordon RE, Nichols GL, Hoffman R. Activation of p53 by the MDM2 inhibitor RG7112 impairs thrombopoiesis. Exp Hematol. 2014;42(2):137–145.e5. [DOI] [PubMed] [Google Scholar]
- 21.Mahfoudhi E, Lordier L, Marty C, et al. P53 activation inhibits all types of hematopoietic progenitors and all stages of megakaryopoiesis. Oncotarget. 2016;7(22):31980–31992. [DOI] [PMC free article] [PubMed] [Google Scholar]
- 22.Chang Y, Aurade F, Larbret F, et al. Proplatelet formation is regulated by the Rho/ROCK pathway. Blood. 2007; 109(10):4229–4236. [DOI] [PubMed] [Google Scholar]
- 23.Bluteau O, Langlois T, Rivera-Munoz P, et al. Developmental changes in human megakaryopoiesis. J Thromb Haemost. 2013;11(9):1730–1741. [DOI] [PubMed] [Google Scholar]
- 24.Gao Y, Smith E, Ker E, et al. Role of RhoA-specific guanine exchange factors in regulation of endomitosis in megakaryocytes. Dev Cell. 2012;22(3):573–584. [DOI] [PMC free article] [PubMed] [Google Scholar]
- 25.Ferguson GB, Martinez-Agosto JA. Yorkie and Scalloped signaling regulates Notch-dependent lineage specification during Drosophila hematopoiesis. Curr Biol. 2014;24(22):2665–2672. [DOI] [PMC free article] [PubMed] [Google Scholar]
- 26.Milton CC, Grusche FA, Degoutin JL, et al. The Hippo pathway regulates hematopoiesis in Drosophila melanogaster. Curr Biol. 2014;24(22):2673–2680. [DOI] [PMC free article] [PubMed] [Google Scholar]
- 27.Hartmann EM, Campo E, Wright G, et al. Pathway discovery in mantle cell lymphoma by integrated analysis of high-resolution gene expression and copy number profiling. Blood. 2010;116(6):953–961. [DOI] [PMC free article] [PubMed] [Google Scholar]
- 28.Lian I, Kim J, Okazawa H, et al. The role of YAP transcription coactivator in regulating stem cell self-renewal and differentiation. Genes Dev. 2010;24(11):1106–1118. [DOI] [PMC free article] [PubMed] [Google Scholar]
- 29.Pan D. Hippo signaling in organ size control. Genes Dev. 2007;21(8):886–897. [DOI] [PubMed] [Google Scholar]
- 30.Baccini V, Roy L, Vitrat N, et al. Role of p21(Cip1/Waf1) in cell-cycle exit of endomitotic megakaryocytes. Blood. 2001;98(12):3274–3282. [DOI] [PubMed] [Google Scholar]
- 31.Besancenot R, Chaligne R, Tonetti C, et al. A senescence-like cell-cycle arrest occurs during megakaryocytic maturation: implications for physiological and pathological megakaryocytic proliferation. PLoS Biol. 2010;8(9). [DOI] [PMC free article] [PubMed] [Google Scholar]
- 32.Yu FX, Zhao B, Panupinthu N, et al. Regulation of the Hippo-YAP pathway by G-protein-coupled receptor signaling. Cell. 2012;150(4):780–791. [DOI] [PMC free article] [PubMed] [Google Scholar]
- 33.Zhao B, Li L, Lei Q, Guan KL. The Hippo-YAP pathway in organ size control and tumorigenesis: an updated version. Genes Dev. 2010;24(9):862–874. [DOI] [PMC free article] [PubMed] [Google Scholar]
- 34.Ali A, Bluteau O, Messaoudi K, et al. Thrombocytopenia induced by the histone deacetylase inhibitor abexinostat involves p53-dependent and -independent mechanisms. Cell Death Dis. 2013;4:e738. [DOI] [PMC free article] [PubMed] [Google Scholar]
- 35.Nagaraj R, Gururaja-Rao S, Jones KT, et al. Control of mitochondrial structure and function by the Yorkie/YAP oncogenic pathway. Genes Dev. 2012;26(18):2027–2037. [DOI] [PMC free article] [PubMed] [Google Scholar]
- 36.Sankaran VG, Orkin SH, Walkley CR. Rb intrinsically promotes erythropoiesis by coupling cell cycle exit with mitochondrial biogenesis. Genes Dev. 2008;22(4):463–475. [DOI] [PMC free article] [PubMed] [Google Scholar]
- 37.LeBleu VS, O’Connell JT, Gonzalez Herrera KN, et al. PGC-1alpha mediates mitochondrial biogenesis and oxidative phosphorylation in cancer cells to promote metastasis. Nat Cell Biol. 2014;16(10):992–1003. [DOI] [PMC free article] [PubMed] [Google Scholar]
- 38.Garcia-Souza LF, Oliveira MF. Mitochondria: biological roles in platelet physiology and pathology. Int J Biochem Cell Biol. 2014;50:156–160. [DOI] [PubMed] [Google Scholar]
- 39.Ramsey H, Zhang Q, Wu MX. Mitoquinone restores platelet production in irradiation-induced thrombocytopenia. Platelets. 2015;26(5):459–466. [DOI] [PMC free article] [PubMed] [Google Scholar]
- 40.Al-Mehdi AB, Pastukh VM, Swiger BM, et al. Perinuclear mitochondrial clustering creates an oxidant-rich nuclear domain required for hypoxia-induced transcription. Sci Signal. 2012;5(231):ra47. [DOI] [PMC free article] [PubMed] [Google Scholar]
Associated Data
This section collects any data citations, data availability statements, or supplementary materials included in this article.


