

Mammalian condensin II associates with specific sites via interactions with TFIIIC and H3K4me3 and supports gene expression.
Keywords: Condensin, H3K4me3, TFIIIC, gene expression, chromosome architecture
Abstract
Structural maintenance of chromosome complexes, such as cohesin, have been implicated in a wide variety of chromatin-dependent functions such as genome organization, replication, and gene expression. How these complexes find their sites of association and affect local chromosomal processes is not well understood. We report that condensin II, a complex distinct from cohesin, physically interacts with TFIIIC, and they both colocalize at active gene promoters in the mouse and human genomes, facilitated by interaction between NCAPD3 and the epigenetic mark H3K4me3. Condensin II is important for maintaining high levels of expression of the histone gene clusters as well as the interaction between these clusters in the mouse genome. Our findings suggest that condensin II is anchored to the mammalian genome by a combination of H3K4me3 and the sequence-specific binding of TFIIIC, and that condensin supports the expression of active gene-dense regions found at the boundaries of topological domains. Together, our results support a working model in which condensin II contributes to topological domain boundary–associated gene activity in the mammalian genome.
INTRODUCTION
Structural maintenance of chromosome (SMC) complexes, which include cohesin, condensin, Smc5/6, and the dosage compensation complex, are evolutionarily conserved multisubunit complexes that play critical roles in chromosome maintenance (1). SMCs have functions in most aspects of chromosome metabolism, including three-dimensional (3D) organization, replication, repair, and segregation. Mutations in several genes encoding subunits of these complexes cause developmental disorders and human cancers. However, the underlying molecular mechanisms are not clear, but it has been argued that loss of cohesin can significantly affect gene expression and genome organization as part of the primary disease mechanism.
SMC complexes do not have intrinsic DNA sequence–specific binding. In the case of cohesin, its localization in the mammalian genome depends largely on the sequence-specific binding protein CTCF (2, 3). How other SMC complexes associate with specific regions of the genome is not known. Condensin II subunits NCAPD3 and NCAPG2 are capable of recognizing H4K20me1 and significantly overlap with sites with this histone mark in HeLa cells (4). However, it has not been examined whether the localization of condensin II depends on specific DNA binding proteins or histone modifications.
TFIIIC is a multisubunit evolutionarily conserved transcription factor that associates with RNA polymerase III (RNAPIII) to promote transcription of transfer RNAs (tRNAs) and 5S ribosomal RNA (rRNA). TFIIIC (consisting of subunits 220, 110, 102, 90, 63, and 35) has been considered as an insulator (5, 6), which could potentially serve an architectural role in vivo. TFIIIC binds to specific DNA sequence motifs termed A and B boxes. Surprisingly, when TFIIIC sites were mapped globally by chromatin immunoprecipitation (ChIP) in the mammalian genome, thousands of “extra” TFIIIC sites were discovered that were not associated with RNAPIII (7–9). Many of these sites were colocalized with RNA polymerase II. However, the function of TFIIIC at these sites is not clear.
TFIIIC and condensin physically associate in budding yeast extracts (10) and colocalize by ChIP in the yeast (11) and Drosophila melanogaster genomes (12). In budding yeast, TFIIIC and condensin help to cluster the tRNA genes that they associate with adjacent to the nucleolus and at the nuclear periphery (10). tRNAs are also clustered in a condensin-dependent manner in Schizosaccharomyces pombe (13). RNAPIII-transcribed genes interact with integral nuclear pore proteins to facilitate their processing (14). However, it is unknown whether TFIIIC and condensin physically associate in mammalian cells, or whether they colocalize at sites in addition to RNAPIII genes in the genome, and whether such colocalization is functionally important for gene expression.
We present evidence that condensin II and TFIIIC both physically interact and colocalize in the mammalian genome at sites we term condensin II–TFIIIC sites (CTS), making this an evolutionarily conserved feature of these two protein complexes. A subset of these sites corresponds to the boundaries of topological domains, where condensin II is particularly important for maintaining high levels of expression of dense gene clusters. We characterize one specific example, the histone gene cluster, and find that interactions and expression of this gene-dense, highly transcribed region depend on condensin II. TFIIIC appears to serve as a sequence-specific anchoring protein complex for condensin II in the mammalian genome. In addition, we find evidence that condensin II can recognize the active mark H3K4me3, and this also participates in the localization of condensin II to CTS. Together, these findings suggest that condensin association with chromosomes is guided by H3K4me3 and TFIIIC and that condensin II is critical to support gene expression for some highly transcribed gene-dense regions. Our findings suggest that defects in gene expression may contribute to cancers and developmental disorders caused by mutations in condensin.
RESULTS
Condensin II and TFIIIC physically associate and colocalize in mammalian genomes
Mutations affecting condensins I and II have recently been implicated in microcephaly (15) and in cancer (16, 17). Condensin is present in two types in the mammalian genome: types I and II (18). The two complexes share the coiled coil proteins SMC2 and SMC4 and are distinguished by the three additional subunits: NCAPD2, NCAPG, and NCAPH for type I and NCAPD3, NCAPG2, and NCAPH2 for type II. Despite structural similarities, the two complexes have temporal and functional differences, with type I contributing to lateral compaction of chromosomes (19) following nuclear envelope breakdown (20). Type II, in contrast, is present during interphase (20) and is required for early axial shortening in prophase (19); therefore, type II may affect chromosomal processes during interphase. We asked whether condensin II would orchestrate gene expression and, to what extent, genome organization in mammalian cells.
We first tested for a physical association between TFIIIC and known architectural proteins CTCF and cohesin using coimmunoprecipitation (co-IP) experiments with an anti–TFIIIC-220 antibody in human embryonic kidney (HEK) 293T cells and found no evidence for interactions (fig. S1, A to D). In contrast, TFIIIC pulled down condensin II (Fig. 1, A to C), and we further verified this association by reciprocally pulling down TFIIIC in co-IP experiments with cell lines that stably expressed components of the condensin II complex: Flag-NCAPH2 or Flag-SMC2 (Fig. 1, D and E). Furthermore, condensin II was also immunoprecipitated with anti-FLAG antibody from a cell line that stably expressed Flag–TFIIIC-110 (Fig. 1F). The association between TFIIIC and condensin II was stable up to 3 M salt (fig. S1E). The TFIIIC–condensin II association was further confirmed by the proximity-dependent biotin identification (BioID) method (Fig. 1, G and H) (21). Together, these data demonstrate a stable association between TFIIIC and condensin II.
Fig. 1. Condensin II and TFIIIC complexes associate in mammalian cells.
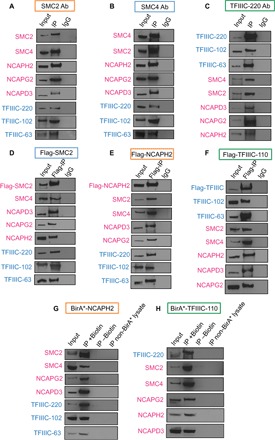
(A and B) Subunits of the TFIIIC complex (blue) were pulled down using anti-condensin (SMC2 and SMC4) antibodies (Ab) in nuclear extracts from HEK293T cells for co-IP experiments, followed by immunoblotting. IgG, immunoglobulin G. (C) All subunits of the condensin II complex (magenta) were pulled down using anti–TFIIIC-220 antibodies in co-IP, followed by immunoblotting with the indicated antibody. (D and E) Subunits of the TFIIIC complex were pulled down from nuclear extracts made from cell lines that stably expressed Flag-SMC2 or Flag-NCAPH2, followed by immunoblotting with the indicated antibody. (F) All subunits of the condensin II complex were pulled down with anti-FLAG antibody from a cell line stably expressing Flag-TFIIIC-110, followed by immunoblotting with the indicated antibody. (G) Subunits of the TFIIIC complex were pulled down from nuclear extracts derived from a cell line that stably expressed BirA*-NCAPH2 in a BioID assay. (H) BioID assays with nuclear extracts from a cell line that stably expressed BirA*-TFIIIC-110 had all subunits of the TFIIIC complex. Each experiment was performed in triplicate.
We used ChIP sequencing (ChIP-seq) to determine whether genome-wide binding of TFIIIC is colocalized in vivo with condensin II in mouse embryonic stem cells (mESCs). We found that subunits of condensin II, NCAPH2 and NCAPD3, were strongly colocalized with TFIIIC-220 binding sites (Fig. 2A and fig. S2, A and B). To explore the interrelationships in localization, we performed ChIP-seq of condensin II (NCAPH2) in TFIIIC-220 knockdown mESCs and TFIIIC-220 in condensin II (NCAPH2) knockdown mESCs. Reducing TFIIIC-220 significantly impaired the localization of NCAPH2 at tRNA genes, whereas knockdown of NCAPH2 did not affect TFIIIC-220 localization to these genes (Fig. 2, B and C, and fig. S2D). Collectively, the results suggest that the TFIIIC complex is necessary for the association of condensin II with tRNA genes.
Fig. 2. Definition of CTS in the mouse genome.
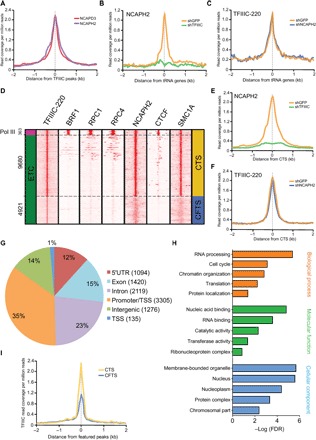
(A) NCAPH2 and NCAPD3 were colocalized with TFIIIC binding sites in mESCs based on ChIP-seq data from the present study (NCAPH2) and from Dowen et al. (NCAPD3) (33). (B and C) Knockdown of TFIIIC-90 caused a significant reduction of NCAPH2 binding to tRNA genes. However, knockdown of NCAPH2 did not alter the binding of TFIIIC-220 to tRNA genes. (D) Colocalization of TFIIIC-220 and NCAPH2 formed the basis for the definition of CTS (10,043 sites; 64.7% of total high-confidence TFIIIC sites) and CFTS (4921 sites; 32.9% of total TFIIIC sites). Pol III, RNA polymerase III. (E and F) Knockdown of TFIIIC-90 caused a significant reduction of NCAPH2 binding to CTS, whereas knockdown of NCAPH2 did not change the binding of TFIIIC to CTS. (G) Genome-wide annotation chart of CTS in mESCs. (H) Gene Ontology (GO) chart shows the localization of CTS at promoters of housekeeping genes. FDR, false discovery rate. (I) TFIIIC-220 has higher peak intensity at CTS than at CFTS. 5′UTR, 5′ untranslated region.
To examine the relationship between TFIIIC and condensin II binding and RNAPIII, we focused on a set of high-confidence peaks of TFIIIC-220 (n = 14964) for detailed analysis. TFIIIC-220 was colocalized with condensin II (NCAPH2) at RNAPIII binding sites, as indicated by colocalization with BRF1, a TFIIIB subunit, and RPC1 and RPC4, RNAPIII subunits (Fig. 2D). Surprisingly, TFIIIC-220 was also colocalized with condensin II at many more non-RNAPIII binding sites. The sites where condensin II and TFIIIC are colocalized are termed CTS herein. TFIIIC-220 has similar colocalization with cohesin (SMC1A) and condensin. However, TFIIIC-220 peaks were only colocalized with CTCF at the RNAPIII binding sites (Fig. 2D). The TFIIIC binding sites at which NCAPH2 peaks were absent are termed condensin-free TFIIIC sites (CFTS) (Fig. 2D) and serve in contrast to CTS.
We found that TFIIIC was necessary for condensin II association with all CTS, not just tRNA genes. Knockdown of TFIIIC-220 significantly reduced the binding of NCAPH2 to the CTS, whereas knockdown of NCAPH2 did not affect the binding of TFIIIC-220 to the CTS (Fig. 2, E and F, and fig. S2E) or CFTS (fig. S2F). Thirty-five percent of CTS were at promoters or annotated transcription start sites (TSSs) (Fig. 2G) as compared to only 4% of CFTS (fig. S2G). Considering the enrichment of CTS at promoters, we probed the correlation between CTS and expression levels. The protein-coding genes were divided into three categories—high, moderate, and low expression—based on mESC RNA sequencing (RNA-seq) data. The binding intensity of both NCAPH2 and TFIIIC-220 at TSS positively correlated with gene expression levels (fig. S3, A and B). In addition, we found that CTS were correlated with both the promoters of highly expressed genes and deoxyribonuclease hypersensitive sites (figs. S3, D and E, and S4). The promoters of housekeeping genes were strongly enriched at CTS (Fig. 2H). Therefore, CTS are associated with transcriptional activity.
CTS had additional features suggesting that they play a distinct role in genome topology compared to CFTS. For example, architectural proteins such as cohesin are highly enriched at CTS but not at CFTS (fig. S5A). CTCF appears slightly enriched at CTS in metagene analysis due to the colocalization at the RNAPIII genes (fig. S5A). Proteins indicative of transcriptional activity (for example, p300 and RNA polymerase II) are also enriched at CTS but not at CFTS (fig. S5, B to D). There were significantly more CpG islands, together with higher levels of GC content, around CTS than CFTS (fig. S6, A and B). CpG islands are important for initiating transcription (22), consistent with the finding that CTS are associated with higher expression levels than CFTS. Furthermore, CTS were enriched for a motif similar to the consensus B box motif of both human and mouse tRNA genes. The motif was enriched in CFTS but in a reverse orientation (fig. S6, C and D). CFTS had 48 ± 0.7% lower TFIIIC peak intensity than CTS (Fig. 2I). These findings suggest that CTS, having more TFIIIC signal and enrichment of architectural proteins and proteins with transcriptional activity, may play a distinct role in genome topology compared to CFTS.
We performed ChIP-seq experiments of NCAPH2 and TFIIIC-220 on HEK293 cells to examine whether CTS are also present in human cells. First, we identified a set of high-confidence peaks of TFIIIC-220 (n = 15,796) for detailed analysis. We found that TFIIIC-220 peaks were also strongly colocalized with those of NCAPH2 (Fig. 3A), allowing us to define the locations of CTS in the human genome. Similar to the mESCs, TFIIIC-220 was colocalized with condensin II (NCAPH2) at RNAPIII binding sites, as indicated by colocalization with BRF1, a TFIIIB subunit, and PRC32, a subunit of RNAPIII (Fig. 3B). TFIIIC-220 was also colocalized with condensin II at CTS, confirming that the colocalization of condensin and TFIIIC is evolutionarily conserved from yeast to human. TFIIIC-220 has similar colocalization with cohesin (SMC1A) at CTS. However, TFIIIC-220 peaks were only colocalized with CTCF at the RNAPIII binding sites (Fig. 3B). Consistent with the mESCs, we found that CTS were correlated with the promoters of highly expressed genes or housekeeping genes in human cells (Fig. 3, C and D, and fig. S7, A and B), suggesting that CTS are associated with high levels of transcription. When NCAPH2 was knocked down in either mouse or human cells, gene expression was reduced at housekeeping genes, including genes involved in translation and RNA processing (fig. S7, C to E). Overall, these findings are similar between the mouse and human genomes.
Fig. 3. Identification of CTS in the human genome.
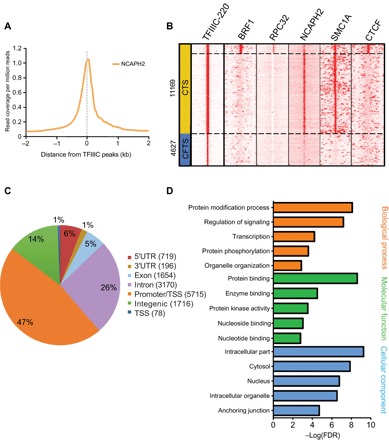
(A) NCAPH2 and NCAPD3 were colocalized with TFIIIC binding sites in human HEK293 cells based on ChIP-seq data from the present study. (B) Colocalization of TFIIIC-220 and NCAPH2 formed the basis for the definition of CTS (11,169 sites; 70.7% of total high-confidence TFIIIC sites) and CFTS (4627 sites; 29.3% of total TFIIIC sites). (C) Genome-wide annotation chart of CTS in HEK293 cells. (D) GO chart shows the localization of CTS at promoters of housekeeping genes.
Condensin II interacts and colocalizes with trimethylated H3K4
We examined the colocalization of NCAPH2 and TFIIIC-220 peaks with the active promoter mark H3K4me3, the active enhancer mark H3K27ac, as well as transcriptionally repressive marks such as H3K9me3 and H3K27me3. We found that CTS, but not CFTS, were strongly colocalized with active marks. There was no significant colocalization with repressive marks for either CTS or CFTS (Fig. 4A). This prompted us to investigate whether H3K4me3 and H3K27ac histone marks could interact with condensin II to facilitate its localization. We used either H3K4me3- or H3K27ac-modified histone peptides to study the physical association with condensin II (fig. S8A). Streptavidin pulled down condensin II with a biotinylated H3K4me3 histone peptide but not with an H3K27ac histone peptide (Fig. 4, B and C), suggesting that H3K4me3 could play an important role in localizing condensin II.
Fig. 4. The condensin II complex interacts with H3K4me3.
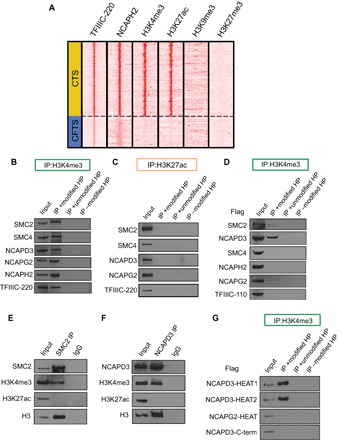
(A) H3K4me3 and H3K27ac, but not H3K9me3 or H3K27me3, colocalized with CTS. (B and C) Pull-down assays were performed by mixing nuclear extracts from HEK293T cells with biotinylated histone peptides (HP) modified as indicated. Condensin II and TFIIIC-220 were pulled down with H3K4me3, but not H3K27ac, histone peptides. (D) Pull-down assays were performed by mixing full-length proteins of condensin II generated by in vitro translation with biotinylated histone peptides with and without H3K4me3 modification. NCAPD3 and SMC2 interacted with the H3K4me3 histone peptide. (E and F) Co-IP with anti-SMC2 and anti-NCAPD3 antibodies pulled down chromatin with H3K4me3, but not H3K27ac. (G) HEAT repeat domains from NCAPD3 or NCAPG2 and the C terminus of NCAPD3 were identified and cloned out as described (4). Pull-down assays were performed by mixing HEAT repeat domains from NCAPD3 or NCAPG2 or the C terminus of NCAPD3 with biotinylated H3K4me3 histone peptides. HEAT repeat domains from NCAPD3 interacted with the H3K4me3 peptide. Three independent experiments were performed for each assay.
We identified NCAPD3 as the subunit of condensin II that interacts with the H3K4me3 mark by individually expressing each subunit using in vitro translation followed by co-IP with H3K4me3 histone peptides (fig. S8B). As shown in Fig. 4D, NCAPD3 strongly, and SMC2 to a lesser extent, interacted with the H3K4me3 histone peptide, whereas NCAPG2 showed little interaction with the H3K4me3 histone peptide. Chromatin with H3K4me3 was pulled down by both SMC2 and NCAPD3 antibodies (Fig. 4, E and F). However, SMC2 and NCAPD3 antibodies did not pull down chromatin with H3K27ac (Fig. 4, E and F). In addition, TFIIIC-220 did not interact with either H3K4me3 or H3K27ac (fig. S8C).
The HEAT repeat domains of fungal condensin subunits Ycg1 and Ycs4 are critical for DNA binding (23), whereas the HEAT repeats of human NCAPD3 interact with a histone mark (4). We used co-IP to examine whether the HEAT repeat domains of NCAPD3 or NCAPG2 and the C terminus of NCAPD3 interact with a biotinylated histone peptide. We found that the two predicted HEAT repeat domains of NCAPD3 were pulled down by H3K4me3 histone peptide, whereas the HEAT repeat cluster of NCAPG2 showed little, if any, interaction (Fig. 4G). As a control, H3K4me3 histone peptide did not pull down the C terminus of NCAPD3 (Fig. 4G). Together, these results suggest that condensin II can recognize H3K4me3 through the HEAT repeat domains of NCAPD3, which could facilitate chromatin association.
To determine whether H3K4me3 was necessary for condensin II binding in vivo, we used knockdown of WDR5 or SET1 by small interfering RNA (siRNA) in HEK293T cells to decrease H3K4me3 levels (fig. S9) (24). WDR5 encodes a WD repeat–containing protein that is part of the COMPASS complex responsible for methylation of H3K4, whereas SET1 encodes the histone methyltransferase (25). Protein expression of condensin II and TFIIIC complexes did not change (fig. S9). NCAPH2 binding at CTS was significantly reduced by both SET1 and WDR5 knockdown compared to the control, consistent with H3K4me3 being important to guide the association of condensin II with the genome (fig. S9). However, the binding of TFIIIC-220 at CTS was also reduced in WDR5 knockdown cells, which may be due to the pleiotropic effect associated with the reduction of WDR5. These results add further support for H3K4me3 participating in specification of CTS.
CT sites are located at the boundaries of topological domains
Topologically associated domains (TADs) form fundamental units of genome organization (26), and factors that are associated with TAD boundaries are likely to be key regulators for genome organization. We found that CTS, but not CFTS, are significantly enriched at TAD boundaries in mESCs (Fig. 5A and fig. S10A). Twenty-eight percent of all CTS are associated with a TAD boundary (located within 50 kb) (Fig. 5B), in contrast to 13% TAD boundary association of random control peaks by chance (P = 2.1 × 10⁻¹⁶, χ2 test), and conversely, 60% of all TAD boundaries contain CTS (fig. S10B). Many TAD boundary–associated CTS are located at promoters/TSS in highly expressed housekeeping genes (fig. S10, C and D). The data available for TAD boundaries in the mouse genomes are relatively low resolution compared to higher-resolution Hi-C data published more recently for the human genome (27).
Fig. 5. Condensin II and TFIIIC are colocalized at TAD boundaries.
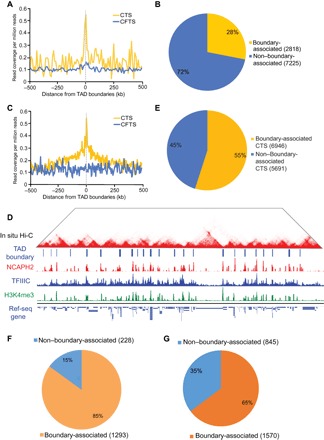
(A) CTS, but not CFTS, were enriched at TAD boundaries in mESCs. (B) Twenty-eight percent of CTS were within 50 kb of a TAD boundary in mESCs, in contrast to 13% TAD boundary association of random control peaks by chance (P = 2.1 × 10⁻¹⁶, χ2 test). (C) CTS, but not CFTS, were enriched at TAD boundaries in human HEK293 cells. (D) Representative image from a genome browser showing tracks of in situ Hi-C and ChIP-seq of NCAPH2, TFIIIC-220, and H3K4me3. (E) Fifty-five percent of CTS were within 50 kb of a TAD boundary in mESCs, in contrast to 41% TAD boundary association of random control peaks by chance (P = 2.11 ×10⁻⁸, χ2 test). (F) The total number of genes that are significantly down-regulated upon condensin knockdown is 1516 in mESCs. Eighty-five percent (1293) of genes that were significantly down-regulated upon NCAPH2 knockdown were within 50 kb of a TAD boundary. (G) A total of 2415 genes are significantly down-regulated upon condensin knockdown in HEK293 cells. Sixty-five percent (1570) of genes that were significantly down-regulated upon NCAPH2 knockdown were within 50 kb of a TAD boundary.
In HEK293 cells, CTS, but not CFTS, are significantly enriched at TAD boundaries (Fig. 5, C and D). Fifty-five percent of all CTS are associated with TAD boundary in HEK293 cells, in contrast to the 41% of random control peaks (P = 2.11 × 10⁻⁸, χ2 test) (Fig. 5E), whereas 37% of all TAD boundaries contain CTS (fig. S11A). Although this pattern has been reported in the Drosophila genome (12), our findings suggest that the colocalization with boundaries is an evolutionarily conserved feature in mammalian genomes. This localization pattern suggests that these proteins might play an evolutionarily conserved architectural role. Like mESCs, TAD boundary–associated CTS are located at promoters/TSS of highly transcribed genes in HEK293 cells (fig. S11, B and C). As might be expected, CTS are negatively correlated with LAD and LOCK domains in mESCs (fig. S12), which tend to be transcriptionally inactive. Furthermore, boundaries with multiple CTS are especially strong. Forty-six percent of CTS were present in clusters of multiple sites, of which 30% are boundary-associated, with a similar number of nonclustered CTS associated with boundaries in the mouse genome (fig. S13A). Strikingly, we found that clustered CTS coincide with stronger boundaries than the nonclustered CTS (insulation score, −0.423 ± 0.01 versus −0.321 ± 0.02) (fig. S13, B and C), indicating that the clustered CTS are associated with stronger boundaries. Our results suggest a potentially different mechanism between CTS and CTCF in TAD boundary association: CTS are associated with strong boundaries when they are clustered together, whereas CTCF can work as an individual “roadblock” with a single binding site. Deletion of a single Ctcf binding site can significantly abrogate insulator activity (28, 29). Because CTS are present in multiple instances at a boundary, deleting a single site is unlikely to be sufficient for boundary disruption.
Boundaries of TADs are characterized by gene density and high transcriptional activity (30). Gene expression analysis revealed that most genes significantly down-regulated in NCAPH2 knockdown mESCs are located within 50 kb of a TAD boundary (85% versus 16% random genes by chance; P = 5 × 10⁻¹³, χ2 test) (Fig. 5F). In human cells with NCAPH2 knockdown, 65% of the significantly down-regulated genes were located within 50 kb of a boundary (65% versus 13% random genes by chance; P = 3 × 10⁻¹⁰, χ2 test) (Fig. 5G). Therefore, the incidence of CTS is highly correlated with transcriptionally active gene-dense boundary regions in mammalian genomes, and the expression of these regions depends on condensin II.
Condensin II facilitates expression and interactions at the histone gene clusters
To test the architectural role of CTS, we used the histone gene clusters in the mouse genome. Two histone loci on chromosome 13 of the mouse genome hold 44 highly transcribed histone genes, which form TAD boundaries containing multiple CTS with H3K4me3 histone modification. On the basis of the low insulation scores, the two histone gene clusters coincide with strong TAD boundaries. The two loci are separated by a highly transcriptionally inactive TAD (fig. S14). There were strong interactions between the two histone gene loci, as revealed by visualizing a 2D interaction matrix (26). To functionally test if condensin II plays a role in the interaction of the two boundaries containing the histone genes, we performed 4C sequencing (4C-seq) experiments with NCAPH2 knockdown in mESCs together with a green fluorescent protein (GFP) knockdown control. As shown in Fig. 6A, the interaction between the two histone gene loci was significantly reduced (1.86 ± 0.25–fold change, P = 7.81 × 10⁻⁸) in NCAPH2 knockdown cells, indicating that condensin II is important in mediating the interaction between the two loci. We speculate that these types of interactions could contribute to condensin II–dependent chromosome morphology.
Fig. 6. Condensin II supports interaction and expression of histone gene clusters.
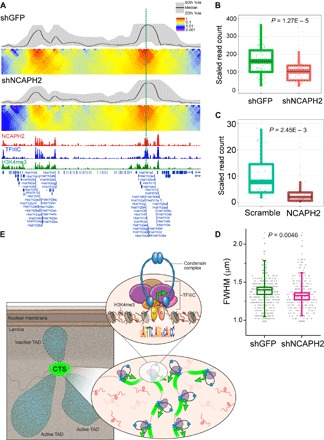
(A) Contact profiles of control and NCAPH2 knockdown mESCs at histone gene loci measured by 4C-seq. Knockdown of NCAPH2 reduced interactions between two histone gene loci (1.86 ± 0.25–fold change, P = 7.81 × 10⁻⁸). The green dotted line indicates the anchor point. (B) Knockdown of NCAPH2 by short hairpin RNA (shRNA) in mESCs significantly reduced the expression of histone genes in the loci shown in (A). Error bars, SEM. (C) Knockdown of NCAPH2 in HEK293 cells by siRNA significantly reduced the expression of histone genes. Error bars, SEM. (D) The size of the histone clusters in NCAPH2 knockdown mESCs is significantly smaller than the sizes of control cells, indicating that the formation of the clusters is disrupted in NCAPH2 knockdown cells. Fluorescent staining was performed with an antibody to NPAT, a protein that labels the histone clusters (31). Error bars, SD. FWHM, full width at half maximum. (E) Working model for how condensin II and TFIIIC complexes tether dense active promoters in the mammalian genome: Condensin II and TFIIIC complexes (CTS) are colocalized at densely clustered active promoters at TAD boundaries. Condensin II may support the expression of the genes within the boundaries. Some TADs associated with the lamina are less transcriptionally active. The lower right inset shows interaction between CTS that are associated with transcriptionally active promoters. The upper right inset depicts details of the CTS, including condensin II (H, NCAPH2; D, NCAPD3; G, NCAPG2), the TFIIIC complex, the B box–like sequence, and the H3K4me3 histone modification. Condensin II may be recruited to the chromatin, in part, by the HEAT domain of NCAPD3 binding to the H3K4me3 histone modification and, in part, by the interaction with TFIIIC.
The interaction might be important for maintaining high expression because RNA-seq of NCAPH2 knockdown cells showed that the expression of histone genes in these loci was down-regulated (Fig. 6B). Condensin II also facilitated the interaction of the histone locus on chromosome 3 with another gene-dense boundary–associated active region in a similar 4C experiment (fig. S15). RNA-seq in condensin II knockdown HEK293 cells revealed a similar loss of expression of the histone genes, as observed in mESCs (Fig. 6C). However, the organization of the human histone gene clusters is not syntenic with mouse, so the interaction between clusters is not apparent from the in situ Hi-C data because they are on different chromosomes (27). Despite this, the expression of histone gene clusters depends significantly on condensin in both genomes.
To further examine the organization of the histone gene clusters in the mouse genome, we visualized the histone locus bodies with an antibody to the marker NPAT (31). We observed a significant shrinkage of the histone locus bodies upon condensin knockdown, suggesting that their formation may be compromised (Fig. 6D and fig. S16). Collectively, these results suggest a working model whereby (i) condensin is recruited to its binding sites via interactions with both H3K4me3 and TFIIIC and (ii) some gene-dense regions, such as the histone loci at TAD boundaries in the mouse genome, may both interact and be expressed in a condensin II–dependent manner (Fig. 6E).
DISCUSSION
Our findings reveal TFIIIC and H3K4me3 as factors contributing to the recruitment of condensin II to the genome and suggest a role for condensin II in gene expression and genome architecture. Mutations in condensin have been associated with cancer (16, 17) and microcephaly (15). In the case of microcephaly, mutations cause decatenation failure at mitosis, which leads to micronucleus formation and increased aneuploidy (15). A mutation in Ncaph2 causes T cell lymphoma in a mouse model through tissue-specific genome instability, in the absence of significant changes in gene expression (17). Our findings argue that loss of condensin II can alter gene expression and, in particular, lower histone gene expression, which could affect chromosome structure. Our work suggests a novel functional role for condensin II in supporting interactions between active gene-dense regions at TAD boundaries (Fig. 6E), adding to previous work supporting a role for condensin II in genome organization in Caenorhabditis elegans and Drosophila (12, 32). Architectural proteins (for example, CTCF, cohesin, TFIIIC, and condensin), active histone marks, and the density of highly active genes at TAD boundaries may be common underlying features determining genome architecture in the eukaryotic nucleus, which may account for the conserved nature of TADs across different species (26). Our study is the first to implicate condensin II and TFIIIC as part of these themes in the mammalian genome. Furthermore, genome-wide analysis suggests that expression of gene-dense clusters at TAD boundaries is partly dependent on condensin II. In addition, there are many CTS within TADs; given that CTS are localized at active promoters and enhancers, we speculate that these intra-TAD CTS may also be involved in DNA-DNA contacts, for example, enhancer-promoter interactions (33), but this remains to be tested. A continuing important goal is to identify fundamental functions of condensin to more fully appreciate the underlying molecular mechanisms in human diseases caused by mutations in condensin.
Epigenetic modifications such as H3K4me3 may help specify the sites where condensin II is loaded, suggesting that nonarchitectural factors such as epigenetic marks could contribute to chromosome conformation. In this way, epigenetic marks may regulate gene expression via their contribution to 3D genome architecture (34). CTCF is thought to provide the sequence specificity for cohesin association with chromatin. In an analogous manner, TFIIIC may provide sequence specificity for condensin II association with the genome. CTCF does not associate with condensin II or TFIIIC, making condensin II–TFIIIC an independent interacting pair. The independence from CTCF is further emphasized by the genomic locations of CTS and CTCF: Many CTS are localized at active gene promoters, whereas most CTCF is localized at intergenic regions (35). Our knockdown experiment suggests that TFIIIC is necessary for the localization of condensin II. However, TFIIIC does not appear to be sufficient for condensin II localization because CFTS exist. In addition, some condensin II is not colocalized with TFIIIC, suggesting that additional proteins may be involved in its localization. Our working model for the large number of sites with condensin and TFIIIC is that TFIIIC recognizes the B box–like motif and the interaction between condensin II and both TFIIIC and H3K4me3 facilitates condensin II recruitment (Fig. 6E). Although the function of CFTS remains to be discovered, our study provides the first functional implication of a large fraction of extra TFIIIC sites for TAD boundary–associated gene activity in the mammalian genome through colocalization of condensin II.
MATERIALS AND METHODS
Cell culture conditions
ES cells
V6.5 mESCs (Novus Biologicals) were grown on irradiated mouse embryonic fibroblasts (MEFs). Cells (8.6 × 10⁶) were grown on 0.1% gelatinized (07903, Stemcell Technologies) 150-mm tissue culture plates in ESC-c medium: Dulbecco’s modified Eagle’s medium (DMEM) supplemented with 15% fetal bovine serum (FBS) (SH30070.03, Hyclone), 1× β-mercaptoethanol (ES-007-E, Millipore), nonessential amino acids (07600, Stemcell Technologies), 1× GlutaMAX (07100, Stemcell Technologies), and penicillin/streptomycin (50 μg/ml; 07500, Stemcell Technologies).
Irradiated MEFs
Low-passage irradiated MEFs were grown on 150-mm tissue culture plates 48 hours before seeding the ES cells in ESC-c medium described above.
HEK293T
Low-passage HEK293T cells were cultured in DMEM (11995, Thermo Fisher Scientific) supplemented with 10% FBS (16000-044, Thermo Fisher Scientific) and penicillin/streptomycin (100 U/ml; 15140-122, Thermo Fisher Scientific) at 37°C in 5% CO2. Medium was changed every 24 hours. All the cell lines were tested and confirmed to be free of mycoplasma contamination.
Lentivirus-based RNA interference knockdown in mESCs
Lentiviral particle preparation and infection were performed as previously described, with some modifications (1). Briefly, 70% confluent HEK293T cells in a 150-mm tissue culture plate were cotransfected with 8 μg of mouse CAPH2 shRNA construct (TRCN0000175785, Sigma-Aldrich) or GTF3C4 shRNA construct (TRCN0000084577, Sigma-Aldrich) or GFP shRNA (#30323, Addgene), 6 μg of psPAX2 packaging plasmid (#12260, Addgene), and 2 μg of pMD2.G envelop plasmid (#12260, Addgene) with 40 μl of Lipofectamine 2000 (11668027, Thermo Fisher Scientific). The ESC-c medium was replaced after 16 hours of transfection. The medium containing lentiviral particles was collected 48 and 72 hours after the transfection. The medium was filtered through a Nalgene 0.45-μm syringe filter (724-2045, Thermo Fisher Scientific) and concentrated by ultracentrifuge at 25,000 rpm in an SW 41 Ti rotor (Beckman Coulter) for 2 hours at 4°C. The V6.5 ES cells were infected with concentrated lentiviral particles in ESC-c medium containing polybrene (8 μg/ml; H9268, Sigma-Aldrich). Twenty-four hours after infection, the medium was replaced with puromycin (2 μg/ml; ant-pr-1, Invivogen) for 5 days to select for stable integration of the shRNA construct. The medium with puromycin was changed daily. The GFP and NIPBL knockdown cells were grown one passage off feeders before harvesting for protein extraction and RNA isolation.
Western blotting
Western blotting was performed as described, with some modifications (2). Briefly, HEK293T cells were trypsinized by 0.05% trypsin-EDTA (25300-054, Thermo Fisher Scientific). After washing with phosphate-buffered saline (PBS) (20012-027, Thermo Fisher Scientific), cells were collected and the pellet was lysed in ice-cold nuclei lysis buffer [5 mM Pipes (pH 8.0), 85 mM KCl, 0.5% NP-40, and protease inhibitor (11836170001, Roche)] on ice for 10 min, followed by centrifugation at 500g for 10 min at 4°C. After centrifugation, the isolated nuclear pellet was collected and resuspended in lysis buffer [50 mM Hepes (pH 7.9), 5 mM MgCl2, 0.2% Triton X-100, 20% glycerol, 300 mM NaCl, and protease inhibitor] on ice for 30 min, followed by centrifugation at 12,000g for 20 min at 4°C. After centrifugation, the supernatant was collected as the nuclear protein extract. The total amount of protein in the nuclear extract was quantified by the Lowry method (5000111, Bio-Rad). NuPAGE LDS loading buffer (NP0007, Thermo Fisher Scientific) was added to each sample containing 25 μg of total protein before boiling at 92°C. The resulting sample mixture was electrophoresed under reducing conditions through a NuPAGE 4-12% Bis-Tris protein gel (NP0322BOX, Thermo Fisher Scientific). The resolved proteins were electroblotted on an Immobilon-P polyvinylidene difluoride membrane (IPVH00010, Millipore) using wet transfer at 100 V for 90 min at 4°C. The membranes were blocked with 1% bovine serum albumin in 0.5% Tween 20–PBS (PBST) for 60 min before an overnight incubation with primary antibody at 4°C. The membranes were then probed with a horseradish peroxidase (HRP)–conjugated secondary antibody at a dilution of 1:3000 for 1 hour at room temperature. The membranes were developed with an enhanced chemiluminescence detection system (ECL reagents) (32132, Thermo Fisher Scientific) and then exposed to an x-ray film or scanned by a Typhoon scanner (GE Amersham Molecular Dynamics Typhoon 9410). The signal intensities were quantified using ImageJ (U.S. National Institutes of Health) and normalized with the housekeeping protein α-tubulin.
Protein co-IP
Nuclear protein extraction was performed as in Western blotting. For each sample, 1 mg of the nuclear protein extract was incubated with the antibody overnight with rotation at 4°C. The protein A/G dynabeads were washed once with PBS for 5 min with rotation, followed by lysis buffer [50 mM Hepes (pH 7.9), 5 mM MgCl2, 0.2% Triton X-100, 20% glycerol, 300 mM NaCl, and protease inhibitor] for 5 min with rotation. The nuclear extract was transferred to the dynabeads and incubated for 2 hours with rotation at 4°C. The samples were washed three times, 5 min each, with lysis buffer with rotation at 4°C. The proteins were eluted by adding elution buffer [50 mM tris (pH 8.3), 1 mM EDTA, 1% SDS] and shaking on a heating block at 1400 rpm for 10 min at 65°C. Eluted proteins were subjected to immunoblotting.
Cloning procedures
Full-length genes of the condensin II complex, including SMC2, SMC4, N-CAPH2, N-CAPD3, and N-CAPG2, and HEAT repeats of N-CAPD3 and N-CAPG2 were polymerase chain reaction (PCR)–amplified from complementary DNA (cDNA) templates (Open Biosystems or OriGene). The full-length cDNA templates were digested by restriction enzymes and cloned into either Flag pcDNA5/FRT plasmids (gift from J. Conaway and R. Conaway) or the pcDNA3.1 mycBioID (#35700, Addgene).
Generation of stable cell lines
HEK293 cells stably expressing NCAPH2 and TFIIIC were generated using either pcDNA5/FRT/FLAG plasmids and the Flp-in system or pcDNA3.1 mycBioID. 293FRT cells were 60% confluent for transfection. FuGENE HD (16 μl, E2311, Promega) was added to 4 μg of plasmid in 800 μl of Opti-MEM (31985062, Thermo Fisher Scientific), followed by incubation in the hood for 15 to 30 min at room temperature. The mixture was added dropwise to the cells. On day 3, the cells were split 1:6 to 1:10 and spun down at 200g for 5 min, followed by resuspension in DMEM (11995, Thermo Fisher Scientific), supplemented with 10% FBS (16000-044, Thermo Fisher Scientific) and hygromycin (100 μg/ml; 10687010, Thermo Fisher Scientific). Medium was changed every 3 to 4 days for a total of three changes. A 24-well plate with 2 ml of TrypLE (12563-011, Thermo Fisher Scientific) per well was prepared. Individual colonies were extracted using a pipette and added to the 24-well plate for expansion. Cells were harvested to confirm protein expression by immunoblotting. The positive cells were expanded for the experiments. The same procedure was used for making pcDNA3.1 mycBioID stable cell lines, except for using G418 (500 μg/ml; 10131035, Thermo Fisher Scientific) for selection instead.
Antibodies
Antibodies recognizing SMC2 (A300-058A), SMC4 (A300-064A), NCAPH2 (A302-275A), NCAPD3 (A300-604A), NCAPG2 (A300-605A), TFIIIC-220 (A301-291A), TFIIIC-102 (A301-238A), TFIIIC-63 (A301-242A), SET1 (A300-290A), and NPAT (A302-772A) were purchased from Bethyl Laboratories. Anti-SMC3 antibody (sc-292645) was purchased from Santa Cruz Biotechnology. Anti-RAD21 antibody (05-908) was purchased from Millipore. Antibodies recognizing H3K4me3 (39915), H3K27ac (39133), and WDR5 (61485) were purchased from Active Motif. Antibodies recognizing CTCF (ab70303) and H3 (ab1791) were purchased from Abcam. Flag-HRP (A8592) and α-tubulin (T6199) antibodies were purchased from Sigma-Aldrich.
Histone peptide pull-down assay
Both H3K4me3 and H3K27ac biotinylated histone peptides, modified and unmodified, were purchased from AnaSpec [H3K4me3, AS-64357-025; H3K27ac, AS-64637-025; H3 (1-21), AS-65207-025; H3 (21-44), AS-65241-025]. The peptides were resuspended with nuclease-free water to a stock concentration of 1 mg/ml and immediately aliquoted and stored at −80°C. The assays were performed as described, with some modifications. Biotinylated peptide (20 μg) was incubated with 2 mg of nuclear extract in lysis buffer [50 mM Hepes (pH 7.9), 5 mM MgCl2, 0.2% Triton X-100, 20% glycerol, 300 mM NaCl, and protease inhibitor] overnight at 4°C with rotation. Streptavidin C1 dynabeads (40 μl, 65001, Thermo Fisher Scientific) were washed with PBS for 5 min with rotation, followed by blocking with bovine serum albumin (BSA) (Fisher Scientific, BP1600-100) for 1 hour with rotation and then washing with lysis buffer for 5 min with rotation. The mixture was added to the dynabeads and incubated for 2 hours at 4°C with rotation. The beads were washed with lysis buffer five times, 5 min each, with rotation at 4°C, before adding elution buffer [50 mM tris (pH 8.3), 1 mM EDTA, 1% SDS]. Proteins were eluted by shaking on a heating block at 1400 rpm for 10 min at 65°C.
BioID pull-down
Cells were grown to 70 to 80% confluency in a six-well plate. Medium was changed with DMEM (11995, Thermo Fisher Scientific) with 50 μM biotin (B4501-500MG, Sigma-Aldrich). Cells were incubated for 24 hours before being harvested. The pull-down experiments were performed with identical protocol as described in the previous section. Briefly, 2 mg of nuclear extracts in lysis buffer [50 mM Hepes (pH 7.9), 5 mM MgCl2, 0.2% Triton X-100, 20% glycerol, 300 mM NaCl, and protease inhibitor] was incubated with 40 μl of Streptavidin C1 dynabeads (65001, Thermo Fisher Scientific) overnight at 4°C with rotation. The beads were washed with lysis buffer five times, 5 min each, with rotation at 4°C, before adding elution buffer [50 mM tris (pH 8.3), 1 mM EDTA, and 1% SDS]. Proteins were eluted by shaking on a heating block at 1400 rpm for 10 min at 65°C.
In vitro translation
In vitro translation was carried out using TnT Quick Coupled Transcription/Translation System (L1170, Promega) following the manufacturer’s protocol. Briefly, TnT T7 Quick Master Mix was thawed quickly by hand, whereas the other components were thawed on ice. A reaction mixture (50 μl) was prepared. TnT T7 Master Mix (25 μl) was mixed with 2 μl of TnT Reaction Buffer, 1 μl of TnT RNA Polymerase, 2 μl of Complete Amino Acid Mix (L4461, Promega), 1 μl of RNasin Ribonuclease Inhibitor (N2511, Promega), 2 μl of DNA plasmid, and 17 μl of nuclease-free water. The reaction mixture was mixed thoroughly and incubated at 30°C for 90 min. Immunoblotting was performed to confirm successful translation.
siRNA transfection
ON-TARGETplus human WDR5 siRNA was purchased from Dharmacon (L-013383-00-0005). Human SET1 siRNA (sc-76484) and control human siRNA were purchased from Santa Cruz Biotechnology (sc-37007). siRNAs were resuspended with nuclease-free water to a final concentration of 40 μM, which was immediately aliquoted and stored at −80°C. HEK293T cells in 100-mm plates (~2 × 10⁶ cells per plate) were transfected with 30 nM siRNA using Lipofectamine RNAiMAX Transfection Reagent (13778075, Thermo Fisher Scientific), following the manufacturer’s instructions. Briefly, 15 μl of RNAiMAX Transfection Reagent was diluted with 250 μl of Opti-MEM (31985062, Thermo Fisher Scientific). siRNA (30 nM) was also diluted with 250 μl of Opti-MEM. The diluted siRNA was added and mixed with the diluted RNAiMAX Transfection Reagent (1:1 ratio), followed by incubation for 5 min. The siRNA–RNAiMAX Transfection Reagent complex was added to HEK293T cells. The transfection was repeated the following day before the cells were harvested for immunoblotting and ChIP.
Immunofluorescence
The cells were washed once with PBS and were quickly fixed with 4% paraformaldehyde (15700, Electron Microscopy Sciences) for 10 min, followed by permeabilization with 0.2% Triton X-100 for 10 min. After washing with PBS for 5 min, the cells were blocked with 3% BSA in PBST for 60 min at 4°C. The cells were incubated with NPAT primary antibodies (A302-772A, Bethyl) in blocking solution overnight at 4°C. The cells were then washed three times with PBS for 5 min each, followed by a 1-hour incubation of secondary antibodies conjugated with Alexa Fluor dyes (Life Technologies) in blocking solution at room temperature. After washing, the cells were counterstained with 4′,6-diamidino-2-phenylindole (DAPI) (561165, Life Technologies) for 10 min before performing imaging with the UltraVIEW Spinning Disk confocal microscope (PerkinElmer), equipped with a CSU-X1 Yokogawa disc, and run with Volocity software. A 100× 1.46–numerical aperture Plan Apochromat objective was used, and an Orca-R2 camera was used for image collection. Imaging of DAPI and Alexa Fluor 488 was carried out with the 405- and 488-nm laser lines, respectively, with a 405/488/561/633 quadruple-band dichroic. For the green channel, a band-pass emission filter (500 to 550 nm) was used, and for DAPI acquisition, a dual-band emission filter (415 to 475 nm and 580 to 650 nm) was used. Z-stacks were acquired with a 0.3-μm step size.
Image quantification
Image processing was completed in ImageJ software. Images were smoothed with a Gaussian blur using a 1-pixel radius, and the background was subtracted using the rolling ball background subtraction of 25 pixels.
Each image stack was sum-projected, and NPAT clusters in the projection were selected using the ImageJ Find Maxima command with a noise tolerance of 1000. To include only clusters found within the nucleus, the DAPI channel was masked using the Huang threshold, and any spots outside of the DAPI mask were not included. The width of each spot was calculated by fitting an area of pixels around the cluster to a 2D Gaussian using a grid search algorithm. The SD of the fit was extracted as a measure of width.
The distribution of widths of the clusters was very clearly bimodal (see fig. S14, A and B). To directly compare the size of the clusters, based on the distributions, we selected a cutoff of 0.99 μm and compared the sizes of clusters above this. To determine the number of clusters per cell, the total number of clusters above 0.99 μm per image was divided by the total nuclei per image.
Chromatin immunoprecipitation
Cells were washed with PBS twice before adding 1% formaldehyde for 10 min at room temperature with gentle rocking. The formaldehyde was quenched by adding freshly prepared glycine for 10 min with gentle rocking. The cells were washed with ice-cold PBS twice before trypsinization. The cells were pelleted by centrifugation at 500g for 5 min at 4°C. The pellet was resuspended in ice-cold nuclear lysis buffer [50 mM Hepes (pH 7.9), 5 mM MgCl2, 0.2% Triton X-100, 20% glycerol, 300 mM NaCl, and protease inhibitor] on ice for 10 min, followed by centrifugation at 500g for 5 min at 4°C. The isolated nuclei pellet was resuspended in 0.1% SDS lysis buffer [50 mM Hepes (pH 7.5), 150 mM NaCl, 1 mM EDTA, 1% Triton X-100, 0.1% sodium deoxycholate, 0.1% SDS, and protease inhibitor] on ice for 30 min. The chromatin was sheared using a Covaris sonicator (S220) to a size range of 300 to 700 base pairs (bp). The resulting sheared chromatin was spun at 20,000g for 10 min at 4°C. The chromatin samples were incubated with 6 μl of antibody overnight at 4°C with rotation, followed by incubation with protein A/G dynabeads for 2 hours at 4°C with rotation. The beads were washed twice with 0.1% SDS lysis buffer for 5 min each at 4°C, followed by washing twice with high-salt wash buffer [50 mM Hepes (pH 7.5), 350 mM NaCl, 1 mM EDTA, 1% Triton X-100, 0.1% sodium deoxycholate, and 0.1% SDS] for 5 min each at 4°C, followed by washing twice with lithium chloride wash buffer [10 mM tris (pH 8.0), 250 mM LiCl, 1 mM EDTA, 0.5% NP-40, and 0.5% sodium deoxycholate] for 5 min each at 4°C. After that, the beads were washed with TE buffer with 0.2% Triton X-100. Chromatin was eluted by adding elution buffer [50 mM tris-Cl (pH 8.0), 10 mM EDTA, and 1% SDS] and shaking on a heating block at 1400 rpm at 65°C for 15 min. Cross-links were reversed in the chromatin samples by adding 0.3 M NaCl and incubating overnight at 65°C, followed by treatment with 6 μl of proteinase K (P4850, Sigma-Aldrich) for 2 hours at 45°C. The chromatin was purified by the PCR Purification Kit (28106, Qiagen), following the manufacturer’s protocol.
ChIP-seq data analysis
ChIP-seq analysis was described previously (2). Briefly, for mESCs, reads from ChIP-seq experiments were aligned to the mouse genome UCSC (University of California, Santa Cruz) mm9 using Bowtie2 aligner 2.1.0, allowing uniquely mapped reads only up to two mismatches (3). For HEK293T cells, reads from ChIP-seq experiments were aligned to the human genome UCSC hg19 using Bowtie2 aligner 2.1.0, allowing uniquely mapped reads only up to two mismatches. For both mESCs and HEK293T cells, reads were extended to 150 bp toward the interior of the sequenced fragment and normalized to total reads aligned. The average coverage was binned in 25-bp intervals. Peak calling was performed using MACS 2.0.10 (4) to determine statistical enrichment at an FDR of <1 × 10⁻⁵, resulting in high-confidence peaks that were used for subsequent analysis and for depicting enrichment profiles. Condensin and TFIIIC peaks spanning 2 kb on both sides of the TSSs were binned into 100-bp windows for analysis. Peak annotation was carried out using the HOMER algorithm (5). GO analysis was performed using DAVID (Database for Annotation, Visualization and Integrated Discovery) (6). The background GO terms were the union of biological processes, cellular components, and molecular functions. An FDR cutoff of 0.01 was used to select enriched terms. The colocalization of condensin and TFIIIC (CTS) and CFTS was identified from ChIP-seq data by intersectBed algorithm from BEDTools (7). Clustering of the ChIP-seq data and quantitative comparisons were performed using the seqMINER program (8).
4C-seq experiments
4C-seq experiments were carried out as described (9). Cells were washed twice with PBS before adding 1% formaldehyde for 10 min at room temperature with gentle rocking. The formaldehyde was quenched by adding freshly prepared glycine for 10 min with gentle rocking. The cells were washed with ice-cold PBS twice before trypsinization. The cells were pelleted by centrifugation at 500g for 5 min at 4°C. The pellet was resuspended in 10 ml of ice-cold lysis buffer (50 mM tris, 150 mM NaCl, 5 mM EDTA, 0.5% NP-40, and 1% Triton X-100) and incubated on ice for 10 min. The nuclei were pelleted by centrifugation at 500g for 5 min at 4°C. Nuclease-free water (440 μl), 10× NEB Buffer 2 (60 μl), and 10% SDS (15 μl) were added to the nuclei. The mixture was incubated at 37°C for 1 hour while shaking at 900 rpm. Seventy-five microliters of 20% freshly prepared Triton X-100 was added to the mixture and incubated at 37°C for 3 hours while shaking at 900 rpm. After quenching the SDS, 200 U of Bgl II (R0144L, NEB) was added and incubated at 37°C for 4 hours while shaking at 900 rpm. Additional 200 U of Bgl II was added and incubated at 37°C overnight while shaking at 900 rpm. The following day, 80 μl of 10% SDS was added to the sample and incubated for 25 min at 65°C while shaking at 900 rpm to inactivate the enzyme. The sample was transferred to a 50-ml Falcon tube. Nuclease-free water (5255 μl) was added to the sample, followed by the addition of 375 μl of 20% Triton X-100 to sequester the SDS. The sample was incubated for 3 hours at 37°C with rotation. Seven hundred microliters of 10× ligation buffer (B0202S, NEB) was added to the sample, followed by the addition of 100 U of T4 DNA ligase (M0202T, NEB). The sample was incubated at 16°C overnight. The following day, 30 μl of proteinase K (Sigma, P5568) was added to the sample followed by an overnight incubation at 65°C. RNase A (30 μl, 0675, Amresco) was added and incubated for 45 min at 65°C. Seven milliliters of phenol/chloroform/isoamyl alcohol (25:24:1) (15593031, Thermo Fisher Scientific) was added to the sample and mixed thoroughly, followed by centrifugation for 3500g at room temperature. The aqueous phase was transferred to a new 50-ml tube. Thirty-five milliliters of 100% ethanol and 700 μl of 3 M sodium acetate were added and mixed, followed by incubation at −80°C overnight. The mixture was spun at 8300g at 4°C. Ten milliliters of cold 70% ethanol was added and centrifuged for 15 min at 3300g at 4°C. The supernatant was removed, and the pellet was briefly dried at room temperature before being dissolved in 150 μl of 10 mM tris-HCl (pH 7.5). Fifty microliters of 10× CutSmart Buffer (B7204S) and nuclease-free water were added to a total volume of 500 μl. Nla III (50 U; R0125L) was added to the mixture and incubated overnight at 37°C. The 4C sample was purified by the QIAquick PCR Purification Kit (28106, Qiagen). The DNA concentration was measured by Qubit (Q33216, Thermo Fisher Scientific). Inverse PCRs were carried out with 12.5, 25, 50, and 100 ng of 4C template using Expand Long Template Polymerase (11759060001, Roche). The actual sequencing samples were prepared by inverse PCRs using primers attached with Illumina adaptors (P5 and P7 primers). The samples were purified with the MinElute PCR Purification Kit (28004, Qiagen) before being subjected to size selection by BluePippin (Sage Science). DNA (100 to 1000 bp) was selected for sequencing. Different samples were pooled for sequencing using Rapid Mode on the HiSeq 2500 System (Illumina).
4C-seq analysis
Mapping of 4C data was carried out using 4Cseqpipe algorithm, as previously described (10). 4Cseqpipe analyzes 4C-seq data by allowing sequence extraction, mapping, normalization, and plotting of cis-contact profiles. Custom restriction site tracks were built using the -build_re_db option of 4Cseqpipe for the UCSC mm9 mouse genome and Bgl II and Nla III as first and second cutters, respectively. 4C primers were removed from the reads, and the first 50 bp were mapped to the custom mm9 tracks with the built-in 4Cseqpipe mapper. Near-cis domainograms were generated for the window surrounding the viewpoints using the median stat_type and plotting the 80th quantile of the distribution of normalized contact intensities. Alternatively, the reads were manually mapped to the mm9 genome using Bowtie2 for genome-wide visualization.
RNA-seq and analysis
RNA isolation, sequencing, and analysis were carried as described (2). Briefly, total RNA was prepared using TRIzol reagent (Invitrogen) per the manufacturer’s protocol. RNA was depleted of rRNA with the Ribo-Zero kit (Epicenter). The ribo-depleted RNA samples were amplified with the TruSeq RNA Sample Prep kit (Illumina) for Solexa sequencing. Reads from two biological replicates for shGFP control, shNCAPH2 and shTFIIIC, were aligned to the mouse genome UCSC mm9 and to gene annotations from Ensembl 72 using TopHat 2.0.10 (11). The differential expression analysis at FDR < 0.05 and the assessment of statistically significant read coverage for each gene were performed with edgeR (12).
Hi-C data analysis
Normalized mESC Hi-C matrices generated from Dixon et al. (26) were downloaded from the Hi-C project at the Ren laboratory (http://chromosome.sdsc.edu/mouse/hi-c/download.html). To visualize the high-resolution chromatin interaction data, 2D heat maps were generated and juxtaposed with tracts of ChIP-seq data either generated in this study or publicly available. The interaction frequency between any two loci in the heat map was depicted as a point where diagonals originating from each locus intersect.
Directionality index that determines the directional bias in terms of the degree of upstream or downstream bias at any given bin in the genome was calculated as described by Dixon et al. (26). Briefly, the mouse genome was binned at 40 kb. For each bin, the difference between the average upstream interactions and the average downstream interactions was subjected to a χ2 test statistic. A hidden Markov model (HMM) was used to identify the hidden directionality bias. A domain is called when a single downstream-biased HMM state begins and ends at the end of the last upstream-biased HMM state.
Other previously published data sets are listed in table S1. When necessary, the genome coordinates were converted to the mm9 genome using UCSC liftOver tool (https://genome.ucsc.edu/cgi-bin/hgLiftOver).
To determine the levels of TAD boundary association expected due to random chance, we generated a random set of peaks having an average size and same number with CTS. We excluded the unmappable regions of the genome for generating the random peaks. We identified the random peaks being associated with TAD boundaries (within 50 kb). The statistical significance of the TAD boundary association between CTS and random peaks was calculated by Pearson’s χ2 test with Yates’ continuity correction.
Insulation score
The insulation score was calculated on the basis of the perl script associated with Crane et al. (32), in which the mean of interaction frequencies crossing over each bin of 40 kb was calculated. Insulation score of the interaction matrix was obtained by sliding a 1-Mb × 1-Mb (25-bin × 25-bin) square along the diagonal of the interaction matrix for every chromosome. TAD boundaries were called at local minima (valleys) in the insulation score, indicating the depletion of Hi-C interactions occurring across a bin. The strength of each TAD boundary was determined by its insulation score: the lower the insulation score, the stronger the boundary.
Association of CTS with TAD boundaries and other domains
To find out that the number of CTS is associated with TAD boundaries (within 50 kb), the CTS peaks were cross-analyzed with TAD boundaries using BEDTools intersectBed. The annotation of CTS peaks that are associated with TAD boundaries was performed using the HOMER algorithm. The clustering of CTS-associated TSS is calculated as TSS number/500 kb, as described (15). The whole-mouse genome was divided into 500-kb sliding bins by BEDTools makewindows. The number of CTS-associated TSS in each bin was counted. Clustering of CTS-associated TSS was defined as having ≥10 TSS per 500-kb bin. Eight hundred sixty-three bins were found to have a total of 4610 CTS-associated TSS clustered together. The number of clustered CTS-associated TSS that are associated with TAD boundaries (within 50 kb) was identified by intersectBed. The insulation score of the clustered CTS-associated TSS that are associated with TAD boundaries was retrieved by intersecting the insulation score file with the file with clustered CTS-associated TSS that are associated with TAD boundaries. The same approach was used to identify the number and insulation score of the nonclustered CTS-associated TSS that are found in TAD boundaries.
The correlation between CTS and other genomic domains was computed using GenometriCorr algorithm (16), which is based on Jaccard index and statistical tests that aim to identify spatial correlations between the two sets of genome features.
DNA sequence motifs associated with CTS and CFTS were mined using MEME-ChIP with the default settings (17). The correlation of ChIP-seq peaks, after peak calling, was analyzed by BEDTools Jaccard. Jaccard statistics measures the similarity of all 32 ChIP-seq peak profiles, creating a 32 × 32 pairwise comparison. A matrix of ChIP-seq peak correlations was made by assembling the pairwise Jaccard measurements from all 32 × 32 tests.
Supplementary Material
Acknowledgments
We would like to thank the Tissue Culture Core of the Stowers Institute for Medical Research (SIMR) for performing mESC and HEK293T cell culture and carrying out clonal selection and expansion for making stable cell lines. We are grateful to the Molecular Biology Facility of SIMR for making ChIP-seq and RNA-seq libraries and to C. Wood in microscopy for assistance with image quantification. We are thankful for helpful discussions and valuable suggestions from M. Levine, R. Krumlauf, L. Li, and P. Trainor and the members of Gerton Lab. We thank R. Shrock for editorial assistance with the manuscript and M. Miller for illustrations. Funding: This study was supported by the SIMR. Author contributions: B.D.S. was responsible for imaging and quantification of NPAT. All other experiments and analyses were carried out by K.C.Y. K.C.Y. and J.L.G. were responsible for writing and conceptualization. Competing interests: The authors declare that they have no competing interests. Data and materials availability: All the sequencing data generated in this study have been deposited to the Gene Expression Omnibus database under the accession number GSE80075. All other data needed to evaluate the conclusions in the paper are present in the paper and/or the Supplementary Materials. Additional data related to this paper may be requested from the authors.
SUPPLEMENTARY MATERIALS
Supplementary material for this article is available at http://advances.sciencemag.org/cgi/content/full/3/6/e1700191/DC1
fig. S1. TFIIIC is not associated with CTCF and cohesin in mammalian cells, whereas the association of condensin II and TFIIIC complexes is stable.
fig. S2. Knockdown of NCAPH2 did not affect the binding of TFIIIC-220 to the genome.
fig. S3. CTS are preferentially localized at the promoter/TSS of highly expressed gene.
fig. S4. CTS are correlated with the promoters of active genes.
fig. S5. Binding of architectural proteins, active promoter, and enhancer markers at CTS but not at CFTS.
fig. S6. CTS have higher CpG islands and GC content than CFTS.
fig. S7. Down-regulation of highly transcribed genes upon condensin II knockdown in mESC and HEK293.
fig. S8. Histone peptide assays and IP experiments.
fig. S9. Effect of reduced H3K4me3 on the binding of NCAPH2 and TFIIIC-220 to CTS.
fig. S10. Characterization of CTS at TAD boundaries in mESCs.
fig. S11. Characterization of CTS at TAD boundaries in HEK293 cells.
fig. S12. CTS are not correlated with LAD or LOCK domains in mESCs.
fig. S13. Clustered CTS are associated with stronger TAD boundaries in mESCs.
fig. S14. Interactions between two histone gene loci on chr13.
fig. S15. Chromatin interactions between two highly expressed gene loci were reduced upon NCAPH2 knockdown.
fig. S16. Formation of histone clusters may be disrupted in NCAPH2 knockdown mESCs.
table S1. Public ChIP-seq data sets analyzed.
REFERENCES AND NOTES
- 1.Jeppsson K., Kanno T., Shirahige K., Sjögren C., The maintenance of chromosome structure: Positioning and functioning of SMC complexes. Nat. Rev. Mol. Cell Biol. 15, 601–614 (2014). [DOI] [PubMed] [Google Scholar]
- 2.Parelho V., Hadjur S., Spivakov M., Leleu M., Sauer S., Gregson H. C., Jarmuz A., Canzonetta C., Webster Z., Nesterova T., Cobb B. S., Yokomori K., Dillon N., Aragon L., Fisher A. G., Merkenschlager M., Cohesins functionally associate with CTCF on mammalian chromosome arms. Cell 132, 422–433 (2008). [DOI] [PubMed] [Google Scholar]
- 3.Rubio E. D., Reiss D. J., Welcsh P. L., Disteche C. M., Filippova G. N., Baliga N. S., Aebersold R., Ranish J. A., Krumm A., CTCF physically links cohesin to chromatin. Proc. Natl. Acad. Sci. U.S.A. 105, 8309–8314 (2008). [DOI] [PMC free article] [PubMed] [Google Scholar]
- 4.Liu W., Tanasa B., Tyurina O. V., Zhou T. Y., Gassmann R., Liu W. T., Ohgi K. A., Benner C., Garcia-Bassets I., Aggarwal A. K., Desai A., Dorrestein P. C., Glass C. K., Rosenfeld M. G., PHF8 mediates histone H4 lysine 20 demethylation events involved in cell cycle progression. Nature 466, 508–512 (2010). [DOI] [PMC free article] [PubMed] [Google Scholar]
- 5.Noma K.-i., Cam H. P., Maraia R. J., Grewal S. I. S., A role for TFIIIC transcription factor complex in genome organization. Cell 125, 859–872 (2006). [DOI] [PubMed] [Google Scholar]
- 6.Raab J. R., Kamakaka R. T., Insulators and promoters: Closer than we think. Nat. Rev. Genet. 11, 439–446 (2010). [DOI] [PMC free article] [PubMed] [Google Scholar]
- 7.Oler A. J., Alla R. K., Roberts D. N., Wong A., Hollenhorst P. C., Chandler K. J., Cassiday P. A., Nelson C. A., Hagedorn C. H., Graves B. J., Cairns B. R., Human RNA polymerase III transcriptomes and relationships to Pol II promoter chromatin and enhancer-binding factors. Nat. Struct. Mol. Biol. 17, 620–628 (2010). [DOI] [PMC free article] [PubMed] [Google Scholar]
- 8.Moqtaderi Z., Wang J., Raha D., White R. J., Snyder M., Weng Z., Struhl K., Genomic binding profiles of functionally distinct RNA polymerase III transcription complexes in human cells. Nat. Struct. Mol. Biol. 17, 635–640 (2010). [DOI] [PMC free article] [PubMed] [Google Scholar]
- 9.Barski A., Chepelev I., Liko D., Cuddapah S., Fleming A. B., Birch J., Cui K., White R. J., Zhao K., Pol II and its associated epigenetic marks are present at Pol III–transcribed noncoding RNA genes. Nat. Struct. Mol. Biol. 17, 629–634 (2010). [DOI] [PMC free article] [PubMed] [Google Scholar]
- 10.Haeusler R. A., Pratt-Hyatt M., Good P. D., Gipson T. A., Engelke D. R., Clustering of yeast tRNA genes is mediated by specific association of condensin with tRNA gene transcription complexes. Genes Dev. 22, 2204–2214 (2008). [DOI] [PMC free article] [PubMed] [Google Scholar]
- 11.D’Ambrosio C., Schmidt C. K., Katou Y., Kelly G., Itoh T., Shirahige K., Uhlmann F., Identification of cis-acting sites for condensin loading onto budding yeast chromosomes. Genes Dev. 22, 2215–2227 (2008). [DOI] [PMC free article] [PubMed] [Google Scholar]
- 12.Van Bortle K., Nichols M. H., Li L., Ong C.-T., Takenaka N., Qin Z. S., Corces V. G., Insulator function and topological domain border strength scale with architectural protein occupancy. Genome Biol. 15, R82 (2014). [DOI] [PMC free article] [PubMed] [Google Scholar]
- 13.Iwasaki O., Tanaka A., Tanizawa H., Grewal S. I. S., Noma K.-i., Centromeric localization of dispersed Pol III genes in fission yeast. Mol. Biol. Cell 21, 254–265 (2010). [DOI] [PMC free article] [PubMed] [Google Scholar]
- 14.Ikegami K., Lieb J. D., Integral nuclear pore proteins bind to Pol III-transcribed genes and are required for Pol III transcript processing in C. elegans. Mol. Cell 51, 840–849 (2013). [DOI] [PMC free article] [PubMed] [Google Scholar]
- 15.Martin C.-A., Murray J. E., Carroll P., Leitch A., Mackenzie K. J., Halachev M., Fetit A. E., Keith C., Bicknell L. S., Fluteau A., Gautier P., Hall E. A., Joss S., Soares G., Silva J., Bober M. B., Duker A., Wise C. A., Quigley A. J., Phadke S. R.; Deciphering Developmental Disorders Study, Wood A. J., Vagnarelli P., Jackson A. P., Mutations in genes encoding condensin complex proteins cause microcephaly through decatenation failure at mitosis. Genes Dev. 30, 2158–2172 (2016). [DOI] [PMC free article] [PubMed] [Google Scholar]
- 16.Leiserson M. D. M., Vandin F., Wu H.-T., Dobson J. R., Eldridge J. V., Thomas J. L., Papoutsaki A., Kim Y., Niu B., McLellan M., Lawrence M. S., Gonzalez-Perez A., Tamborero D., Cheng Y., Ryslik G. A., Lopez-Bigas N., Getz G., Ding L., Raphael B. J., Pan-cancer network analysis identifies combinations of rare somatic mutations across pathways and protein complexes. Nat. Genet. 47, 106–114 (2015). [DOI] [PMC free article] [PubMed] [Google Scholar]
- 17.Woodward J., Taylor G. C., Soares D. C., Boyle S., Sie D., Read D., Chathoth K., Vukovic M., Tarrats N., Jamieson D., Campbell K. J., Blyth K., Acosta J. C., Ylstra B., Arends M. J., Kranc K. R., Jackson A. P., Bickmore W. A., Wood A. J., Condensin II mutation causes T-cell lymphoma through tissue-specific genome instability. Genes Dev. 30, 2173–2186 (2016). [DOI] [PMC free article] [PubMed] [Google Scholar]
- 18.Hirano T., Condensins: Universal organizers of chromosomes with diverse functions. Genes Dev. 26, 1659–1678 (2012). [DOI] [PMC free article] [PubMed] [Google Scholar]
- 19.Shintomi K., Hirano T., The relative ratio of condensin I to II determines chromosome shapes. Genes Dev. 25, 1464–1469 (2011). [DOI] [PMC free article] [PubMed] [Google Scholar]
- 20.Hirota T., Gerlich D., Koch B., Ellenberg J., Peters J.-M., Distinct functions of condensin I and II in mitotic chromosome assembly. J. Cell Sci. 117, 6435–6445 (2004). [DOI] [PubMed] [Google Scholar]
- 21.Roux K. J., Kim D. I., Raida M., Burke B., A promiscuous biotin ligase fusion protein identifies proximal and interacting proteins in mammalian cells. J. Cell Biol. 196, 801–810 (2012). [DOI] [PMC free article] [PubMed] [Google Scholar]
- 22.Deaton A. M., Bird A., CpG islands and the regulation of transcription. Genes Dev. 25, 1010–1022 (2011). [DOI] [PMC free article] [PubMed] [Google Scholar]
- 23.Piazza I., Rutkowska A., Ori A., Walczak M., Metz J., Pelechano V., Beck M., Haering C. H., Association of condensin with chromosomes depends on DNA binding by its HEAT-repeat subunits. Nat. Struct. Mol. Biol. 21, 560–568 (2014). [DOI] [PubMed] [Google Scholar]
- 24.Wysocka J., Swigut T., Milne T. A., Dou Y., Zhang X., Burlingame A. L., Roeder R. G., Brivanlou A. H., Allis C. D., WDR5 associates with histone H3 methylated at K4 and is essential for H3 K4 methylation and vertebrate development. Cell 121, 859–872 (2005). [DOI] [PubMed] [Google Scholar]
- 25.Shilatifard A., The COMPASS family of histone H3K4 methylases: Mechanisms of regulation in development and disease pathogenesis. Annu. Rev. Biochem. 81, 65–95 (2012). [DOI] [PMC free article] [PubMed] [Google Scholar]
- 26.Dixon J. R., Selvaraj S., Yue F., Kim A., Li Y., Shen Y., Hu M., Liu J. S., Ren B., Topological domains in mammalian genomes identified by analysis of chromatin interactions. Nature 485, 376–380 (2012). [DOI] [PMC free article] [PubMed] [Google Scholar]
- 27.Rao S. S. P., Huntley M. H., Durand N. C., Stamenova E. K., Bochkov I. D., Robinson J. T., Sanborn A. L., Machol I., Omer A. D., Lander E. S., Aiden E. L., A 3D map of the human genome at kilobase resolution reveals principles of chromatin looping. Cell 159, 1665–1680 (2014). [DOI] [PMC free article] [PubMed] [Google Scholar]
- 28.Narendra V., Rocha P. P., An D., Raviram R., Skok J. A., Mazzoni E. O., Reinberg D., CTCF establishes discrete functional chromatin domains at the Hox clusters during differentiation. Science 347, 1017–1021 (2015). [DOI] [PMC free article] [PubMed] [Google Scholar]
- 29.Sanborn A. L., Rao S. S., Huang S.-C., Durand N. C., Huntley M. H., Jewett A. I., Bochkov I. D., Chinnappan D., Cutkosky A., Li J., Geeting K. P., Gnirke A., Melnikov A., McKenna D., Stamenova E. K., Lander E. S., Aiden E. L., Chromatin extrusion explains key features of loop and domain formation in wild-type and engineered genomes. Proc. Natl. Acad. Sci. U.S.A. 112, E6456–E6465 (2015). [DOI] [PMC free article] [PubMed] [Google Scholar]
- 30.Hou C., Li L., Qin Z. S., Corces V. G., Gene density, transcription, and insulators contribute to the partition of the Drosophila genome into physical domains. Mol. Cell 48, 471–484 (2012). [DOI] [PMC free article] [PubMed] [Google Scholar]
- 31.Medina R., Ghule P. N., Cruzat F., Barutcu A. R., Montecino M., Stein J. L., van Wijnen A. J., Stein G. S., Epigenetic control of cell cycle-dependent histone gene expression is a principal component of the abbreviated pluripotent cell cycle. Mol. Cell. Biol. 32, 3860–3871 (2012). [DOI] [PMC free article] [PubMed] [Google Scholar]
- 32.Crane E., Bian Q., McCord R. P., Lajoie B. R., Wheeler B. S., Ralston E. J., Uzawa S., Dekker J., Meyer B. J., Condensin-driven remodelling of X chromosome topology during dosage compensation. Nature 523, 240–244 (2015). [DOI] [PMC free article] [PubMed] [Google Scholar]
- 33.Dowen J. M., Bilodeau S., Orlando D. A., Hübner M. R., Abraham B. J., Spector D. L., Young R. A., Multiple structural maintenance of chromosome complexes at transcriptional regulatory elements. Stem Cell Rep. 1, 371–378 (2013). [DOI] [PMC free article] [PubMed] [Google Scholar]
- 34.Tanay A., Cavalli G., Chromosomal domains: Epigenetic contexts and functional implications of genomic compartmentalization. Curr. Opin. Genet. Dev. 23, 197–203 (2013). [DOI] [PubMed] [Google Scholar]
- 35.Chen X., Xu H., Yuan P., Fang F., Huss M., Vega V. B., Wong E., Orlov Y. L., Zhang W., Jiang J., Loh Y.-H., Yeo H. C., Yeo Z. X., Narang V., Govindarajan K. R., Leong B., Shahab A., Ruan Y., Bourque G., Sung W. K., Clarke N. D., Wei C.-L., Ng H.-H., Integration of external signaling pathways with the core transcriptional network in embryonic stem cells. Cell 133, 1106–1117 (2008). [DOI] [PubMed] [Google Scholar]
Associated Data
This section collects any data citations, data availability statements, or supplementary materials included in this article.
Supplementary Materials
Supplementary material for this article is available at http://advances.sciencemag.org/cgi/content/full/3/6/e1700191/DC1
fig. S1. TFIIIC is not associated with CTCF and cohesin in mammalian cells, whereas the association of condensin II and TFIIIC complexes is stable.
fig. S2. Knockdown of NCAPH2 did not affect the binding of TFIIIC-220 to the genome.
fig. S3. CTS are preferentially localized at the promoter/TSS of highly expressed gene.
fig. S4. CTS are correlated with the promoters of active genes.
fig. S5. Binding of architectural proteins, active promoter, and enhancer markers at CTS but not at CFTS.
fig. S6. CTS have higher CpG islands and GC content than CFTS.
fig. S7. Down-regulation of highly transcribed genes upon condensin II knockdown in mESC and HEK293.
fig. S8. Histone peptide assays and IP experiments.
fig. S9. Effect of reduced H3K4me3 on the binding of NCAPH2 and TFIIIC-220 to CTS.
fig. S10. Characterization of CTS at TAD boundaries in mESCs.
fig. S11. Characterization of CTS at TAD boundaries in HEK293 cells.
fig. S12. CTS are not correlated with LAD or LOCK domains in mESCs.
fig. S13. Clustered CTS are associated with stronger TAD boundaries in mESCs.
fig. S14. Interactions between two histone gene loci on chr13.
fig. S15. Chromatin interactions between two highly expressed gene loci were reduced upon NCAPH2 knockdown.
fig. S16. Formation of histone clusters may be disrupted in NCAPH2 knockdown mESCs.
table S1. Public ChIP-seq data sets analyzed.