Synopsis
CEST MRI can provide valuable molecular level information in vivo, but its translation to routine clinics is hindered by long imaging times. Regional average CEST measurements often suffice for quantitative evaluation, diagnosis, and treatment assessment, while allowing much shorter scan times. Recently, the spectroscopy with linear algebraic modeling (SLAM) method was adapted for CEST MRI in two dimensions (2D), directly obtaining compartmental-average measurements manifold faster than conventional CEST. Here, the SLAM CEST method is extended from 2D to 3D, and applied to patients with brain tumors with acceleration factors of up to 98-fold.
Purpose
Chemical Exchange Saturation Transfer (CEST) MRI (1) can be valuable in numerous human applications (2–6), but is currently time-consuming since it requires multiple acquisitions of saturated and unsaturated images. On the other hand, many human applications of CEST, such as tumor grading (2, 3), studies of Parkinson’s disease (6) and creatine kinetics (7), use compartmental average CEST indices from a few regions of interest. Recently, the Spectroscopy with Linear Algebraic Modeling (SLAM) method (8–10) was adapted to provide direct, ultrafast measures of compartmental average CEST parameters in two dimensions (2D). Approximately 9-fold and up to 45-fold acceleration factors (R) were demonstrated for Amide Proton Transfer (APT) (11) imaging, and whole z-spectrum measurements (12), respectively. Here, the SLAM CEST method is extended from 2D to 3D whole-brain MRI with up to 98-fold acceleration for APT imaging. Slice-by-slice and volumetric strategies for reconstructing 3D SLAM CEST indices are presented.
Methods
Consenting patients with brain tumors were recruited for 3D SLAM CEST studies on a 3T Philips MRI system using a 32-channel receive coil. CEST MRI was performed with 0.8s and 2μT block saturation pulses and saturation frequencies of ±3, ±3.5, ±3.5 and ±4ppm, as well as an unsaturation reference (13, 14). A 3D turbo spin echo (TSE) sequence was used for image readout (FOV=212×186×66mm; resolution=2.2×2.2×4.4 mm; turbo factor=55; SENSE factor=2×1 in the phase-encoding and slice-encoding directions, respectively). A 3D TSE WASSR sequence (15) was acquired for B0 correction, along with anatomical T2-weighted, FLAIR, and T1-weighted (T1w) MRI. When applicable, gadolinium (Gd)-based contrast agents were injected intravenously before and after T1w MRI as part of an institutionally approved clinical research protocol.
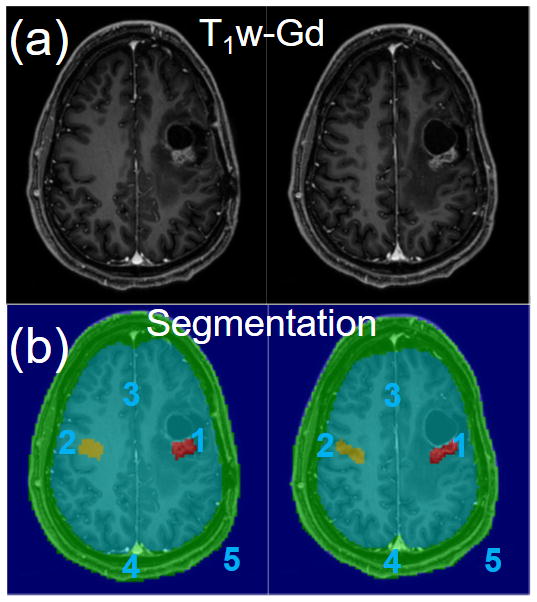
For SLAM CEST reconstruction, each CEST slice was first co-registered with an anatomical image (typically, post-Gd T1w MRI) based on recorded acquisition geometry parameters, and segmented into five compartments (1: contrast-enhanced tumor; 2: contralateral brain; 3: “rest of the brain”; 4: scalp; and 5: background as shown in Figs. 1 and 4). Segmentation was done two ways: (i) slice-by-slice treating different slices independently; and (ii) volumetrically with the segmentation of all slices connected. Compartmental average APT-weighted (APTw) indices were then directly reconstructed by the SLAM CEST method with the segmentation and B0 correction incorporated (12), using a subset of the central k-space raw data from the conventional CEST MRI scans. For slice-by-slice SLAM, the acceleration was only in the phase-encoding direction. For volumetric SLAM, the acceleration was in both phase-encoding and slice-encoding directions.
Figure 1.

(a) Post-gadolinium T1-weighted (T1w-Gd) images and (b) 5-compartment segmentation overlaid on the T1w-Gd images.
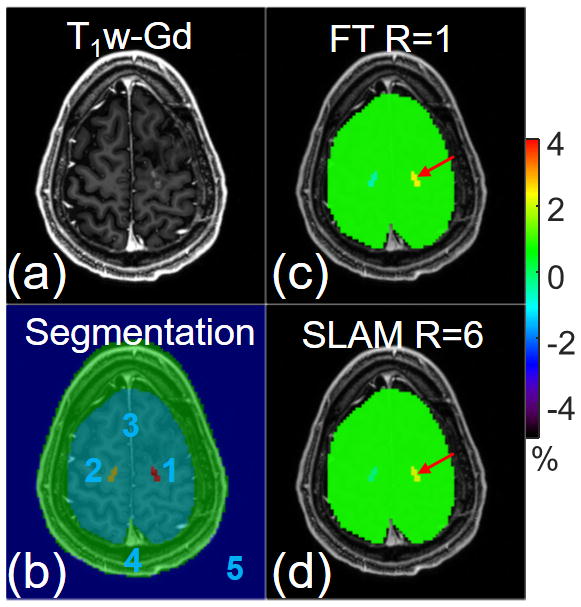
Figure 4.

(a) Post-gadolinium T1-weighted (T1w-Gd) image and (b) 5-compartment segmentation overlaid on the T1w-Gd image. Color-coded APT-weighted images (c) from the standard compartmentally-averaged FT method and (d) from SLAM with an acceleration factor of 6. Both FT and SLAM were processed in a slice-by-slice fashion.
Results were compared with a standard CEST MRI reconstruction in which the raw k-space data was Fourier transformed (FT) and unfolded in the phase-encoding direction using the SENSE (16) method. After B0 correction, compartmental-average FT APTw indices, were computed by averaging individual voxel measurements in the segmented regions in both slice-by-slice and volumetric fashions.
Results
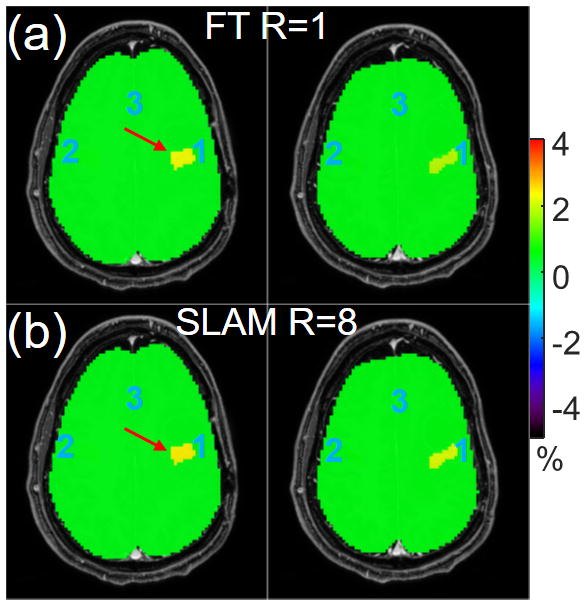
Fig. 1 shows segmented, co-registered, post-Gd T1w images from a brain tumor patient with 5 compartments. Fig. 2 shows color-coded compartmental APTw results for the contrast-enhanced tumor, contralateral brain and “rest of the brain” compartments, from slice-by-slice SLAM with an acceleration factor of R=8 (part b) and FT (R=1, part a), respectively. The SLAM results agree with standard FT (part b vs. part a), yielding APTw values of 2.4% vs. 2.3% respectively, in the tumor compartment (red arrows).
Figure 2.

Color-coded APT-weighted images (a) from the standard compartmentally-averaged FT method and (b) from SLAM with an acceleration factor of 8. Both FT and SLAM were processed in a slice-by-slice fashion.
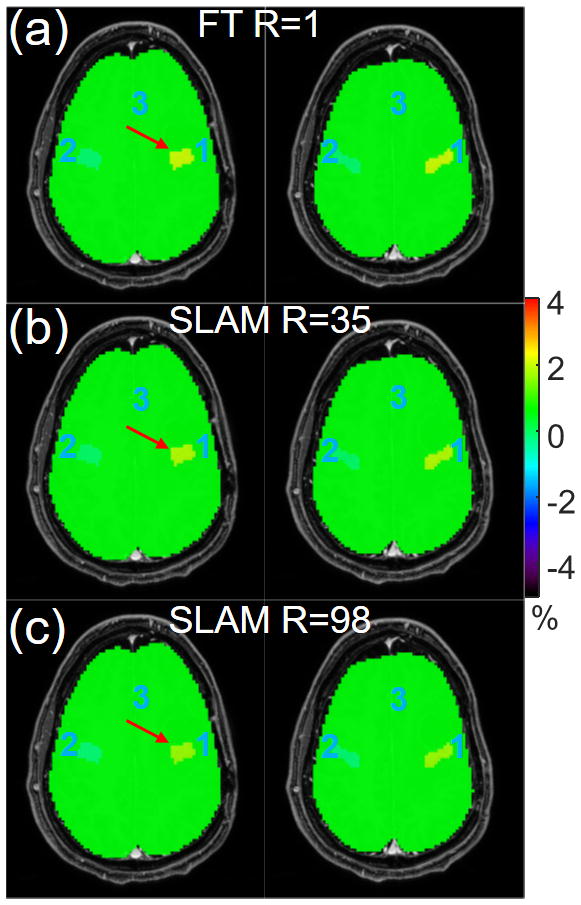
Fig. 3 demonstrates volumetric SLAM with R=35 (part b) and R=98 (part c) while still producing results in agreement with standard FT APTw (part a). The APTw values in the contrast-enhanced tumor compartment (red arrow) are 1.97%, 1.80% and 1.62% for FT, and SLAM with R=35 and R=98, respectively. Note that the tumor compartment has identical values in the two slices displayed using the volumetric strategy, which is different from the slice-by-slice strategy.
Figure 3.

Color-coded APT-weighted images (a) from the standard compartmentally-averaged FT method, and (b, c) from SLAM with an acceleration factor of 35 and 98, respectively. Both FT and SLAM were processed in a volumetric 3D fashion.
Fig. 4 presents a case where the contrast-enhanced tumor compartment is much smaller than the one shown in Figs. 1–3. As seen with the application of SLAM to conventional spectroscopy (8–10), a smaller compartment size typically limits the acceleration factor with higher-order phase-encodes providing improved accuracy. Here, for the tumor compartment (#1, red arrow), slice-by-slice SLAM with R=6 yields APTw measurements of 2.1% compared to 2.3% with FT APTw (12).
Conclusion
By extending the SLAM CEST method from 2D to 3D, CEST measurements can be accelerated up to 98-fold faster than those achieved with regular FT CEST, yielding compartment-average results consistent with those of standard FT. The 3D SLAM CEST method can be flexibly implemented with slice-by-slice or volumetric segmentation in 3T MRI scanners to facilitate clinical applications.
Acknowledgments
Funding Support: NIH Grant R01 EB007829, CA166171, EB009731, NS083435
References
- 1.Ward K, Aletras A, Balaban R. A new class of contrast agents for MRI based on proton chemical exchange dependent saturation transfer (CEST) J Magn Reson. 2000;143(1):79–87. doi: 10.1006/jmre.1999.1956. [DOI] [PubMed] [Google Scholar]
- 2.Zhou J, Zhu H, Lim M, Blair L, Quinones-Hinojosa A, Messina SA, Eberhart CG, Pomper MG, Laterra J, Barker PB. Three-dimensional amide proton transfer MR imaging of gliomas: Initial experience and comparison with gadolinium enhancement. J Magn Reson Imaging. 2013;38(5):1119–28. doi: 10.1002/jmri.24067. [DOI] [PMC free article] [PubMed] [Google Scholar]
- 3.Togao O, Yoshiura T, Keupp J, Hiwatashi A, Yamashita K, Kikuchi K, Suzuki Y, Suzuki SO, Iwaki T, Hata N. Amide proton transfer imaging of adult diffuse gliomas: correlation with histopathological grades. Neuro Oncol. 2014;16(3):441–8. doi: 10.1093/neuonc/not158. [DOI] [PMC free article] [PubMed] [Google Scholar]
- 4.Tietze A, Blicher J, Mikkelsen IK, Østergaard L, Strother MK, Smith SA, Donahue MJ. Assessment of ischemic penumbra in patients with hyperacute stroke using amide proton transfer (APT) chemical exchange saturation transfer (CEST) MRI. NMR Biomed. 2014;27(2):163–74. doi: 10.1002/nbm.3048. [DOI] [PMC free article] [PubMed] [Google Scholar]
- 5.Tee YK, Harston GWJ, Blockley N, Thomas WO, Levman J, Sheerin F, Cellerini M, Jezzard P, Kennedy J, Payne SJ, Chappell MA. Comparing different analysis methods for quantifying the MRI amide proton transfer (APT) effect in hyperacute stroke patients. NMR Biomed. 2014;27(9):1019–29. doi: 10.1002/nbm.3147. [DOI] [PMC free article] [PubMed] [Google Scholar]
- 6.Li C, Peng S, Wang R, Chen H, Su W, Zhao X, Zhou J, Chen M. Chemical exchange saturation transfer MR imaging of Parkinson’s disease at 3 Tesla. Eur Radiol. 2014;24(10):2631–9. doi: 10.1007/s00330-014-3241-7. [DOI] [PMC free article] [PubMed] [Google Scholar]
- 7.Haris M, Singh A, Cai K, Kogan F, McGarvey J, DeBrosse C, Zsido GA, Witschey WR, Koomalsingh K, Pilla JJ. A technique for in vivo mapping of myocardial creatine kinase metabolism. Nat Med. 2014;20(2):209–14. doi: 10.1038/nm.3436. [DOI] [PMC free article] [PubMed] [Google Scholar]
- 8.Zhang Y, Gabr RE, Schar M, Weiss RG, Bottomley PA. Magnetic resonance Spectroscopy with Linear Algebraic Modeling (SLAM) for higher speed and sensitivity. J Magn Reson. 2012;218:66–76. doi: 10.1016/j.jmr.2012.03.008. [DOI] [PMC free article] [PubMed] [Google Scholar]
- 9.Zhang Y, Gabr RE, Zhou J, Weiss RG, Bottomley PA. Highly-accelerated quantitative 2D and 3D localized spectroscopy with linear algebraic modeling (SLAM) and sensitivity encoding. J Magn Reson. 2013;237:125–38. doi: 10.1016/j.jmr.2013.09.018. [DOI] [PMC free article] [PubMed] [Google Scholar]
- 10.Bottomley PA, Zhang Y. Accelerated Spatially Encoded Spectroscopy of Arbitrarily Shaped Compartments Using Prior Knowledge and Linear Algebraic Modeling. Encyclopedia of Magnetic Resonance. 2015;4:89–104. [Google Scholar]
- 11.Zhou J, Payen J-F, Wilson DA, Traystman RJ, van Zijl PC. Using the amide proton signals of intracellular proteins and peptides to detect pH effects in MRI. Nat Med. 2003;9(8):1085–90. doi: 10.1038/nm907. [DOI] [PubMed] [Google Scholar]
- 12.Zhang Y, Heo HY, Jiang S, Lee DH, Bottomley PA, Zhou J. Highly accelerated chemical exchange saturation transfer (CEST) measurements with linear algebraic modeling. Magn Reson Med. 2015 doi: 10.1002/mrm.25873. [DOI] [PMC free article] [PubMed] [Google Scholar]
- 13.Zhou J, Blakeley JO, Hua J, Kim M, Laterra J, Pomper MG, van Zijl P. Practical data acquisition method for human brain tumor amide proton transfer (APT) imaging. Magn Reson Med. 2008;60(4):842–9. doi: 10.1002/mrm.21712. [DOI] [PMC free article] [PubMed] [Google Scholar]
- 14.Zhu H, Jones CK, van Zijl P, Barker PB, Zhou J. Fast 3D chemical exchange saturation transfer (CEST) imaging of the human brain. Magn Reson Med. 2010;64(3):638–44. doi: 10.1002/mrm.22546. [DOI] [PMC free article] [PubMed] [Google Scholar]
- 15.Kim M, Gillen J, Landman BA, Zhou J, van Zijl P. Water saturation shift referencing (WASSR) for chemical exchange saturation transfer (CEST) experiments. Magn Reson Med. 2009;61(6):1441–50. doi: 10.1002/mrm.21873. [DOI] [PMC free article] [PubMed] [Google Scholar]
- 16.Pruessmann KP, Weiger M, Scheidegger MB, Boesiger P. SENSE: sensitivity encoding for fast MRI. Magn Reson Med. 1999;42(5):952–62. [PubMed] [Google Scholar]


