

Abstract
The quality of structure models submitted to CASP8 is analyzed in the context of previous CASPs. To compare models from the latest experiment with their predecessors we use the approaches consistent with the previous papers in this series. Using the basic evaluation measures accepted in CASP, there were no noticeable advances in the quality of the methods in any of the target difficulty categories. At the same time, there were three positive developments: 1) for set of the best models on each target, CASP8 registered the highest number of cases from all CASPs where alignment accuracy exceeded the maximum possible from the best template; 2) modeling accuracy of regions not present in the best template has improved and 3) the loss in modeling quality from selection of non-optimal models as the best ones submitted on the target has decreased.
Keywords: Protein Structure Prediction, Community Wide Experiment, CASP, progress
Introduction
The eighth round of CASP experiments, conducted in 2008, tested over 150 different protein structure prediction methods. The Protein Structure Prediction Center evaluated over 55,000 tertiary structure predictions, and independent assessors analyzed in detail contributions from the best participating groups. The results of these analyses are discussed in the papers by the organizers and assessors elsewhere in this special issue 1-3. In this paper we analyze how the quality of the best models is improving over the course of CASP experiments, starting in 1994, and pay particular attention to the advancements in the field since the previous experiment held in 2006. We base our analysis on the methods introduced in the earlier articles 4-7 . We have also performed analyses of progress in modeling of regions not present in the single best template for each target and the ability of modelers to pick the best model from the set of five models they submitted for a target.
General considerations
Relative target difficulty
The difficulty presented by a modeling target depends on many factors. Two primary ones are the similarity of the protein sequence to that of a protein with known structure, and the similarity of the structure of the target protein to potential templates. Other factors are known to affect modeling difficulty but their influence can not be easily quantified8-10. In particular, the number and phylogenetic distribution of related sequences affect difficulty of detecting an evolutionary relationship to the target and also the quality of the alignment that can be generated; the number and structural distribution of available templates influences modeling of the regions of structure not present in the single best template.
In compliance with previous analyses, we define difficulty of the target based on combination of the structural coverage of the target by the best template and target-template sequence similarity of the superimposed regions (See Methods for details). Omitting additional factors such as those mentioned above will add some noise to the relationship between model quality and our difficulty scale.
Domains
Some targets may consist of two or more structural domains. Since domains within the same structure may present modeling problems of different difficulty, assessment treats each identifiable domain as a separate target. As domain definitions are nearly always subjective, for most of the analysis, we subdivide template based modeling targets (TBM) into domains only if these divisions are likely identifiable by a predictor and require different modeling approaches (i.e belong to different difficulty categories), or the domains are sequentially related to different templates. There are fifteen such targets in CASP8. For evaluation of non-template based models all domains identified by the assessors are treated as separate targets. In CASP6, 7 and 8 some of single-domain targets were trimmed by the assessors to avoid evaluation on uncertain residues or residues strongly influenced by crystal packing. To maintain consistency with the previous papers 4-7, we base our analysis on the untrimmed domains following the notion that predictors had no means to establish a-priori which residues in the target will be abandoned by the assessors. Obviously, this choice affects the results presented here as approximately one-fifth of CASP8 targets were trimmed in the assessors' analysis because of crystal contacts and additional reasons (see Methods for details). We do use official (trimmed) domain definitions for the multi-domain targets containing at least one free modeling (FM) domain and for some of the NMR targets (see Methods), where deviation of the models in the ensemble is very large.
Target Difficulty Analysis
Figure 1 shows the distribution of target difficulty for all CASPs, as a function of structure and sequence similarity between the experimental structure of each target and the corresponding best available template. Targets span a wide range of structure and sequence similarity in all the CASPs. In CASP8 though, we see the continuation of the trend that emerged in CASP7 - there are fewer targets at the low end of structure superposability. The target with the lowest structural coverage in CASP8 – T0405_2 – has approximately half of the residues superimposable with the best template – a relatively high value. As the majority of CASP7 and CASP8 targets came from the Structural Genomics centers, this may be a consequence of target selection policy, combined with the growth of structural databases and perhaps approaching saturation of accessible protein fold space.
Figure 1.
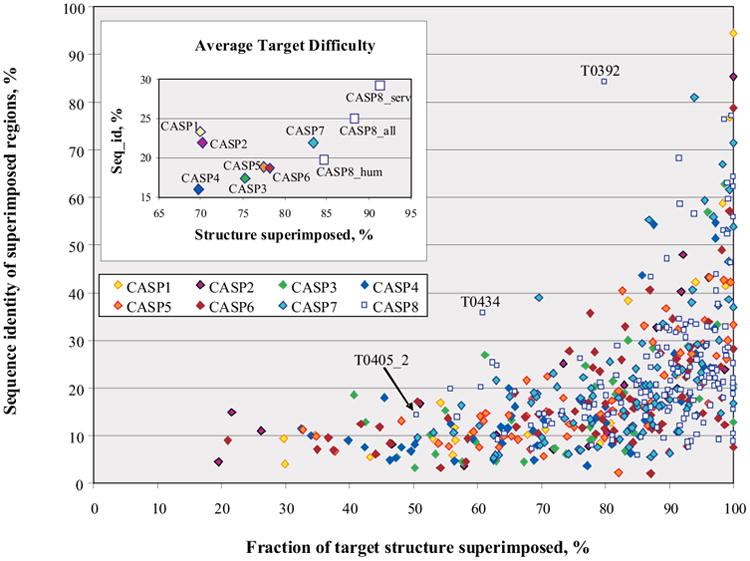
Distribution of target difficulty. The difficulty of producing an accurate model is shown as a function of the fraction of each target that can be superimposed on a known structure (horizontal axis) and the sequence identity between target and template for the superimposed portion (vertical axis). While targets in all CASPs span a wide range of difficulty, there are no targets with structural coverage by a single template below 50% in the recent two CASPs. Points on the inset graph show the average values for target features, plotted in the main graph, calculated for each CASP separately.
The majority of targets in CASP8 show structure superposability with the best template above 60% and sequence identity below 35%. There are very few difficult free modeling (FM) targets in CASP8. All FM targets have low sequence identity (< 17%) to the best templates, but have quite high structural coverage - over 50%. Only three have LGA_S11 scores below 40 and corresponding coverage below 70%. All but two CASP8 targets fit the general sequence_ID – coverage pattern seen in all CASPs. These two targets (T0392 and T0434) have unusually high sequence identity for their level of structural conservation. Target T0392 is a swapped dimmer, where the N-terminal helix (residues 1-22) is not part of a compact single domain and therefore was trimmed by the assessors. If we consider the official definition for the domain 1 (23-104) instead of the untrimmed sequence, then the same template (1vae_A) will cover 100% of the sequence with the sequence identity of 84%. The best template for target T0434 - 2jv0_A – has 61% structural coverage and 36% sequence identity to the target with LGA_S score 46. There exists another good template - 2o8j_B – with slightly better coverage (63%) and a higher LGA_S score (53) but lower sequence identity (18%). Both templates were heavily used by the predictors (2jv0 - 62 times; 2o8j - 42 times) but we selected the first template as the best template for this target based on its higher sequence identity (see Methods for the template selection criteria). If we had selected the other template with the higher coverage and LGA_S score, it would follow the general pattern.
The procedure for target release in CASP8 differed from the one employed in previous CASPs. The relatively harder cases formed a set of 57 targets suggested for prediction by all groups (‘human/server targets’), and likely easier targets (71) were released for server prediction (server-only targets). The inset in Figure 1 shows target difficulty averaged over all targets for every CASP, including three different target subsets from CASP8. It can be seen that CASP8 server only targets are indeed much easier than CASP8 human/server targets and, in general, than all other sets of targets in all CASPs. The set of all CASP8 targets (CASP8_all) also show lower difficulty than previous sets of CASP targets. The subset of CASP8 human/server targets has higher average structural coverage than all other CASPs, but its average sequence identity value is within the range covered by the CASP1-CASP7 targets. Because of this similarity and due to the fact that it is hard to objectively compare different groups on the different sets of targets we use CASP8 human/server targets for our analysis.
As in previous CASPs, we derive a one dimensional scale of target difficulty, combining the structure superposability and sequence identity (see Methods). The target categories defined by the assessors map approximately to this difficulty scale, with the template-based targets lining up at the easy and middle range of the scale, and template free targets at the most difficult end. As before, though, the mapping boundaries are not completely sharp. We also analyzed cumulative average target difficulty in all CASPs and found that CASP7 and CASP8 targets were the easiest ones while the most difficult targets were in CASP4 (see Methods and Supplementary Material).
Overall Model Quality and Alignment Accuracy
Traditionally, we evaluate the quality of models in CASP with the GDT_TS measure12. GDT_TS represents average percentage of residues that are in close proximity in two structures optimally superimposed using four different distance cutoffs (see Methods for a detailed definition). The versatility across thresholds makes the measure suitable for comparison of both very close and remotely similar structures. It should be mentioned though that relying on GDT_TS alone is not advisable for difficult modeling cases, as models are often very approximate and below some threshold (approximately 30 GDT_TS units) the measure has poor discrimination of model quality. In these cases careful visual inspection of the models is needed to detect useful features.
Figure 2 shows the GDT_TS score for the best model on each target as a function of target difficulty. The quadratic trend lines are fitted through the data for each CASP, and clearly show the improvement of the best models over the course of CASP experiments. The most impressive progress can be seen from CASP1 to CASP6, where GDT_TS scores were steadily rising across the whole range of target difficulty, and have about doubled in the middle of the range. Since CASP6, progress according to this measure is at the best marginal, with the trend lines running very close to each other. A very similar pattern can be seen in an analysis based on average scores from six best models or on quality of the best model alignment (see Figures 2S and 3S in Supplementary Material).
Figure 2.
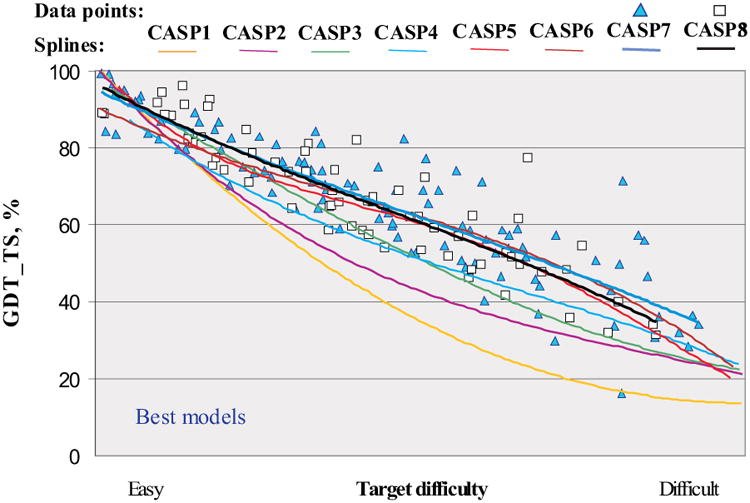
GDT_TS scores of submitted best models for targets in all CASPs, as a function of target difficulty. Each point represents one target. Trend lines show a substantial slowing of progress in the last three CASPs.
Features of Models not Available from a Single Best Template
In this section we analyze the effectiveness of template based methods in adding value to a model compared to simply copying structural features present in the best template. We evaluate progress using three approaches: (1) alignment accuracy of the best models relative to template imposed limits; (2) overall quality of the best models compared to that of naïve models; and (3) comparing coverage of structurally non-conserved regions in the best models and the best templates.
(1) Alignment accuracy of best models compared to template imposed limits
The maximum fraction of residues that can be correctly aligned by simply copying a template is defined by the fraction of super-imposable residues between the target and template structures. Alignment accuracy greater than that limit thus reflects additional detail in the model not found in the best single template. Figure 3 shows the alignment accuracy (AL0) of the best models for all CASPs, as a percentage of the maximum alignability SWALI (see Methods). Log fits to the data for each CASP (shown for clarity separately in the inset) illustrate continuous progress in this aspect of modeling. In all CASPs, the best models for the targets with greater than 30% sequence identity to a template have practically all possible residues correctly aligned. If the target-template sequence identity falls below the 20% level, as many as half of the residues may be misaligned. In the most recent three CASPs there are several low sequence identity targets with a higher fraction of aligned residues than can be obtained from a single template. In general, there are 22 targets over all CASPs where alignment accuracy superseded maximum alignability by more than 2%. Among these, nine targets are from CASP8 (constituting 13.6% of all targets in CASP8), eight targets (7.8%) – from CASP7, four targets (5.6%) – from CASP6 and one (1.6%) – from CASP5. According to this measure then, there is progress.
Figure 3.
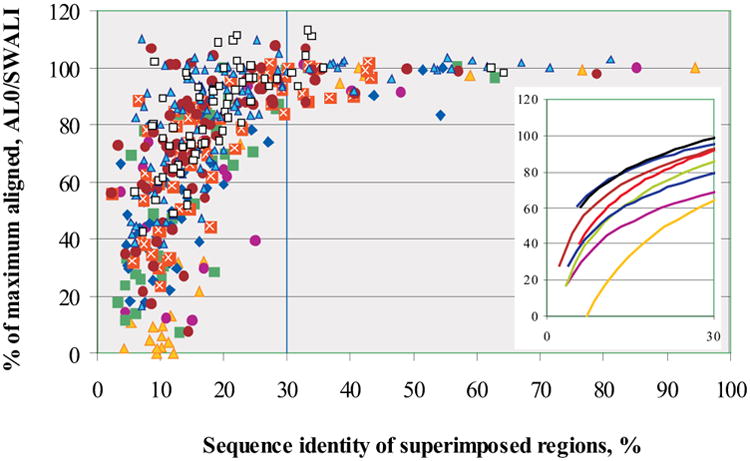
Alignment accuracy for the best model of each target in all CASPs, expressed as percent of the maximum number residues that can be aligned by copying from the closest available template structure. Targets are ordered by sequence identity between the target and the closest template. An alignment of 100% indicates that all residues with an equivalent in the template were correctly aligned. A value greater than 100% indicates an improvement in model quality beyond that obtained by copying a template structure. Best models for 40 targets from all CASPs showed this improvement. Trend lines in the inset show a steady though sometimes modest improvement over successive CASPs.
(2) Overall quality of the best models compared to that of naïve models
To evaluate whether the best CASP models are superior to those a naïve modeler might produce, we constructed a set of models utilizing knowledge of the structure of the best template. To do that we first find an optimal template-target alignment according to the procedure used for calculation of the maximum alignability (see Methods) and then assign the coordinates of the template's backbone residues to the aligned target residues. It is not always the case that the template with the best structural coverage of the target gets the highest GDT_TS score when superimposed onto the target in this way. To ensure that templates yielding the highest score possible were used, for each target, we built such “template models” based on each of the 20 templates with the best structural coverage, and then picked the template model with the highest GDT_TS score for the subsequent analysis. These models were then evaluated exactly like the submitted ones.
Figure 4 shows the difference between the GDT_TS score for the best submitted model and the GDT_TS highest scored template model for all targets in CASPs 5-8. Values greater than zero indicate that overall the submitted model is more accurate than the one obtained from the best template. Spline fits show that the average improvement of best models over template is in general very similar for the latest two CASPs. The spline lines are at positive values for the easier targets (showing value has been added) and dip below zero for the hardest ones. There are six CASP8 targets where the best model scores more than 10% higher in GDT_TS than the best template one. Four of these targets are at the easy end of difficulty scale pulling the CASP8 trend line in that region up and above all other CASPs.
Figure 4.
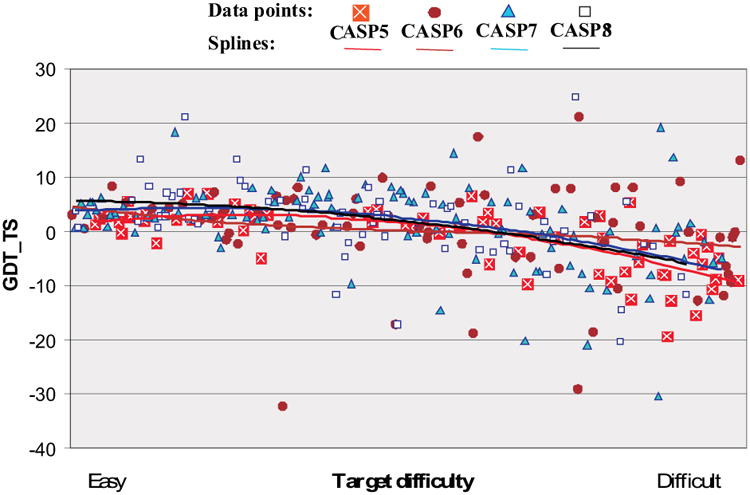
Difference in GDT_TS score between the best submitted model for each target, and a naïve model based on knowledge of the best single template. Values greater than zero indicate added value in the best model. There are 6 cases in CASP8 where model improved more than 10% over the naïve model GDT_TS.
Figure 5 summarizes the comparison of the best submitted models with the best template ones, for CASPs 5-8. The fraction of all best submitted models with a higher or equal GDT_TS value to the corresponding best single template one has increased from 53% in CASP5, through 59% in CASP6 to 68% in CASP7 and stayed at the same level for CASP8 (a). For the template based modeling targets, GDT_TS scores for CASP8 are slightly lower than those from the last CASP – 75% and 79% correspondingly - but still essentially higher than scores from CASP5 and CASP6 (66% and 71% respectively) (b). A similar picture is apparent for the alignment accuracy AL0 score, with increases for each new CASP for all targets (the CASP7 to CASP8 increase is a marginal 52% to 53%) (c), and a slight decrease to 58% from 62% in CASP7 for best TBM models that are more accurately aligned than the best template models (d).
Figure 5.
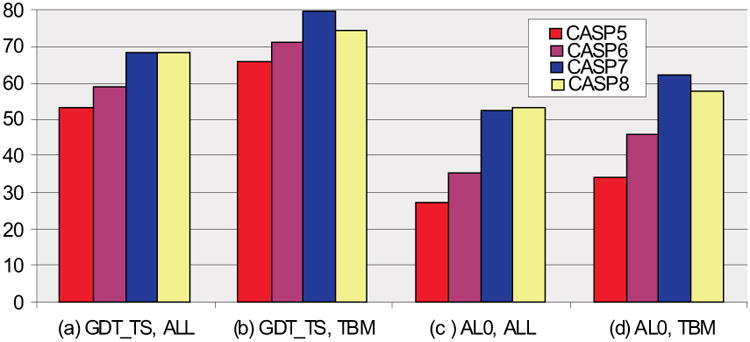
Percentage of targets for which the best submitted models are superior to the best template models in CASPs 5-8. In CASP8, the percentage is approximately the same as in CASP7 for all targets and slightly lower for template based modeling (TBM) targets, according to both GDT_TS and AL0 scores.
(3) Comparison of coverage of structurally non-conserved regions in the best models and the best templates
Another approach to check improvement of best models over the best templates is to compare coverage of the target in the regions not present in the best template. These regions can be modeled in three ways: by combining features from other available template structures, by refining poorly aligned regions towards the experimental structure, or by the use of template free modeling methods. Figure 6 shows the percentage of these ‘non-template’ residues for each target in CASP5-8 that are aligned to the experimental structure in the best model. The spline lines on the graph suggest that there has been progress in this aspect of modeling for the more difficult targets. For the majority of targets, best models have up to 10% more residues properly aligned in the non-conserved regions comparatively to single best templates. There are 11 targets in CASP8 where best models covered more than 10% of residues in the target than the best template.
Figure 6.
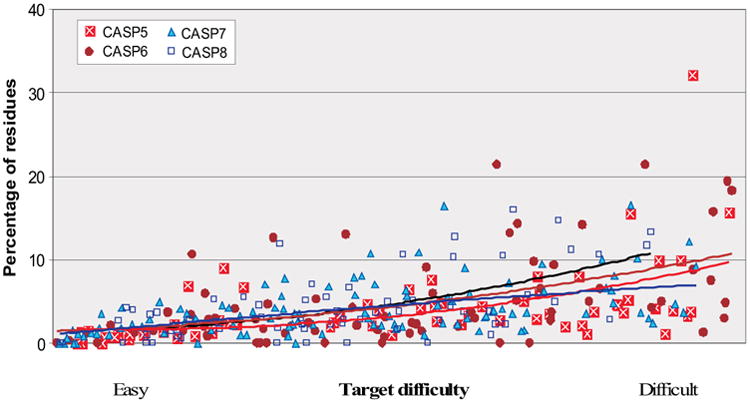
Percentage of residues that are correctly positioned in the best model but not present in the best single template. Targets are ordered by their relative difficulty. Each point represents one target. A residue is considered correct if the Cα atom is with 3.8 Angstroms of the experimental position. Quadratic splines are fitted through the data, and show steady improvement over the CASPs.
Server Performance
The last three CASPs reassured community of structural biologists that fully automatic protein structure modeling servers can provide models close in quality to those provided by the best human expert modelers. Moreover, sometimes the remaining difference in human-server performance is just due to the fact that human experts have more time for the modeling (and quite often, experts base their models on initial structures obtained from servers). Since servers are the only option for high throughput modeling, their performance is in any case important.
There were 53, 50, 68 and 72 server groups submitting tertiary structure models in CASPs 5, 6, 7 and 8 respectively. To enumerate progress in these fully automatic methods, we have compared the accuracy of server models across the latest four CASPs, and to the corresponding human expert predictions. It appears that server performances in CASP7 and CASP8 are very similar and substantially better than in CASP5 and CASP6. For example, the percentage of server models on the list of best 6 models for all targets in both CASP7 and CASP8 is around 29% (compared to 15% in CASP5 and 17% in CASP6). The fraction of targets for which at least one of the best six models came from a server is around 90% in the latest two CASPs compared to 58% in CASP5 and 65% in CASP6. We have not presented results for different target difficulty categories here as there were only six high accuracy and ten free modeling human/server targets – too low a number to analyze any trends in the data. Figure 7 shows the ratio of quality of the best server models to the best human models (in terms of GDT_TS score) for each CASP target, arranged by target difficulty. The splines show that the trends in the data are very similar. For easiest targets, server models are practically as good as those coming from human-expert groups, again supporting the notion that human expertise has at best marginal positive impact on the high accuracy modeling cases. For harder targets, scores for the best server models in CASP7 and CASP8 are on the average within 5% of those for the best human models, and there are very few targets where the best server model is significantly worse than the best human one. As can be seen from the graph, relative server performance in the latest two CASPs noticeably improved comparatively to CASP6 (except for the easiest difficulty range where there is not much room for improvement). When compared between themselves, CASP8 and CASP7 results are very similar except for the region of the more difficult targets. Closer inspection shows that there are two targets in CASP8 where the best models produced by servers were essentially better than any human prediction (T0466_1 and T0405_2). Although this was also the case in CASP7 (two exceptional server predictions), absence of really poor server models in CASP8 is the reason for the CASP8 trend line being slightly above that of CASP7 at the higher end of the difficulty scale.
Figure 7.
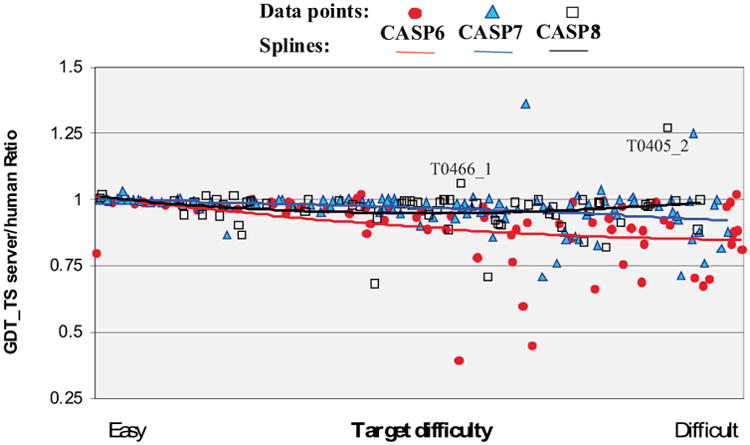
Ratio of the quality of best server models to best human models as a function of target difficulty for CASPs 5-8, as measured by GDT_TS. The spline fits for CASP7 and CASP8 run very close to unity (equal quality for server and human models) over much of the difficulty range. There is an outstanding case (T0405_2) where the best server model has GDT_TS score more than 25% higher than the best human model. There are also cases where human input does greatly improve model accuracy over that provided by any server.
Recognizing Best Models Among the Decoy Set
In CASP all groups are allowed to submit up to five models on a target. Predictors are requested to label their models in order of their expected reliability, i.e. the first model is meant to be the best model out of five. Here we compare how well predictors in the recent four CASPs selected their best models and the loss in model quality due to the inability to recognize the best model.
We performed our analysis on the groups that submitted 5 models on at least 20 domains in each CASP. For each group satisfying these criteria we calculated the fraction of targets where the predictors were able to correctly identify the best model. Figure 8A shows these data for the best 25 groups according to the average GDT_TS score in CASPs 5-8. The best “selectors” from among these best performing groups were able to recognize their best model on 46% of targets in CASP8 compared to the highest ratio of 58% achieved in CASP5. The apparently worse performance in CASP8 may be misleading – the analysis in the next paragraph suggests that there was more variability among models submitted by a group in CASP5 than in CASP8, and the more models differ the easier it is to choose among them. Although some groups do a reasonable job of at least biasing model selection towards the best, in all CASPs there are other groups in the top 25 whose selection ability is close to random (i.e. around 20%). It is interesting to notice that in CASP8 human judgment in selecting best models appeared to be poorer than server selection procedures (servers' success ratio was 55% on all 164 CASP8 domains).
Figure 8.
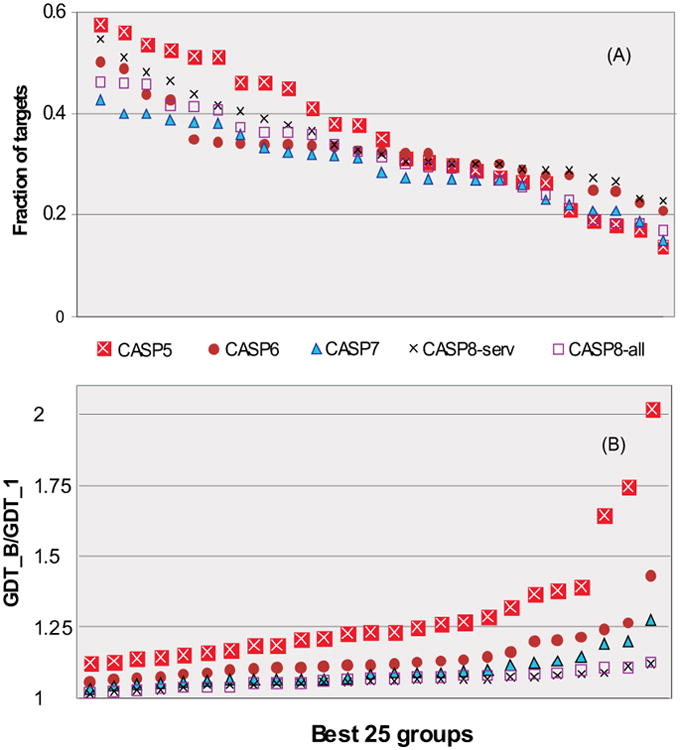
(A) Fraction of targets, where the best 25 performing groups (according to the GDT_TS score) assigned their best model as the first model. Groups are ordered according to their ability to select best models. For CASP8 data are given for all groups on 66 human/server domains and for server groups on all 164 domains. Server groups showed better selection ability than human-expert groups. (B) Average GDT_TS ratio between the best submitted model and the model labeled as #1 for all targets in CASPs5-8. The lower the points, the smaller the loss in modeling quality due to a non-optimal model selection. CASP8 points cluster closer to the x-axis, indicating relatively better performance than was achieved in earlier CASPs.
Figure 8B shows the average GDT_TS ratio between the best submitted model and the model labeled as #1 on all targets in the most recent four CASPs. The closer the ratio to unity, the smaller the loss in modeling quality due to the selection of non-optimal model. According to this measure steady CASP to CASP progress can be seen. In CASP5 there were three groups from among the 25 best where missed value in modeling was higher than 50% (points above the 1.5 ratio line). There are no such extreme cases in subsequent CASPs. The graph clearly shows progress in this area as CASP8 data points are lower than corresponding points from all other CASPs. The worst ratio between the best and first model for the best 25 groups in CASP8 is 1.125 (the rightmost point on the graph), which is again much better than that in other CASPs.
Analysis of Sustained Performance for Template Free Targets
A quarter of the protein sequences in contemporary databases do not appear to match any sequence pattern corresponding to an already known structure13. In such cases, template-free modeling methods must be used. The quality of free modeling predictions has increased dramatically over the course of the CASP experiments. Even though overall quality of the template-free models remains poor, in the last few CASP some research groups managed to submit very impressive predictions for a small number of short targets (usually less than about 120 residues). To determine to what extent particular groups are performing consistently, as opposed to groups occasionally getting lucky, we compare the distribution of success of individual groups with the distribution of success expected by chance. Success is measured as the number of targets for which a group had a model ranked among the top six. The chance distribution was generated by randomly choosing six groups as the best scoring for each target. The chance distribution was constrained so that only groups predicting on that target were included, and the draw was weighted by the number of models submitted. I.e. a group submitting four models was four times as likely to be selected as one submitting a single model for a particular target.
Figure 9 shows these data for the 19 CASP7 targets and 10 CASP8 targets. Also shown is information on how many groups submitted models for different number of targets. The green bars show the number of prediction groups submitting predictions on at least 1, 2, 3,… up to the maximum number of targets in each CASP. The yellow bars show the probability of a group scoring among the top six for one target, two targets, three targets, and so on, if the results were random. The red bars show the number of groups actually falling among the top six for one target, two targets, and so on. The more different this distribution from random, the more significant the results. For CASP8, there were four groups with models among the six best on three free modeling targets, one group on four targets and one group on five. As the graph shows, these results are higher than those expected by pure chance. At the same time, this number is smaller when compared to the previous CASP where there were more than 10 groups scoring better than random. This result can be a consequence of smaller number of free modeling targets in CASP8.
Figure 9.
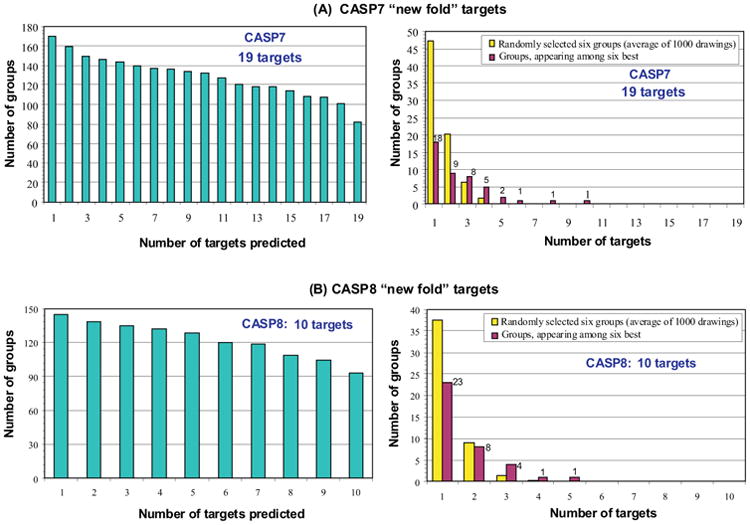
Distribution of success in predicting ‘new fold’ targets for individual groups in CASP7 (part A) and CASP8 (part B), compared with that expected by chance. Left hand panels (green bars) show the number of groups submitting predictions for at least 1, 2,…. up to the maximum number of targets in each of these CASPs. In the right panels, red bars show the number of groups ranked in the top six for 1 target, two targets, and so on. Yellow bars show the distribution of ranking expected by chance. In CASP7 there were ten groups with rankings counts shifted away from random distribution. In CASP8 there are only five such groups. The difference may not be significant, given the small number of targets.
Conclusions
Perhaps the stagnation tendencies in world economies influence protein structure modeling? Based on well-established measures there was no essential progress in modeling methods from CASP7 to CASP8. In particular, the GDT_TS and alignment accuracy AL0 scores for the best models in general remain approximately at the same level, as they were 2 years ago. At the same time, closer inspection of Figure 2 shows that in both the easiest and the middle range of the target difficulty there are many examples of CASP8 models scoring noticeably higher than the rest of the models of comparable difficulty. It is also encouraging to see the further advances in various aspects of modeling features of targets not available from a single best template structure. First, analysis of data in Figure 3 clearly shows that there again has been a progress in model alignment compared to the maximum possible from knowledge of the best template structure. For 13.6% of all targets in CASP8, the models are aligned to a higher fraction of residues than could be obtained from a single template, compared to 7.8% of targets in CASP7 and 5.6% targets in CASP6. Second, even though approximately the same percentage of the best models have added value over a single template in CASP8 and CASP7, CASP8 had a higher percentage of targets (9% compared to 6.8% in CASP7) where the best models scored 10% or higher in GDT_TS than the naïve template models. Third, analyzing best model coverage of target regions not represented in the best template (structurally non-conserved regions) it is apparent that CASP8 results are better than those from previous CASPs - there are 11 targets in CASP8 (compared to seven in CASP7) where best models covered more than 10% of residues in the target than the best template. An obvious question is why progress is apparent relative to features not available in the best templates, and not in absolute terms. The likely explanation is that the use of an intermediate reference state, rather than the absolute GDT_TS value, helps extract the otherwise weak signal.
Server performance in CASP8 is very similar to that of CASP7.
For the first time we have analyzed the loss of model quality as a result of selection of non-optimal models from among five submitted. The data reveal an increased ability of the best performing groups to identify the best model.
As noted earlier, although it is possible to tease out signs of progress, there is no doubt that overall recent CASPs have seen much smaller increments than earlier ones. In the past we have seen bursts of progress from particular technical advances, such as multiple sequence alignment methods, and fragment assembly procedures. Clearly, new methods are needed to push the field forward once again.
Methods
Target Difficulty
The difficulty of a target is calculated by comparing it with every structure in the appropriate release of the protein databank, using the LGA structure superposition program. For CASP8 templates were taken from the PDB releases accessible before each target deadline. Templates for the previous CASPs are the same as those used in the earlier analyses. For each target, the most similar structure, as determined by LGA, in the appropriate version of the PDB is chosen as the representative template.
Similarity between a target structure and a potential template is measured as the number of target-template Cα atom pairs that are within 5Å in the LGA superposition, irrespective of continuity in the sequence, or sequence relatedness. This value is a little larger than we now consider most appropriate (3.8Å), and there is some times significant superposition score between unrelated structures, particularly for small proteins. Never-the-less, the threshold is retained in the interests of continuity. Sequence identity is defined as the fraction of structurally aligned residues that are identical, maintaining sequence order. Note that basing sequence identity on structurally equivalent regions will usually yield a higher value than obtained by sequence comparison alone. In cases where several templates display comparable structural similarity to the target (coverage differing by less than 3%), but one has clearly higher sequence similarity (7% or more) the template with the highest sequence identity was selected. There were a total of 21 such instances in CASP8.
Domains
There were 26 targets that had residues excluded by the assessors because of crystal contacts*. Some of the residues were excluded for more than one reason - they might also have had poor electron density and there might also be differences in chains that contributed to the final reason for leaving them out. Fourteen of the targets had residues (142 residues in total) excluded solely because of their crystal contacts. Twelve targets had residues (89 in total) excluded from the targets in part because they were making crystal contacts. Those with 5 residues or more trimmed were: T0488, T0391, T0485, T0414, T0497, T0434, T0435, T0465 - due to crystal contacts solely; T0502, T0451, T0420, T0483, T0409, T0446_1, T0493, T0388, T0402, T0413 - due to crystal contacts in part.
The only trimming for the analysis in this paper was the use of official domain definitions for six NMR targets, T0466, 468, 471, 474, 480, 482, containing extended disordered regions.
Difficulty Scale
We project the data in Figure 1 into one dimension, using the following relationship:
where RANK_STR_ALN is the rank of the target along the horizontal axis of Figure 1 (i.e. ranking by % of the template structure aligned to the target), and RANK_SEQ_ID is the rank along the vertical axis (ranking by % sequence identity in the structurally aligned regions).
For defining difficulty of the whole set of targets in separate CASPs (used in Figure 1S from Supplementary Material) we applied the formula
where Avg_SEQ_ID is the average sequence ID between template and target over all targets in a particular CASP, and Avg_STR_ALN is the average percentage of the template structure aligned to the target and percentage of sequence identity in the structurally aligned regions. Since the maximum value of the dominator is 200, this difficulty scale has a minimum value of zero and an unconstrained maximum. The higher the score, the higher the difficulty of targets in a particular CASP.
GDT_TS
The GDT_TS value of a model is determined as follows. A large sample of possible structure super-positions of the model on the corresponding experimental structure is generated by superposing all sets of three, five and seven consecutive Cα atoms along the backbone (each peptide segment provides one super-position). Each of these initial super-positions is iteratively extended, including all residue pairs under a specified threshold in the next iteration, and continuing until there is no change in included residues. The procedure is carried out using thresholds of 1, 2, 4 and 8Å, and the final super-position that includes the maximum number of residues is selected for each threshold. Super-imposed residues are not required to be continuous in the sequence, nor is there necessarily any relationship between the sets of residues super-imposed at different thresholds. GDT_TS is then obtained by averaging over the four super-position scores for the different thresholds:
where Nn is the number of residues superimposed under a distance threshold of ‘n’Å. GDT_TS may be thought of as an approximation of the area under the curve of accuracy versus the fraction of the structure included. Different thresholds play different roles in different modeling regimes. For relatively accurate comparative models (in the ‘High Accuracy’ regime), almost all residues will likely fall under the 8Å cutoff, and many will be under 4Å, so that the 1 and 2Å thresholds capture most of the variations in model quality. In the most difficult template free modeling regime, on the other hand, few residues fall under the 1 and 2Å thresholds, and the larger thresholds capture most of the variation between models. For the bulk of the template based models, all four thresholds will often play a significant role.
Alignment quality (AL0)
AL0 score measures alignment accuracy of a model by counting the number of correctly aligned residues in the LGA 5Å superposition of the modeled and experimental structures of a target. A model residue is considered to be correctly aligned if the Cα atom falls within 3.8Å of the corresponding atom in the experimental structure, and there is no other experimental structure Cα atom nearer.
Maximum alignability (SWALI)
Maximum alignability with respect to the best single template is defined as follows: We first find all target Cα atoms that are within 3.8 Å of any template Cα atom in the 5Å LGA sequence independent superposition. Then, we use a dynamic programming procedure that determines the longest alignment between the two structures using these preselected atoms, in such a way that no atom is taken twice and all the atoms in the alignment are in the order of the sequence. The maximum alignability (Smith-Waterman alignment score - SWALI) is then the fraction of aligned Cα atoms in the target.
Supplementary Material
Acknowledgments
This work was partly supported by NIH grant LM07085 (to KF). We thank Michael Tress for identifying the best structural homologues of target structures and for providing the working data on domain boundary definitions. We also thank Oleh Krysko for assisting in generating data.
Footnotes
The data in this paragraph were provided by Michael Tress, CASP8 assessor responsible for domain definitions
References
- 1.Keedy D, Williams CJ, Arendall WB, III, Chen VB, Kapral GJ, Gillespie RA, Zemla A, Richardson DC, Richardson JS. The other 90% of the protein: Assessment beyond Cas for CASP8 template-based models. Proteins. 2009 doi: 10.1002/prot.22551. This issue. [DOI] [PMC free article] [PubMed] [Google Scholar]
- 2.Ben-David M, Noivirt O, Paz A, Prilusky J, Sussman J, Levy Y. Assessment of CASP8 structure predictions for template free targets. Proteins. 2009 doi: 10.1002/prot.22591. This issue. [DOI] [PubMed] [Google Scholar]
- 3.Cozetto D, Kryshtafovych A, Fidelis K, Moult J, Rost B, Tramontano A. Evaluation of template-based models in CASP8 with standard measures. Proteins. 2009 doi: 10.1002/prot.22561. This issue. [DOI] [PMC free article] [PubMed] [Google Scholar]
- 4.Kryshtafovych A, Fidelis K, Moult J. Progress from CASP6 to CASP7. Proteins. 2007;69(8):194–207. doi: 10.1002/prot.21769. [DOI] [PubMed] [Google Scholar]
- 5.Kryshtafovych A, Venclovas C, Fidelis K, Moult J. Progress over the first decade of CASP experiments. Proteins. 2005;61(7):225–236. doi: 10.1002/prot.20740. [DOI] [PubMed] [Google Scholar]
- 6.Venclovas C, Zemla A, Fidelis K, Moult J. Assessment of progress over the CASP experiments. Proteins. 2003;53(6):585–595. doi: 10.1002/prot.10530. [DOI] [PubMed] [Google Scholar]
- 7.Venclovas C, Zemla A, Fidelis K, Moult J. Comparison of performance in successive CASP experiments. Proteins. 2001;(5):163–170. doi: 10.1002/prot.10053. [DOI] [PubMed] [Google Scholar]
- 8.Lassmann T, Frings O, Sonnhammer EL. Kalign2: high-performance multiple alignment of protein and nucleotide sequences allowing external features. Nucleic Acids Res. 2009;37(3):858–865. doi: 10.1093/nar/gkn1006. [DOI] [PMC free article] [PubMed] [Google Scholar]
- 9.Cozzetto D, Tramontano A. Relationship between multiple sequence alignments and quality of protein comparative models. Proteins. 2005;58(1):151–157. doi: 10.1002/prot.20284. [DOI] [PubMed] [Google Scholar]
- 10.Larsson P, Wallner B, Lindahl E, Elofsson A. Using multiple templates to improve quality of homology models in automated homology modeling. Protein Sci. 2008;17(6):990–1002. doi: 10.1110/ps.073344908. [DOI] [PMC free article] [PubMed] [Google Scholar]
- 11.Zemla A. LGA: A method for finding 3D similarities in protein structures. Nucleic Acids Res. 2003;31(13):3370–3374. doi: 10.1093/nar/gkg571. [DOI] [PMC free article] [PubMed] [Google Scholar]
- 12.Zemla A, Venclovas, Moult J, Fidelis K. Processing and evaluation of predictions in CASP4. Proteins. 2001;(5):13–21. doi: 10.1002/prot.10052. [DOI] [PubMed] [Google Scholar]
- 13.Schwede T, Sali A, Honig B, Levitt M, Berman HM, Jones D, Brenner SE, Burley SK, Das R, Dokholyan NV, Dunbrack RL, Jr, Fidelis K, Fiser A, Godzik A, Huang YJ, Humblet C, Jacobson MP, Joachimiak A, Krystek SR, Jr, Kortemme T, Kryshtafovych A, Montelione GT, Moult J, Murray D, Sanchez R, Sosnick TR, Standley DM, Stouch T, Vajda S, Vasquez M, Westbrook JD, Wilson IA. Outcome of a Workshop on Applications of Protein Models in Biomedical Research. Structure. 2009;17(2):151–159. doi: 10.1016/j.str.2008.12.014. [DOI] [PMC free article] [PubMed] [Google Scholar]
Associated Data
This section collects any data citations, data availability statements, or supplementary materials included in this article.