

Abstract
Objective
To determine national readmission rates among sepsis survivors, variations in rates between hospitals, and determine if measures of quality correlate with performance on sepsis readmissions.
Design
Cross-sectional study of sepsis readmissions between 2008 and 2011 in the Medicare fee-for-service database.
Setting
Acute care, Medicare participating hospitals from 2008 to 2011.
Patients
Septic patients as identified by ICD-9 codes using the Angus method.
Measurements
We generated hospital-level, risk-standardized, 30-day readmission rates (RSRR) among survivors of sepsis and compared rates across region, ownership, teaching status, sepsis volume, hospital size, and proportion of underserved patients. We examined the relationship between RSRR and hospital-level composite measures of quality and mortality.
Main Results
From 633,407 hospitalizations among 3,315 hospitals from 2008–2011, median RSRR was 28.7% [IQR 26.1 to 31.9]. There were differences in RSRR by region (Northeast 30.4%, South 29.6%, Midwest 28.8%, and West 27.7%, p<0.001), teaching versus nonteaching status (31.1% vs. 29.0%, p<0.001), and hospitals serving the highest proportion of underserved patients (30.6 vs. 28.7%, p<0.001). The best performing hospitals on a composite quality measure had higher RSRR compared to the lowest (32.0% vs. 27.5%, p<0.001). RSRR was lower in the highest mortality hospitals compared to those in the lowest (28.7% vs. 30.7%, p<0.001).
Conclusion
One-third of sepsis survivors were readmitted and wide variation exists between hospitals. Several demographic and structural factors are associated with this variation. Measures of higher quality in-hospital care were correlated with higher readmission rates. Several potential explanations are possible including poor risk standardization, more research is needed.
Keywords: Sepsis, hospital readmission, quality of care
INTRODUCTION
Sepsis is a serious public health issue.(1) Inpatient spending on sepsis has risen in recent years to supplant childbirth as the costliest condition across all payers.(2) Thanks to advances in the care of sepsis, a greater number of individuals survive their episode of sepsis. Many such survivors experience a host of physical, neurocognitive, and psychiatric impairments that can last long after their stay in the hospital, (3–7) and put them at increased risk for healthcare utilization, including rehospitalization. (8) Furthermore, it is estimated that up to 40% of readmissions after discharge for sepsis are potentially preventable. [8] These readmissions have been shown to potentially cost one state, California, up to $500 million per year.(9) Given the increasing public health burden that sepsis survivors represent, it is likely that sepsis and sepsis readmissions will be a focus of policymakers in the near future.
To date, research on sepsis associated readmissions has focused on variation among academic medical centers, Veterans Administration Hospitals, or within individual cohorts and hospitals.(10–14) No national-level study has analyzed risk-standardized hospital-level readmission rates for sepsis in a policy relevant population to determine the extent to which sepsis readmissions vary across hospitals and the characteristics associated with such variability. Understanding this variability is important because policymakers rely heavily on the experience of the fee-for-service Medicare population in constructing risk-standardized quality measures for use in quality reporting and payment reform efforts (e.g., Accountable Care Organizations and value-based purchasing models).
We examined a three-year sample of fee-for-service Medicare patients who survived hospitalizations for sepsis. We sought to profile hospitals based on risk-standardized readmission rates for facilities participating in Medicare and characterize variations in these rates. In addition, we sought to determine if structural and demographic characteristics of these hospitals were associated with this variation. Lastly, we sought to determine if a composite measure of hospital quality consisting of an aggregate average of readmission and mortality outcomes, processes of care, and patient satisfaction correlated with sepsis associated readmissions.
MATERIALS AND METHODS
Study Design and Population
We performed a cross-sectional study of 3,315 acute care hospitals participating in Medicare from July 2008 to July 2011. We identified index hospitalizations among 100% of hospitalizations for fee-for-service Medicare beneficiaries aged 65 years or older who were discharged with a diagnosis of sepsis. We used International Classification of Diseases, Ninth Revision, Clinical Modification (ICD-9-CM) to identify index cases of sepsis utilizing the Angus method, a validated technique to identify patients with sepsis in administrative databases.(15) The Angus method identifies an organ dysfunction in combination with an infection. This parallels the recent International Consensus Definition, which delineates sepsis as, “life-threatening organ dysfunction caused by a dysregulated host response to infection”.(16) To identify index admissions and readmissions, we mirrored Centers for Medicare and Medicaid Services (CMS) methods used to identify similar measures in acute myocardial infarction (AMI), pneumonia (PN), and heart failure (HF).(17) We excluded index admissions for individuals who were ineligible for fee-for-service Medicare benefits in the 30-day period after discharge, index hospitalizations involving a transfer to another acute care facility, and those discharged against medical advice. We also excluded hospitalizations that occurred after the index one for sepsis (the first admission for sepsis) beyond the 30-day period to ensure that a single individual was not counted multiple times as an admission in the data. This was done to prevent correlated data that would violate our regression principles. Patients were not excluded if they died during the 30-day period after discharge. A flow diagram illustrating exclusions can be seen in the supplemental appendix (Online appendix, Figure 1). Due to no patient-level data being included in the final analysis, approval for non-human subject research was granted by the Vanderbilt University Internal Review Board. The institutional review board at University of Michigan Hospital also reviewed the protocol and approved of the study (HUM00053488).
Figure 1.
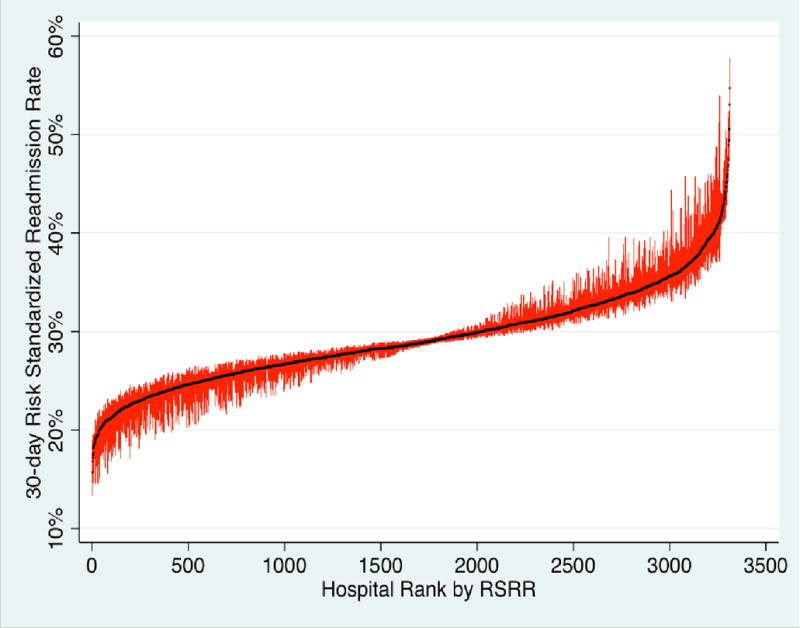
Caterpillar plot of 3,315 individual Medicare participating hospitals, their sepsis associated risk-standardized readmission rate (RSRR), and 95% confidence intervals. Hospitals are displayed on the X-axis ranked according to their RSSR. The median RSRR was 28.7% (IQR 26.1 to 31.9). These data show dramatic variation in risk-standardized readmission performance by individual hospitals.
Hospital-Level Data Collection and Covariates
We linked hospitals to the CMS Hospital Compare data from 2008 to 2010 and the American Hospital Association (AHA) Database from 2008 to 2010 to obtain data on region, hospital size as measured by total number of beds, disproportionate share hospital percentage (a proxy for the uncompensated care burden), teaching status, hospital ownership, hospital quality measures, and other characteristics known to influence readmission rates in prior literature.(18, 19) We defined major teaching status as being a member of the Council of Teaching Hospitals and Health Systems (COTH) of the Association of American Medical Colleges identified within the AHA database. To define sepsis case volume, we determined the average number of sepsis cases for each hospital as the average number of cases per year over the three-year period between 2008 and 2011 as determined by the Angus Method described above. We defined hospital size as the total number of hospital beds identified within the AHA database. We used percent disproportionate share spending as a proxy for the burden of uncompensated care provided by a hospital.(20)
We generated an overall hospital quality score based on archived Hospital Compare data. This composite score was based on consistently measured individual quality measures defined for domains of process quality (seven measures), readmission and mortality rates for AMI, PN, and HF, and patient experience as measured in the Hospital Consumer Assessment of Health Care Providers and Systems (HCAHPS) surveys (ten measures). Our composite quality score was constructed by standardizing and re-scaling each input measure such that higher numbers denoted better quality. We then fit a summary index score that summarized overall hospital performance on process, outcome, and patient experience domains using a generalized least squares estimator that maximized the amount of information contributed by each input.(21) For domains where the input measures were defined on the same scale (e.g., 30-day risk standardized outcome rates), sensitivity analyses considered composite scores based on the pooled mean of the (unstandardized) inputs. We did not weight composite scores by patient caseloads to ensure that the measures measured the same construct across hospitals. Further details on how we constructed the composite quality score can be found in the supplemental online appendix. (Online Supplemental Appendix)
Generation of Hospital-Level Readmission Rates
We defined 30-day all-cause readmission as any admission to an acute care hospital within 30 days of discharge among individuals who survived the index hospitalization for sepsis. We then generated 30-day all-cause risk-standardized readmission rates for each hospital over the three-year period and corresponding 95% confidence intervals using previously validated techniques employed by the Centers for Medicare and Medicaid Services (CMS) to generate readmission rates for acute myocardial infarction, pneumonia, heart failure, and chronic obstructive pulmonary disease. Specifically, these measures profiled the readmission performance of each hospital using an indirect standardization estimator that compared the observed number of readmissions to the expected number given the hospital’s case mix. Using a logistic regression model with a random intercept for each hospital, we estimated a predicted probability of 30-day readmission for each patient accounting for the patient’s characteristics (age, sex, race) and comorbidities captured in the inpatient claim as measured using the Elixhauser Method applied to the index hospitalization.(22, 23) The predicted probabilities from this model were summed over all patients by hospital and then divided by the sum of all expected probabilities of admission that were estimated only from the patient characteristics. This ratio was then multiplied by the overall 30-day readmission rate in the sample to get the hospital specific RSRR.
Statistical Analysis
We plotted sepsis RSRR and 95% CI for each hospital in rank order in a caterpillar plot. We described geographic variability in RSRR by aggregating and mapping RSRR by health referral regions. We also compared the mean RSRR across quartiles of our exposures of interest after adjusting for geographic region. Exposures of interest included region; size of hospital; sepsis case volume per year; proportion of underserved patients; teaching status; hospital owner; and the composite quality, process, and patient satisfaction metrics described above. We performed one-way analysis of variance with Bonferroni correction (alpha=0.05) to adjust for multiple comparisons. To assess for normal distribution, we plotted RSRR and composite quality score on histograms and both appeared to be normally distributed. We then plotted RSRR vs. composite quality. Loess smoothing was utilized to generate non-parametric locally-weighted regression curves. We generated a Pearson correlation coefficient for the relationship between RSRR and composite quality. We used STATA V13 (College Station, TX) for all analyses.
RESULTS
There were 633,407 hospitalizations for sepsis in 3,315 hospitals included in the study cohort. The mean 30-day RSRR was 29.2% (SD +/− 4.8) for survivors of sepsis during the study period. Characteristics of patients included in the cohort are summarized in Table 1. There was wide variation in hospital-level risk-standardized readmission rates ranging from 22.2% at the 5th percentile to 37.8% at the 95% percentile (Figure 1). Mean RSRR also varied across hospital referral region level (Online Appendix, Table 1). Hospitals in the Northeast had the highest risk-standardized readmission rates (mean RSRR 30.3%) and those in the West having the lowest (mean RSRR 27.7%, p<0.001 for difference across all regions) (Table 2).
Table 1.
Summary Characteristics of Patients in Cohort
| Sepsis hospitalizations | ||||
|---|---|---|---|---|
| Characteristic, % | Total cohort | No readmission | 30-day readmission | P |
| Number | 633,407 | 449,509 | 183,898 | |
| Age, mean (SD) | 79(8) | 79(8) | 79(8) | 0.99 |
| 65–74, % | 31 | 31 | 30 | |
| 75–84, % | 38 | 38 | 37 | |
| > 85, % | 32 | 32 | 32 | |
| Female, % | 56 | 56 | 56 | 0.06 |
| Race/Ethnicity, % | <0.001 | |||
| White | 83 | 84 | 80 | |
| Black | 11 | 10 | 14 | |
| Other | 6 | 6 | 6 | |
| Median Income by Zip Code, % | <0.001 | |||
| < $40,000 | 25 | 25 | 26 | |
| $40,000–$100,000 | 70 | 70 | 69 | |
| > $100,000 | 5 | 5 | 5 | |
| Elixhauser Comorbidities at Admission, % | ||||
| Congestive Heart Failurea | 22 | 20 | 25 | <0.001 |
| Valvular Disease | 3 | 3 | 2 | <0.001 |
| Pulmonary Circulation Disorders | 2 | 2 | 3 | <0.001 |
| Peripheral Vascular Disorders | 4 | 4 | 4 | <0.001 |
| Paralysis | 5 | 5 | 6 | <0.001 |
| Other Neurological Disorders | 11 | 11 | 11 | 0.16 |
| Chronic Pulmonary Disease | 18 | 18 | 18 | 0.93 |
| Uncomplicated Diabetes | 16 | 16 | 15 | <0.001 |
| Complicated Diabetes | 4 | 4 | 4 | <0.001 |
| Hypothyroidism | 6 | 7 | 5 | <0.001 |
| Renal Failure | 15 | 14 | 17 | <0.001 |
| Liver Disease | 1 | 1 | 1 | <0.01 |
| Peptic Ulcer Disease | 0 | 0 | 0 | 0.98 |
| AIDS | 0 | 0 | 0 | 0.99 |
| Lymphoma | 2 | 2 | 2 | <0.001 |
| Metastatic Cancer | 3 | 3 | 3 | 0.41 |
| Solid Tumor | 3 | 3 | 3 | 0.99 |
| Collagen Vascular Disease | 2 | 2 | 2 | <0.001 |
| Coagulopathy | 6 | 6 | 5 | <0.001 |
| Obesity | 2 | 2 | 2 | <0.001 |
| Weight Loss | 13 | 12 | 15 | <0.001 |
| Fluid and Electrolyte Disorders | 44 | 44 | 44 | 0.38 |
| Blood Loss Anemia | 0 | 0 | 1 | <0.01 |
| Deficiency Anemias | 11 | 11 | 11 | <0.001 |
| Alcohol Abuse | 0 | 0 | 0 | <0.001 |
| Drug Abuse | 0 | 0 | 0 | 0.33 |
| Psychoses | 2 | 2 | 3 | <0.001 |
| Depression | 3 | 3 | 3 | <0.001 |
| Hypertension | 38 | 39 | 34 | <0.001 |
Note: 2010 Census data did not provide the Median Household Income information for 14,221 observed zip codes (2.25%); the percentages were calculated based on 619,930 observations
Table 2.
Readmission Rates Stratified by Demographic Characteristics of Hospitals
| Hospital Demographics | Mean RSRR | P |
|---|---|---|
| Region | <0.001 | |
| Northeast | 30.4% | |
| South | 29.6% | |
| Midwest | 28.8% | |
| West | 27.7% | |
| Teaching Status | <0.001 | |
| Non-teaching | 29.0% | |
| Minor-Teaching | 29.4% | |
| Major Teaching | 31.1% | |
| Sepsis Volume, cases/yr.* | 0.18 | |
| 0–15 | 28.9% | |
| 15–41 | 29.2% | |
| 41–89 | 29.4% | |
| >89 | 29.4% | |
| Hospital Size, beds | <0.001 | |
| 0–35 | 29.2% | |
| 36–87 | 28.7% | |
| 88–203 | 29.1% | |
| >=204 | 29.7% | |
| Disproportionate Share Payments, % | <0.001 | |
| 0–15% | 28.7% | |
| 15–23% | 28.8% | |
| 23–34% | 28.9% | |
| >34% | 30.6% | |
| Hospital Ownership | 0.38 | |
| For-Profit | 29.1% | |
| Non-Profit | 29.5% | |
| Government | 29.2% |
Sepsis cases/yr were defined as the average number Angus Method defined cases of sepsis over a three-year period at a given hospital.
Major teaching hospitals had higher RSRR than nonteaching (31.1% vs. 29.0%, p<0.001). There were statistically significant but clinically small differences in RSRR by quartile of hospital size. Hospitals with a larger share of indigent patients (i.e., those in the highest quartile of the DSH index) had greater RSRR compared to the three lower quartiles (30.6% vs. 28.9%, 28.8%, and 28.7% respectively, p<0.001). Summaries of RSRR stratified by hospital characteristic are in Table 2.
Due to some hospitals not reporting all quality measures that made up our composite index (mostly due to minimum case volume requirements), we had composite quality data for 1,966 of the 3,315 hospitals in our cohort. Differences in hospital characteristics between those with and without quality data may be seen in the online supplement. Among hospitals with quality data, there was a stepwise increase in the RSRR moving from worse to better quartiles of our composite measure (for AMI, PN, and HF; p-value for nonparametric test of trend = <0.001). The highest performing hospitals based on the composite index had 4.5 percentage points (ppt.) higher sepsis readmission rates compared to the poorest performing hospitals, (27.5% vs. 32%, p<0.001), (Table 3a, Figure 2). Increasing readmission rate showed a significant positive correlation with better performance on the composite quality score (Pearson coefficient 0.34, p<0.001). Hospitals in the highest proportion of composite all-cause mortality had the lowest readmission rates and were significantly lower than those in the lowest quartile (28.7% vs. 30.7%, p<0.001), (Table 3b). Results were nearly identical in sensitivity analyses utilizing a hospital referral region (HRR) fixed effect, which effectively made comparisons among hospitals within the same HRR.
Table 3a.
Readmission Rates by Quartile of Composite Quality Measurement
| Composite Quality Score – better quality by increasing quartile | Mean RSRR | P< 0.001 |
|---|---|---|
| 1st Quartile | 27.5% | |
| 2nd Quartile | 29.2% | |
| 3rd Quartile | 29.7% | |
| 4th Quartile | 32.0% |
Figure 2.
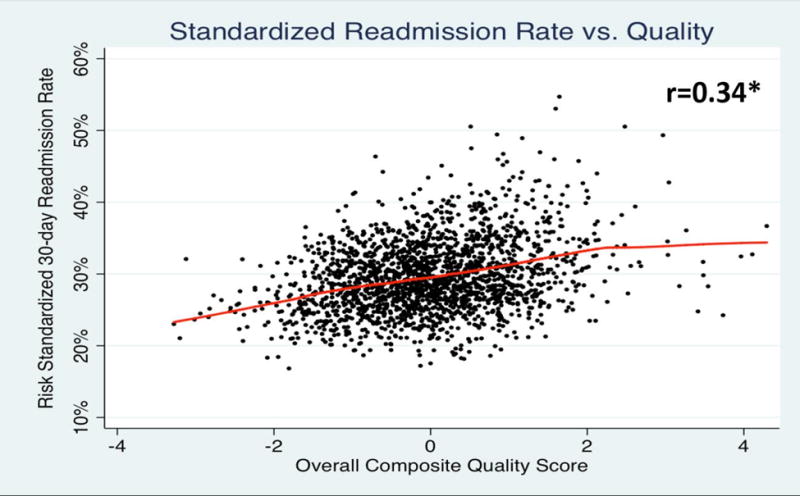
Scatter plot with Loess fit curve of risk-standardized readmission rates (RSRR) versus composite quality scores. Composite quality scores are a composite average of outcomes measures (readmission and mortality rates), process of care measures, and patient satisfaction. These data show that hospitals that perform well on traditional composite quality measures have significantly higher readmission rates for sepsis. This suggests that there may be problems with using traditional administrative data risk adjustment in conditions with high severity of illness and mortality, such as sepsis.
Table 3b.
Readmission Rates by Quartile of Composite All-Cause Mortality Measurement
| Composite Mortality Score – higher mortality by increasing quartile. | Mean RSRR | P<0.001 |
|---|---|---|
| 1st Quartile | 30.7% | |
| 2nd Quartile | 29.9% | |
| 3rd Quartile | 29.0% | |
| 4th Quartile | 28.7% |
DISCUSSION
Using a national sample, we determined that nearly one-third of fee-for-service Medicare patients hospitalized with sepsis were readmitted within 30 days of discharge. Risk-standardized readmission rates for sepsis varied more than fourfold across hospitals and by a standard deviation across geographical regions. Hospitals profiled with higher readmission rates more often cared for patients with low socioeconomic status and were major teaching hospitals. High sepsis readmission hospitals were also more likely to score higher on a composite measure of quality spanning performance on process measures, patient experience of care, and risk-standardized readmission and mortality for acute myocardial infarction, heart failure, and pneumonia. Our observations in the degree of variation in sepsis associated RSRR were similar to prior observations in variation of RSRR for other populations.(19, 24)
Our study is among the first to provide a national estimate of the burden of sepsis readmissions in the Medicare population and sets the stage for potential policy measures to address sepsis readmissions. There are several important differences between our work and prior work examining sepsis readmissions. Prior studies primarily focus on large, academic medical centers with data extracted from the University Health Consortium database.(11, 12, 25) While one study at major academic institutions put this estimate at 19.9%,(25) others place it at between 23.4% and 27.3%. (11–13) Academic centers represent the minority of all hospitals nationwide and care for a minority of sepsis cases. Other studies illustrate similar readmission rates but only provide crude rates without risk adjustment, making them less applicable to comparing hospital performance and policy related questions.(8, 13) A recent study in the Veteran population examined 90-day all cause readmission and found little variation between readmission rates across hospitals.(14) However, care across Veterans hospitals may be more uniform and involves a different population than the Medicare population used in this study. That particular study focuses on reasons for 90-day readmission at a patient level while this study seeks to describe performance at a hospital level. In contrast, we utilized a nationwide database including all hospitals, both community and academic, and provide risk-standardized estimates of readmission. Finally, we focused on the population of Medicare beneficiaries with sepsis. Because the Centers for Medicare & Medicaid Services (CMS) is responsible for setting national policies for the quality of hospital-based care, it is important to have nationwide estimates for sepsis related readmissions that derive from the Medicare population.
We also identified variation in RSRR across both hospitals and hospital referral regions. Our data showed that hospitals in the 5th percentile of admissions had a rate of 22.2% while hospitals in the 95th percentile had a rate of 37.8%. Regions that typically perform very well on traditional quality metrics, such as the Northeast, perform poorly on sepsis-associated readmissions (Online Appendix, Figure 2). Again, this may be due to differences in underlying severity of illness amongst septic patients in the Northeast.
Hospitals in the highest quartile percent disproportionate share spending, reflecting a higher burden of socioeconomically disadvantaged patients, had higher RSRR than those in the lower three quartiles (Table 2). In addition, major teaching hospitals had 1.6% higher readmission rates than their non-teaching counterparts (Table 2). This is consistent with previous findings in other CMS-tracked conditions.(20) While both of these differences may reflect differences in case mix, it may lead to hospitals caring for underserved populations or major teaching institutions being unfairly penalized. A potential solution may be to compare these institutions across strata of characteristics found to be significant, i.e., across quartile of percent underserved population or across teaching status.
We show a positive correlation between a composite quality metric and readmissions and that hospitals that perform well on publicly-reported measures of hospital quality paradoxically perform poorly on sepsis associated readmissions (Table 3a, Figure 2). Recent studies have shown similar inverse relationships between composite measures of quality and performance on specific measures, in this instance reduction in hospital acquired conditions.(26) This study also found that major teaching hospitals were penalized more frequently under the Hospital Acquired Conditions (HAC) Reduction Program. They concluded that these findings could warrant a different approach to assessing hospital penalties. It is possible that these high performing institutions are also the major teaching institutions that take care of sicker and more complex sepsis patients, and this is not captured in the risk adjustment method. A particular concern with profiling hospitals using administrative data is that such data may be insufficient to capture the clinical, demographic, and socio-economic factors that may contribute to greater need for rehospitalization after discharge.(27) We demonstrate that higher mortality hospitals have lower RSRR for sepsis, raising the possibility that these poorly performing hospitals may have overall higher mortality and fewer sepsis patients eligible for readmission (Table 3b). This competing risk represents further complexity when attempting to measure sepsis associated readmissions and compare these rates at a hospital level.
Our study has several strengths. It is the first study, to our knowledge, that uses nationwide health systems-level data to generate sepsis associated risk-standardized readmission rates. In addition, it uses what is largely considered to be the most accurate methods for identifying true cases of sepsis in administrative data.(28) We also benefit from a large sample size and broad range of hospitals. Finally, we use new and novel measures of composite quality and patient satisfaction yielding correlations between hospital quality and patient satisfaction that have not been reported in the sepsis literature.
There are several important limitations to our study. First, as in any study of sepsis readmissions, it is difficult to completely adjust for casemix and severity of illness across hospitals; however, we employed similar methods to risk adjust readmission rates that CMS employs when generating readmission rates for AMI, CHF, and pneumonia. Although our risk adjustment model used only the index admission, as opposed to traditional CMS methods using a year worth of claims, this approach provides similar performance (29). For example, McCrum et al. used very similar techniques in a study published in 2013, specifically correlating risk-standardized mortality rates (RSMR) calculated similarly to our method with composite mortality scores.(30) Second, the inclusion of only elderly Medicare patients may limit generalizability of our findings to younger populations. However, sepsis incidence is age-related and Medicare patients bear the greatest burden of sepsis, suggesting policy decisions based upon this population will target the greatest number of patients. Lastly, there were significant differences between hospitals that reported quality data and those that did not. Those reporting data tended to be larger, have larger case volumes of sepsis, have lower proportions of underserved patients as represented by percent disproportionate share spending, and are teaching hospitals. This suggests that the relationship between sepsis readmission rates and hospital quality in our analysis may be exaggerated given that higher performing institutions may be over represented and poorly performing hospitals may tend to under report.
In conclusion, this study represents the first multi-institutional, nationwide study of risk- standardized readmission rates among patients with sepsis. Readmission rates were significantly higher than other CMS tracked conditions and higher than prior estimates. Major teaching hospitals and those who care for the highest quartiles of poor patients had higher readmission rates. Hospitals performing better on traditional quality metrics performed worse on sepsis associated readmissions. Hospitals in the highest quartile of composite all-cause mortality had significantly lower RSRR than those in the higher quartiles. Potential explanations for these observations are limitations of risk-standardization in complex conditions such as sepsis, competing risk between mortality and readmission, and differences in discharge practices among higher performing hospitals. Prior studies have suggested that demographic and structural variables of hospitals are important variables and need to be included in risk standardization models.(31, 32) However, not all literature suggests this adds value to the readmissions measurement.(33, 34) Alternately, given the great difficulty of standardization on casemix in complex conditions such as sepsis, one could consider stratifying hospitals by these important demographic and structural variables and comparing across strata. Policymakers and clinicians should keep these important observations in mind when comparing hospital performance on sepsis readmission metrics.
Supplementary Material
Online Appendix Figure 1: Flow diagram illustrating cohort identification and exclusions leading the final number of identified cases used for analysis, n=633,407.
Online Appendix Figure 2: Heat map of quartiles of mean RSRR by Dartmouth Atlas Designated Hospital Referral Region. Lighter sections indicate hospitals in the lowest quartile and darker sections are those in the highest quartile. These data show significant variation both by geographic region and hospital referral region. The similarities between areas that perform well (Northeast) and poorly (Appalachia) on traditional measures of quality highlights potential issues with risk standardization in sepsis.
Acknowledgments
Funding Source:
This work was supported by NIH UL1TR00445 and AG027472
Copyright form disclosure: Dr. Norman received support for article research from the National Institutes of Health (NIH). Dr. Cooke’s institution received funding from Agency for Healthcare Research and Quality (AHRQ), and he received support for article research from AHRQ. Dr. Ely received support for article research from the NIH; he received funding from Orion, Abbott, and Hospira; and his institution received funding from the NIH and from VA funding. Dr. Graves disclosed that he does not have any potential conflicts of interest.
Footnotes
Institution: Vanderbilt University School of Medicine
References
- 1.Angus DC. The lingering consequences of sepsis: a hidden public health disaster? Jama. 2010;304(16):1833–1834. doi: 10.1001/jama.2010.1546. [DOI] [PubMed] [Google Scholar]
- 2.Torio CM(AHRQ)ARA. National Inpatient Hospital Costs: The Most Expensive Conditions by Payer, 2011. HCUP Statistical Brief #160. 2013 [Google Scholar]
- 3.Pandharipande PP, Girard TD, Jackson JC, et al. Long-term cognitive impairment after critical illness. N Engl J Med. 2013;369(14):1306–1316. doi: 10.1056/NEJMoa1301372. [DOI] [PMC free article] [PubMed] [Google Scholar]
- 4.Jackson JC, Pandharipande PP, Girard TD, et al. Depression, post-traumatic stress disorder, and functional disability in survivors of critical illness in the BRAIN-ICU study: a longitudinal cohort study. Lancet Respir Med. 2014;2(5):369–379. doi: 10.1016/S2213-2600(14)70051-7. [DOI] [PMC free article] [PubMed] [Google Scholar]
- 5.Griffiths J, Fortune G, Barber V, et al. The prevalence of post traumatic stress disorder in survivors of ICU treatment: a systematic review. Intensive Care Med. 2007;33(9):1506–1518. doi: 10.1007/s00134-007-0730-z. [DOI] [PubMed] [Google Scholar]
- 6.Fan E, Zanni JM, Dennison CR, et al. Critical illness neuromyopathy and muscle weakness in patients in the intensive care unit. AACN Adv Crit Care. 2009;20(3):243–253. doi: 10.1097/NCI.0b013e3181ac2551. [DOI] [PubMed] [Google Scholar]
- 7.Needham DM, Dinglas VD, Morris PE, et al. Physical and cognitive performance of patients with acute lung injury 1 year after initial trophic versus full enteral feeding. EDEN trial follow-up American journal of respiratory and critical care medicine. 2013;188(5):567–576. doi: 10.1164/rccm.201304-0651OC. [DOI] [PMC free article] [PubMed] [Google Scholar]
- 8.Prescott HC, Langa KM, Iwashyna TJ. Readmission diagnoses after hospitalization for severe sepsis and other acute medical conditions. Jama. 2015;313(10):1055–1057. doi: 10.1001/jama.2015.1410. [DOI] [PMC free article] [PubMed] [Google Scholar]
- 9.Chang DW, Tseng CH, Shapiro MF. Rehospitalizations Following Sepsis: Common and Costly. Critical care medicine. 2015;43(10):2085–2093. doi: 10.1097/CCM.0000000000001159. [DOI] [PMC free article] [PubMed] [Google Scholar]
- 10.Donnelly JP, Hohmann SF, Wang HE. Unplanned Readmissions After Hospitalization for Severe Sepsis at Academic Medical Center-Affiliated Hospitals. Critical care medicine. 2015;43(9):1916–1927. doi: 10.1097/CCM.0000000000001147. [DOI] [PMC free article] [PubMed] [Google Scholar]
- 11.Jones TK, Fuchs BD, Small DS, et al. Post-Acute Care Use and Hospital Readmission after Sepsis. Annals of the American Thoracic Society. 2015;12(6):904–913. doi: 10.1513/AnnalsATS.201411-504OC. [DOI] [PMC free article] [PubMed] [Google Scholar]
- 12.Ortego A, Gaieski DF, Fuchs BD, et al. Hospital-based acute care use in survivors of septic shock. Critical care medicine. 2015;43(4):729–737. doi: 10.1097/CCM.0000000000000693. [DOI] [PMC free article] [PubMed] [Google Scholar]
- 13.Goodwin AJ, Rice DA, Simpson KN, et al. Frequency, cost, and risk factors of readmissions among severe sepsis survivors. Critical care medicine. 2015;43(4):738–746. doi: 10.1097/CCM.0000000000000859. [DOI] [PMC free article] [PubMed] [Google Scholar]
- 14.Prescott HC. Variation in Post-Sepsis Readmission Patterns: A Cohort Study of Veterans Affairs Beneficiaries. Annals of the American Thoracic Society. 2016 doi: 10.1513/AnnalsATS.201605-398OC. [DOI] [PMC free article] [PubMed] [Google Scholar]
- 15.Angus DC, Wax RS. Epidemiology of sepsis: an update. Critical care medicine. 2001;29(7 Suppl):S109–116. doi: 10.1097/00003246-200107001-00035. [DOI] [PubMed] [Google Scholar]
- 16.Singer M, Deutschman CS, Seymour CW, et al. The Third International Consensus Definitions for Sepsis and Septic Shock (Sepsis-3) Jama. 2016;315(8):801–810. doi: 10.1001/jama.2016.0287. [DOI] [PMC free article] [PubMed] [Google Scholar]
- 17.Evaluation YNHHSCCfOR. 2013 Measures Updates and Specifications Report: Hospital-Level 30-Day Risk-Standardized Readmission Measures for Acute Myocardial Infarction, Heart Failure, and Pneumonia (Version 6.0) 2013 [Google Scholar]
- 18.Merkow RP, Ju MH, Chung JW, et al. Underlying reasons associated with hospital readmission following surgery in the United States. Jama. 2015;313(5):483–495. doi: 10.1001/jama.2014.18614. [DOI] [PubMed] [Google Scholar]
- 19.Tsai TC, Joynt KE, Orav EJ, et al. Variation in surgical-readmission rates and quality of hospital care. The New England journal of medicine. 2013;369(12):1134–1142. doi: 10.1056/NEJMsa1303118. [DOI] [PMC free article] [PubMed] [Google Scholar]
- 20.Joynt KE, Jha AK. Characteristics of hospitals receiving penalties under the Hospital Readmissions Reduction Program. Jama. 2013;309(4):342–343. doi: 10.1001/jama.2012.94856. [DOI] [PubMed] [Google Scholar]
- 21.Anderson ML. Journal of the. 484 Vol. 103. American statistical Association; 2008. Multiple inference and gender differences in the effects of early intervention: A reevaluation of the Abecedarian, Perry Preschool, and Early Training Projects. [Google Scholar]
- 22.Elixhauser A(AHRQ)SCA. Readmissions to U.S. Hospitals by Diagnosis, 2010. HCUP Statistical Brief #153. 2010 [cited 2013] April Available from: http://www.hcup-us.ahrq.gov/reports/statbriefs/sb153.pdf.
- 23.Elixhauser A(AHRQ)SCA. Readmissions to US Hospitals by Diagnosis, 2010. Agency for Healthcare Research and Quality; 2013. Apr, 2013. [PubMed] [Google Scholar]
- 24.Goodman DCF, Elliott S, Chiang-Hua, Chang After Hospitalization: A Dartmouth Atlas Report on Readmissions Among Medicare Beneficiaries: The Dartmouth Institute For Health Policy and Clinical Practice. 2013 [PubMed] [Google Scholar]
- 25.Donnelly JP, Hohmann SF, Wang HE. Unplanned Readmissions After Hospitalization for Severe Sepsis at Academic Medical Center-Affiliated Hospitals. Critical care medicine. 2015 doi: 10.1097/CCM.0000000000001147. [DOI] [PMC free article] [PubMed] [Google Scholar]
- 26.Rajaram R, Chung JW, Kinnier CV, et al. Hospital Characteristics Associated With Penalties in the Centers for Medicare & Medicaid Services Hospital-Acquired Condition Reduction Program. Jama. 2015;314(4):375–383. doi: 10.1001/jama.2015.8609. [DOI] [PubMed] [Google Scholar]
- 27.Committee: TC-CWP. Ash Arlene S PSEF, PhD, Louis Thomas A, PhD, Normand Sharon-Lise T, PhD, Stukel Therese A, PhD, Utts Jessica, PhD. Statistical Issues in Assessing Hospital Performance.cms.gov: Committee of Presidents of Statistical Societies. 2012 [Google Scholar]
- 28.Iwashyna TJ, Odden A, Rohde J, et al. Identifying patients with severe sepsis using administrative claims: patient-level validation of the angus implementation of the international consensus conference definition of severe sepsis. Medical care. 2014;52(6):e39–43. doi: 10.1097/MLR.0b013e318268ac86. [DOI] [PMC free article] [PubMed] [Google Scholar]
- 29.Li P, Kim MM, Doshi JA. Comparison of the performance of the CMS Hierarchical Condition Category (CMS-HCC) risk adjuster with the Charlson and Elixhauser comorbidity measures in predicting mortality. BMC health services research. 2010;10:245. doi: 10.1186/1472-6963-10-245. [DOI] [PMC free article] [PubMed] [Google Scholar]
- 30.McCrum ML, Joynt KE, Orav EJ, et al. Mortality for publicly reported conditions and overall hospital mortality rates. JAMA internal medicine. 2013;173(14):1351–1357. doi: 10.1001/jamainternmed.2013.7049. [DOI] [PubMed] [Google Scholar]
- 31.Nagasako EM, Reidhead M, Waterman B, et al. Adding socioeconomic data to hospital readmissions calculations may produce more useful results. Health affairs (Project Hope) 2014;33(5):786–791. doi: 10.1377/hlthaff.2013.1148. [DOI] [PMC free article] [PubMed] [Google Scholar]
- 32.Hu J, Gonsahn MD, Nerenz DR. Socioeconomic status and readmissions: evidence from an urban teaching hospital. Health affairs (Project Hope) 2014;33(5):778–785. doi: 10.1377/hlthaff.2013.0816. [DOI] [PubMed] [Google Scholar]
- 33.Bernheim SM, Parzynski CS, Horwitz L, et al. Accounting For Patients’ Socioeconomic Status Does Not Change Hospital Readmission Rates. Health affairs (Project Hope) 2016;35(8):1461–1470. doi: 10.1377/hlthaff.2015.0394. [DOI] [PMC free article] [PubMed] [Google Scholar]
- 34.Blum AB, Egorova NN, Sosunov EA, et al. Impact of socioeconomic status measures on hospital profiling in New York City. Circulation Cardiovascular quality and outcomes. 2014;7(3):391–397. doi: 10.1161/CIRCOUTCOMES.113.000520. [DOI] [PMC free article] [PubMed] [Google Scholar]
Associated Data
This section collects any data citations, data availability statements, or supplementary materials included in this article.
Supplementary Materials
Online Appendix Figure 1: Flow diagram illustrating cohort identification and exclusions leading the final number of identified cases used for analysis, n=633,407.
Online Appendix Figure 2: Heat map of quartiles of mean RSRR by Dartmouth Atlas Designated Hospital Referral Region. Lighter sections indicate hospitals in the lowest quartile and darker sections are those in the highest quartile. These data show significant variation both by geographic region and hospital referral region. The similarities between areas that perform well (Northeast) and poorly (Appalachia) on traditional measures of quality highlights potential issues with risk standardization in sepsis.