Abstract
Background & Aims
N-linked glycosylation of proteins is critical for proper protein folding and trafficking to the plasma membrane. Drug transporters are one class of proteins that have reduced function when glycosylation is impaired. N-linked glycosylation of plasma proteins has also been investigated as a biomarker for several liver diseases, including non-alcoholic fatty liver disease (NAFLD). The purpose of this study was to assess the transcriptomic expression of genes involved in protein processing and glycosylation, and to determine the glycosylation status of key drug transporters during human NAFLD progression.
Methods
Human liver samples diagnosed as healthy, steatosis, and nonalcoholic steatohepatitis (NASH) were analyzed for gene expression of glycosylation-related genes and for protein glycosylation using immunoblot.
Results
Genes involved in protein processing in the ER and biosynthesis of N-glycans were significantly enriched for downregulation in NAFLD progression. Included in the down regulated N-glycan biosynthesis category were genes involved in the oligosaccharyltransferase complex, N-glycan quality control, N-glycan precursor biosynthesis, N-glycan trimming to the core, and N-glycan extension from the core. N-glycan degradation genes were unaltered in the progression to NASH. Immunoblot analysis of the uptake transporters organic anion transporting polypeptide-1B1 (OATP1B1), OATP1B3, OATP2B1, and Sodium/Taurocholate Co-transporting Polypeptide (NTCP) and the efflux transporter multidrug resistance-associated protein 2 (MRP2) demonstrated a significant loss of glycosylation following the progression to NASH.
Conclusions
These data suggest that the loss of glycosylation of key uptake and efflux transporters in human NASH may influence transporter function and contribute to altered drug disposition observed in NASH.
Keywords: Nonalcoholic steatohepatitis, N-linked glycosylation, drug transporters, hepatobiliary drug disposition
Introduction
N-linked glycosylation of membrane bound and secreted proteins has many biological functions including protein maturation, stability and quality control. The process of N-linked glycosylation occurs in specific sections of the endoplasmic reticulum (ER) and Golgi apparatus and involves N-glycan precursor formation, transfer to nascent proteins, trimming to the core structure, and extension from the core.1,2 Serum N-glycan biomarker data suggest that these processes may be perturbed in many liver diseases,3 including non-alcoholic fatty liver disease (NAFLD),4 which is an increasingly common progressive liver disease characterized by fat accumulation and inflammation within the liver in the absence of significant alcohol consumption. The prevalence of NAFLD is estimated to be 30–40% in the U.S. adult population, and the prevalence of the most severe form, known as non-alcoholic steatohepatitis (NASH), is estimated to be between 5–17%.5 Serum biomarker data indicate that an increase in fully agalactosylated α-1,6 fucosylated bisecting biantennary IgG can distinguish steatosis from NASH6 or coincides with increased fibrosis stage.7 In type 2 diabetes, a common comorbidity of NAFLD, the amount of α-1,6 fucosylated proteins in the serum was increased due to increased expression of α-1,6-fucosyltransferase (FUT8).8 Although these clinical data suggest impaired hepatic N-linked glycosylation in NAFLD, to date the expression of the hepatic genes involved in N-linked glycosylation has not been determined in NAFLD progression.
Membrane bound drug transporters are one specific group of hepatic proteins that are dependent on proper N-linked glycosylation for protein folding, trafficking to the appropriate domain of polarized cells, and transport function.2,9,10 These transport proteins are expressed on the basolateral and apical membranes of hepatocytes and are responsible for movement of endogenous and exogenous compounds into and out of hepatocytes. It has been shown that proper glycosylation of hepatic uptake and efflux transporters is required for the hepatobiliary elimination of drugs.11–14 Any perturbations in the process of N-linked glycosylation that result in incomplete glycosylation of transporters will reduce the membrane expression and function of the transporters and can potentially impact drug clearance and toxicity. Although we have previously reported an increase in the amount of unglycosylated multidrug resistance-associated protein 2 (MRP2) in human NASH livers,15 it is currently unknown if this phenomenon occurs for other hepatic transporters.
We hypothesized that NASH livers will have altered expression of genes involved in N-linked glycosylation and consequent changes in drug transporter glycosylation. In this study we performed gene set enrichment analysis on human liver transcriptomic data for genes involved in protein processing in the ER, protein export, N-glycan biosynthesis, and N-glycan degradation in samples diagnosed as healthy, steatosis, and NASH. Western blots were performed to determine the glycosylation status of hepatic uptake and efflux drug transporters.
Materials and Methods
Human Liver Samples
Human liver tissue samples collected postmortem were purchased from the National Institutes of Health-funded Liver Tissue Cell Distribution System. For clinical and demographic information of these human liver samples, refer to a previous publication by Fisher et. al.16 The samples were diagnosed as normal, steatotic, NASH with fatty liver, and NASH without fatty liver according to the NAFLD activity scoring categorization by a trained pathologist.17 Steatosis was diagnosed by >10% fat deposition within hepatocytes without inflammation or fibrosis. NASH with fatty liver was characterized by >5% fat deposition with accompanied inflammation and fibrosis. NASH without fatty liver was identified by <5% fat deposition and increased inflammation and fibrosis. All transcript and protein analyses were performed using the four diagnosis categories outlined above but because there were no statistical differences between the two NASH categories, these two categories were combined creating a single NASH group.
Microarray Gene Expression Analysis
The microarray hybridization and analysis were performed in a previously published study by Lake et. Al.18 Briefly, Affymetrix GeneChip Human 1.0 ST Arrays (Affymetrix, Santa Clara, CA) were used and 33,252 genes were analyzed for differential expression. Affymetrix® Power Tools software was employed to generate gene-level and exon-level expression signal estimates from CEL files using a multiarray mathematical algorithm. The data are publicly available at ArrayExpress public repository for microarray data under the accession number E-MEXP-3291 (http://www.webcitation.org/5zyojNu7T).
Gene Expression Analysis of Gene Categories
A total of 166 genes implicated in protein processing in the ER, 23 genes implicated in protein export from cytoplasm to ER, 49 genes implicated in N-glycan biosynthesis, and 17 genes in N-glycan degradation were selected using literature database searches and examination of the Kyoto Encyclopedia of Genes and Genomes (KEGG) Database (http://www.kegg.jp/). The complete list of genes is available in supplemental Table S1. For the heatmap, genes and samples were sorted using unsupervised hierarchical clustering and clustering was performed using all genes included in the heatmap using R programing environment. Correlation was used as distance metrics and Ward’s minimum variance was used as agglomeration method. These gene sets were tested for gene expression differences among the diagnosis groups using the Linear Models for Microarray Data (LIMMA) software package in Bioconductor.19 Gene set enrichment among differentially expressed genes was tested and those that were found to have a proportion of genes that showed greater representation in up- or downregulation compared with the proportion of a randomly tested set of genes the same size were considered over-represented.20
Western Blot
Membrane proteins (40 μg/well) or whole cell lysates (55 μg/well) were separated by SDS-PAGE and transferred to polyvinylidene difluoride membranes. Organic anion transporting polypeptide-1B1 (OATP1B1) (Progen mESL clone), OATP1B3 (gift from Dr. Bruno Hagenbuch KUMC), OATP2B1 (Santa Cruz Biotechnology sc-135099), and Sodium/Taurocholate Co-transporting Polypeptide (NTCP) (Santa Cruz Biotechnology sc-98484) antibodies were used to probe membrane proteins and MRP2 (Kamiya Biomedical Company M2III-5 clone) antibody was used to probe whole cell lysates. Densitometry was performed using Image Lab software (Bio-Rad Laboratories). Proteins were normalized to pan-cadherin levels (Abcam ab16505).
PNGase treatment
N-glycan removal from proteins was performed using a commercially available kit following the manufacturer’s protocol (New England Biolabs, Ipswich, MA). Briefly, 40 μg of protein was mixed with the glycoprotein denaturing buffer followed by a 30-minute incubation at 37 °C. Then G7 reaction buffer, NP–40, and PNGase enzyme were added to the reaction mixture and incubated for another 30 minutes at 37 °C. The reaction mixture was then mixed with laemmli buffer and loaded onto an SPS-PAGE gel and a western blot was performed for the appropriate protein as described above. For negative control reactions the PNGase enzyme was replaced with water.
Statistical Analysis
Microarray and western blot data were analyzed by one-way ANOVA with post hoc Tukey testing. Initially, the analyses were performed including NASH with fat and NASH without fat as separate categories but since no differences were observed between these two groups they were combined for all analyses.
Results
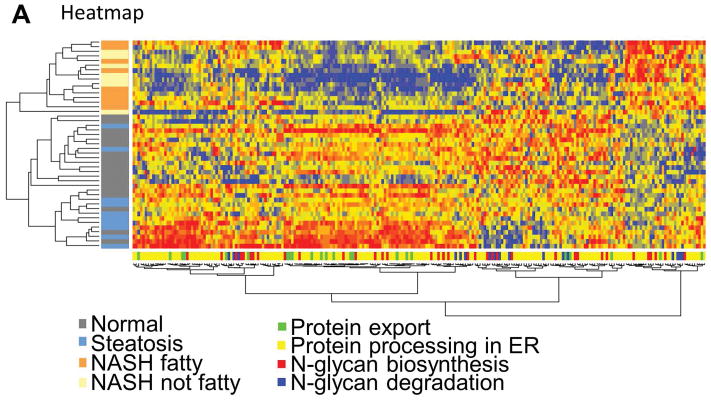
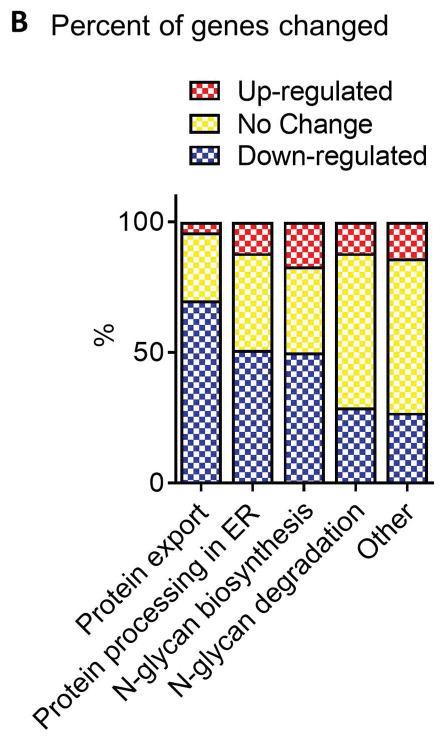
To test whether human hepatic genes involved in protein export, protein processing in the ER, N-glycan biosynthesis, and N-glycan degradation are altered in NASH we performed hierarchical clustering analysis and gene set enrichment analysis. As shown in the heatmap in Figure 1A there was a clear clustering of NASH livers from healthy and steatosis livers, although there was no clustering based on gene category. There were more genes downregulated in the protein export, protein processing in the ER, and N-glycan biosynthesis categories compared to other genes in the dataset (Figure 1B) which was confirmed by gene set enrichment analysis (Table 1). There was no significant change in the N-glycan degradation gene category as determined by gene set enrichment analysis (Table 1).
Fig. 1. Changes in gene expression.
(A) NASH samples cluster together according to gene expression. The expression heatmap (red=upregulated, blue=downregulated, yellow=no change) shows diagnosis and gene category on the y- and x-axes, respectively. (B) Genes involved in protein export, processing in the ER, and N-glycan biosynthesis are more often downregulated in NASH livers compared to normal livers. The “other” gene set contains all other genes from the array not included in the three gene categories analyzed. Normal (n = 19), steatotic (n = 10), NASH with fatty liver (n = 9), and NASH without fatty liver (n = 7).
Table 1.
Gene set enrichment analysis for protein export, protein processing in ER, and N-glycan biosynthesis gene categories in NASH liver samples.
| Name | Upregulation p-value | Downregulation p-value | n1 |
|---|---|---|---|
| Protein export | 1.00 | 3.05e-04 | 22 |
| Protein processing in the ER | 1.00 | 3.67e-08 | 166 |
| N-glycan biosynthesis | 0.997 | 3.40e-03 | 49 |
| N-glycan degradation | 0.783 | 0.217 | 17 |
Number of genes in set
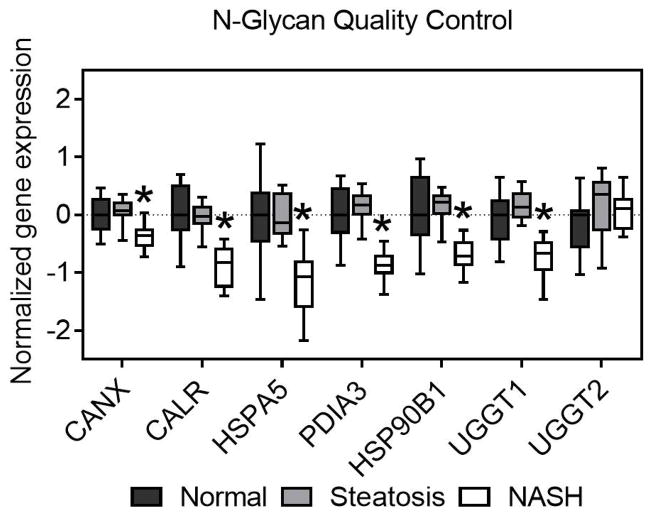
A closer examination of the genes involved in N-glycan biosynthesis reveals widespread downregulation in specific steps in the pathway. N-glycan biosynthesis can be broken down into several key steps: N-glycan precursor formation, N-glycan quality control, N-glycan trimming to the core, and N-glycan extension from the core. Each step is essential for proper formation of N-glycosylated proteins. The genes involved in N-glycan quality control are chaperones and enzymes that ensure proper formation of glycan structures and protein folding and all but one of these genes are downregulated in NASH livers (Figure 2).
Fig. 2. N-glycan quality control.
Multiple glycoprotein chaperones and quality control genes are downregulated in NASH. Data were normalized to the median from the normal group for each gene. Data represent mean +/− SEM. Statistical significance *p≤0.05 compared to normal. Normal (n = 19), steatotic (n = 10), NASH with fatty liver (n = 9), and NASH without fatty liver (n = 7).
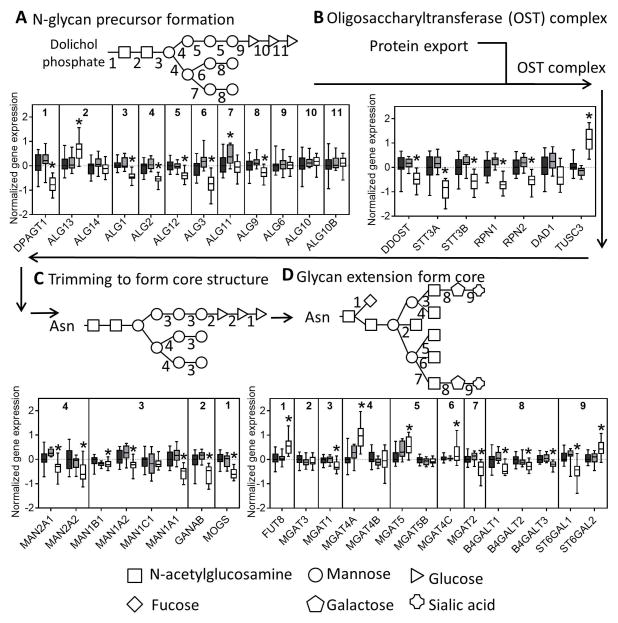
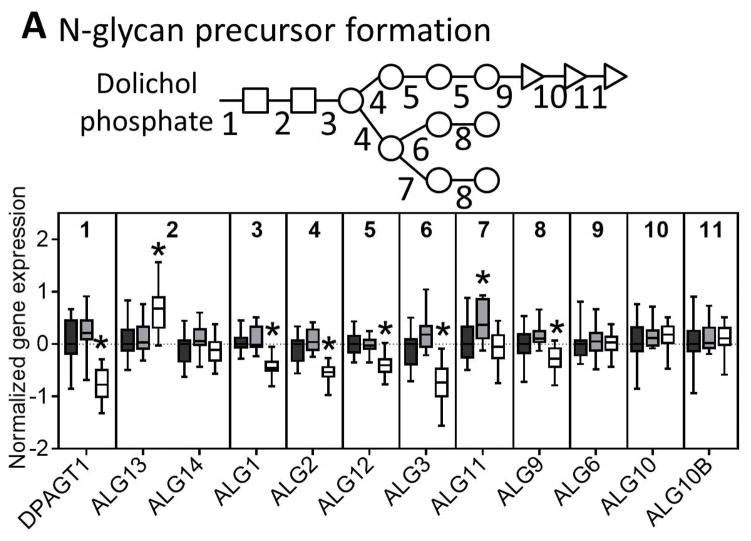
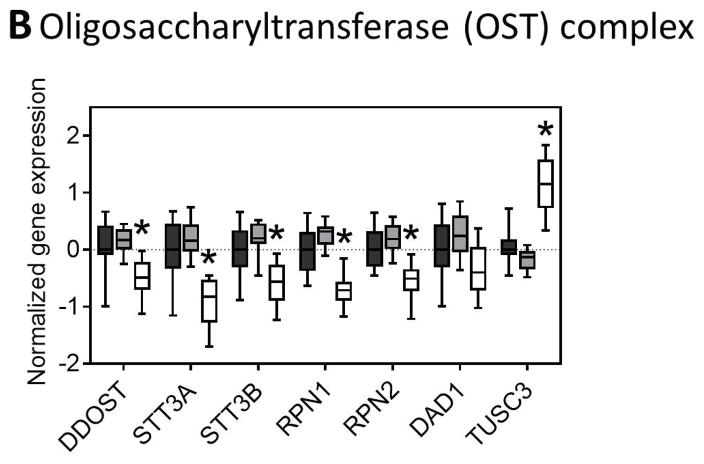
The initial formation of N-glycan structures involves addition of N-acetylglucosamine, mannose, and glucose sequentially, first outside the ER lumen before the growing glycan structure is flipped to the internal surface of the ER. We observed significant downregulation of all mannosyltransferases but no change in the glucosyltransferases in NASH livers (Figure 3A). The oligosaccharyltransferase (OST) complex is involved in transferring the nascent N-glycan to the nascent peptide that is made in the ER lumen and we observed many of the subunit genes were downregulated in NASH (Figure 3B).
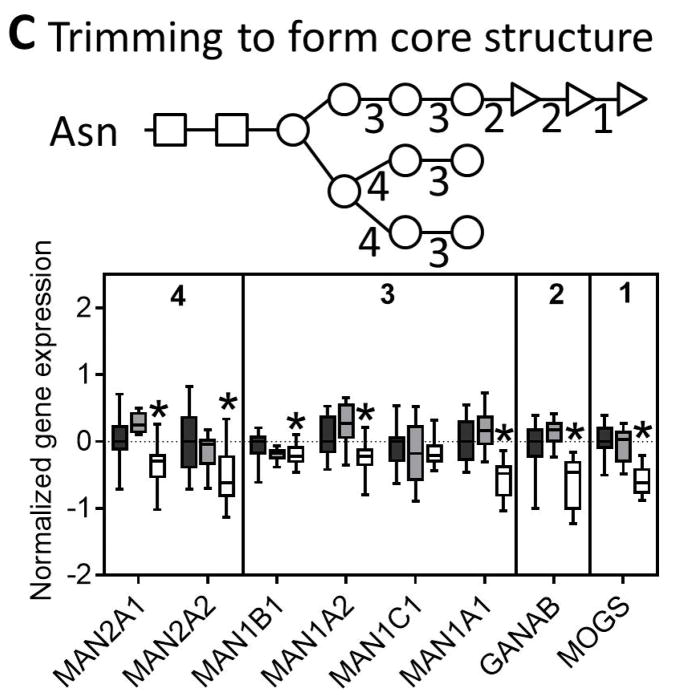
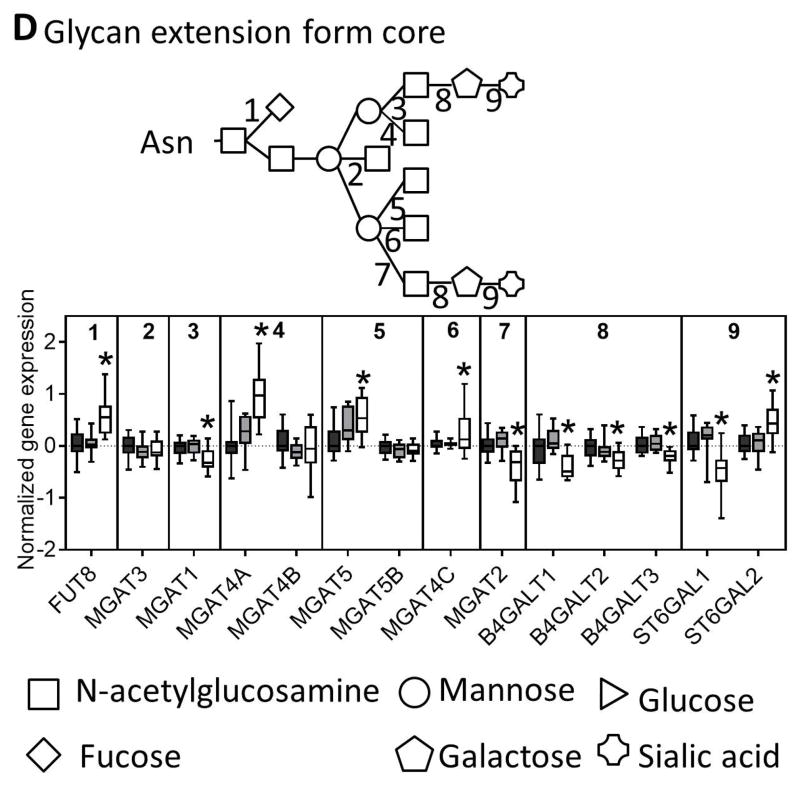
Fig. 3. N-glycan processing through the ER and the Golgi.
Genes involved in the (A) synthesis of glycan molecules, (B) transfer of glycans to asparagine residues, (C) trimming of the N-glycan in the ER and cis-golgi, and (D) extension of the glycan through the medial and trans-golgi are downregulated in NASH. The numbers along the top of each bar graph correspond to the numbers in the associated glycan structure. Data were normalized to the median from the normal group for each gene. Data represent mean +/− SEM. Statistical significance *p≤0.05 compared to normal. Normal (n = 19), steatotic (n = 10), NASH with fatty liver (n = 9), and NASH without fatty liver (n = 7).
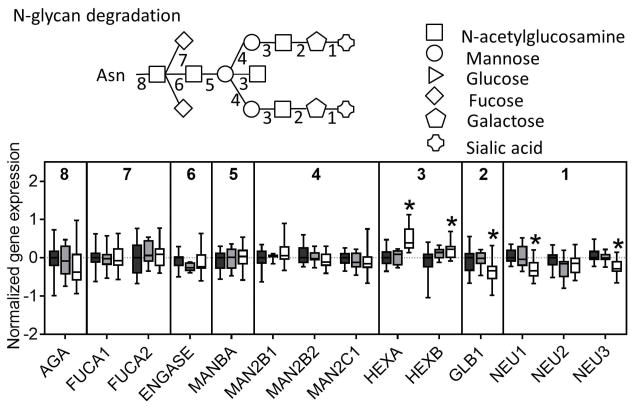
The next step in N-linked glycosylation of proteins involves trimming of the N-glycan structure to its core structure through a series of glucosidases and mannosidases. Similar to the other N-glycosylation genes nearly all of the trimming genes were downregulated in NASH livers (Figure 3C). The final step in N-glycosylation is extension from the core structure that involves addition of a more diverse set of monosaccharides. In this set of genes, we found mixed results with some genes being upregulated (FUT8, MGAT4A, MGAT5, MGAT4C, ST6GAL2) while others were downregulated (MGAT1, MGAT2, B4GALT1, B4GALT2, B4GALT3, ST6GAL1) (Figure 3D). Interestingly, although there was no significant enrichment for gene expression in N-glycan degradation in NASH, we observed downregulation of two of the three sialidase genes, downregulation of the galactosidase, and upregulation of the two hexosamidase subunits in NASH (Figure 4).
Fig. 4. N-glycan degradation.
A majority of genes involved in N-glycan degradation which occurs after a glycan has been cleaved from a protein that is destined for proteasomal degradation are not changed in NASH, although two genes are upregulated and three genes are downregulated. Data were normalized to the median from the normal group for each gene. Data represent mean +/− SEM. Statistical significance *p≤0.05 compared to normal.
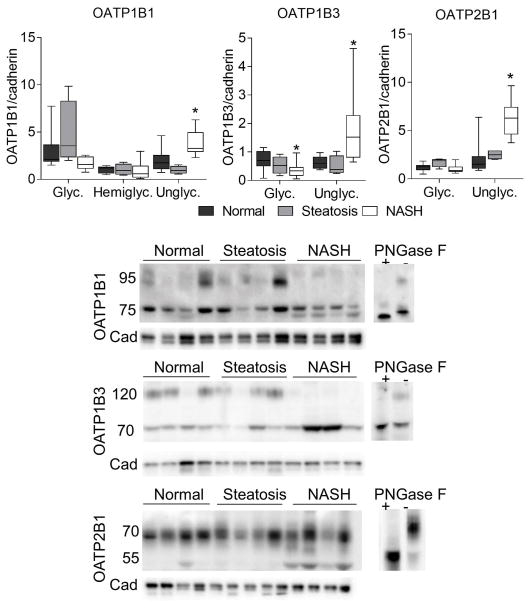
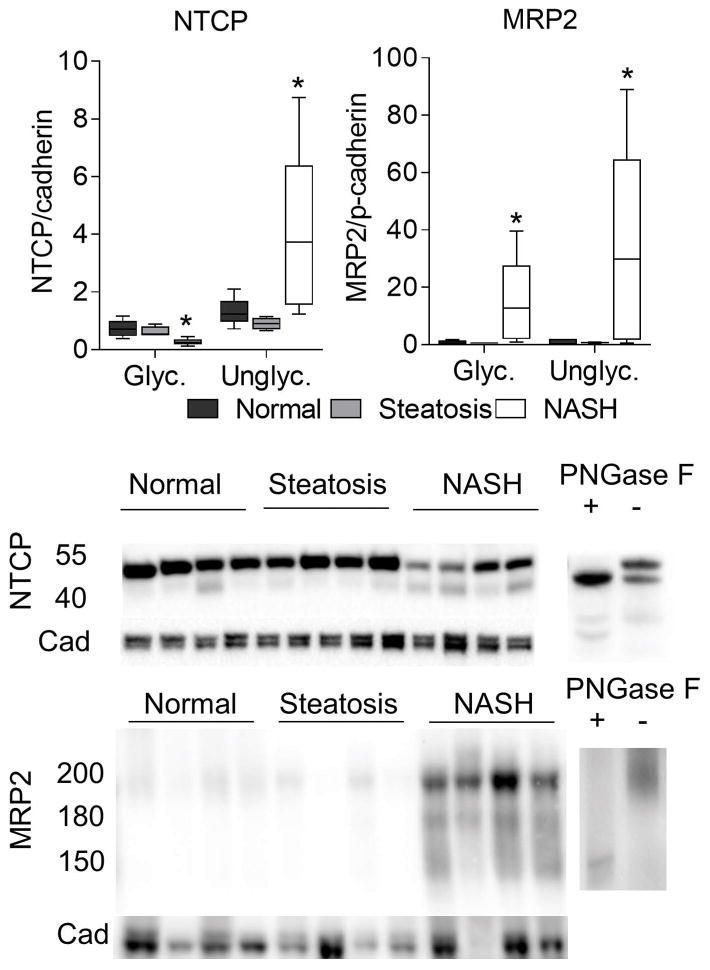
Membrane bound drug transporters are an important class of proteins that are dependent on proper N-linked glycosylation for localization and function. In order to test whether these proteins are affected by the changes in glycosylation genes we observed in NASH, we performed western blot analyses to determine the amount of glycosylated and unglycosylated forms of each protein. We observed a clear increase in the unglycosylated form of OATP1B1, OATP1B3, OATP2B1, NTCP, and MRP2 (Figures 5 and 6). The molecular weights for each protein was confirmed using PNGase treated lysates and based on previous reports from the literature 12,21–23. For OATP2B1 there was an approximate 5 kDa upward shift in migration of both glycosylated and unglycosylated bands when the deglycosylation reaction was performed. For OATP1B1 and MRP2 fully glycosylated, hemi-glycosylated, and unglycosylated forms were observed, which is consistent with previous reports.23,24
Fig. 5. Changes in OATP transporter glycosylation.
Sinusoidal OATP uptake transporters OATP1B1, OATP1B3, and OATP2B1 exhibited a significant increase in the amount of unglycosylated protein by western blot analysis. Data were normalized to the median from the normal group for each gene. Data represent mean +/− SEM. Statistical significance *p≤0.05 compared to normal. Normal (n = 10), steatotic (n = 4), NASH (n = 9).
Fig. 6. Changes in NTCP and MRP2 transporter glycosylation.
Sinusoidal NTCP uptake transporter and biliary MRP2 efflux transporter exhibited a significant increase in the amount of unglycosylated protein by western blot analysis. Data were normalized to the median from the normal group for each gene. Data represent mean +/− SEM. Statistical significance *p≤0.05 compared to normal. Normal (n = 10), steatotic (n = 4), NASH (n = 9).
Discussion
The present study was undertaken to investigate the potential of perturbed N-linked protein glycosylation in NASH. By analyzing gene expression pathways and transporter glycosylation in liver samples representing normal, steatosis, and NASH we were able to show that many genes involved in protein processing, N-linked glycosylation and ultimately transporter glycosylation are altered in NASH. We performed a gene set enrichment analysis of microarray data and found that protein processing in the ER and N-glycan biosynthesis genes are enriched for downregulation in NASH. Indeed, many genes involved in N-glycan biosynthesis responsible for N-glycan precursor biosynthesis and N-glycan trimming to the core are down-regulated in NASH. These data are particularly striking given the increased prevalence of NAFLD and the clinical concerns for this population, such as increased risk of altered drug metabolism, disposition, and toxicity.15,16,18,25–34 These changes in metabolism and disposition have been attributed to altered gene expression and localization of membrane bound transporters15,18 and here we show for the first time that N-linked glycosylation may provide another molecular mechanism that could impact transporter function in human NASH.
There are several lines of evidence in the literature indicating a potential change in protein glycosylation in NAFLD and NASH. For example, an increase in the amount of the hemi-glycosylated form of MRP2 (~180 kDa) in NASH has been reported.15 The data reported herein also show that the fully unglycosylated form of MRP2 (~150 kDa) is also present in NASH livers. There is also a growing body of evidence to suggest that protein glycosylation signatures in NAFLD can function as a non-invasive plasma biomarker of disease status.3 It has been reported that fully agalactosylated α-1,6 fucosylated bisecting biantennary IgG reportedly can distinguish steatosis from NASH6 and also coincides with increased fibrosis stage.7 Also, in type 2 diabetes the amount of α-1,6 fucosylated proteins was increased due to increased expression of α-1,6-fucosyltransferase (FUT8).8 Consistent with these data, here we observed increased FUT8 mRNA expression in NASH livers compared to controls. In addition, we observed a downregulation of all galactosyltrasferases (B4GALT1, B4GALT2, B4GALT3), MGAT1, and MGAT2 in NASH livers, which would correspond to fully agalactosylated proteins as observed in NASH.6,7 These data, in conjunction with the current data showing downregulation of many key pathways in N-glycosylation such as precursor formation, OST complex, N-glycan quality control, trimming to the core and extension from the core, provide evidence that N-linked glycosylation is perturbed in the livers of NASH patients.
These data also show that the NASH-associated changes in hepatic protein glycosylation gene pathways results in increased levels of unglycosylated uptake (OATP1B1, OATP1B3, OATP2B1, NTCP) and efflux (MRP2) drug transporters. It is well documented that glycosylation directly impacts both transporter localization to the membrane and function.35–41 It has been reported that reduced glycosylation of transporters such as Oatp1a1, OATP1B1, OATP2B1, Mrp2, breast cancer resistance protein (Bcrp), bile salt export pump (BSEP), and P-glycoprotein (P-gp) causes diminished membrane localization and transporter function.11–14,42,43 It has also been shown that single nucleotide polymorphisms (SNPs) in transporters can influence glycosylation and localization. For example, specific SNPs in SLCO1B1, the gene for OATP1B1, cause decreased membrane expression and lower substrate transport.44,45 Another report showed that SNPs in SLCO1B3, the gene for OATP1B3, affect its localization and transport function.46 A non-synonymous single nucleotide polymorphism in OATP1A2 resulted in decreased protein molecular weight, indicative of decreased glycosylation, decreased membrane expression, and transport activity for several substrates.47 Additionally, there is a substantial amount of data to show that proper cellular localization is critical for proper function of transporters such as OATP1B1, NTCP, MRP2, BCRP, and P-gp.13,14,22,23,44,45,48–50 Collectively, these data suggest that the unglycosylated transporters we observed in NASH may not be functional or contribute to the clearance of drugs. Importantly, the current data raise concerns for proteomics approaches for transporter quantification because the amount of fully glycosylated transporters likely represents the functional pool of transporters, but a proteomic approach would include the unglycosylated, and therefore non-functional, form of the protein leading to over-quantification of functional protein. Furthermore, this alteration in glycosylation may represent the molecular mechanism for altered disposition of several drugs in NASH, potentially contributing to the occurrence of adverse drug reactions.
In conclusion, these data support the previous plasma N-linked glycosylation biomarker data in NASH and provide deeper insight into specific changes in N-linked glycosylation pathways in NASH. Further investigation into the specific N-glycan signatures on these transporter proteins in NASH will help to understand how these perturbations in glycosylation influence transporter function in NASH. Collectively, these data support further investigation into the potential roles of NASH-associated perturbations of N-linked glycosylation including transporter function and pharmacokinetic alterations, protein trafficking and function, and disease progression.
Supplementary Material
Key Points.
Transcriptomic analysis of human liver samples indicates that genes involved in protein processing in the ER and biosynthesis of N-glycans were significantly enriched for downregulation in NAFLD progression.
Many genes involved in N-glycan quality control, the oligosaccharyltransferase complex, N-glycan quality control, N-glycan precursor biosynthesis, N-glycan trimming to the core and N-glycan extension from the core were downregulated in NASH livers.
N-linked glycosylation of hepatic uptake and efflux transporters was decreased in human NASH livers.
These data suggest that N-linked glycosylation is impaired in human NASH livers and have implications for the function of glycosylated proteins such as membrane transporters.
Acknowledgments
Financial Support: National Institutes of Health Grants [DK068039] and [ES006694]; National Institute of Environmental Health Science Toxicology Training Grant [ES007091]; Liver Tissue Cell Distribution System National Institute of Health Contract [N01-DK-7-0004/HHSN267200700004C].
We would like to thank the Bioinformatics and Statistical Consortium at the University of Arizona. We would also like to thank the National Institutes of Health-funded Liver Tissue Cell Distribution System liver tissue samples and those people specifically involved, Marion Namenwirth (University of Minnesota), Melissa Thompson (Virginia Commonwealth University), and Dr. Stephen C. Strom and Kenneth Dorko (University of Pittsburgh).
Abbreviations
- ER
Endoplasmic reticulum
- NAFLD
nonalcoholic fatty liver disease
- NASH
nonalcoholic steatohepatitis
- FUT8
α-1,6-fucosyltransferase
- MRP2
multidrug resistance-associated protein 2
- KEGG
Kyoto Encyclopedia of Genes and Genomes
- LIMMA
Linear Models for Microarray Data
- OATP
organic anion transporting polypeptide
- NTCP
sodium/taurocholate co-transporting polypeptide
- OST
oligosaccharyltransferase
- BCRP
breast cancer resistance protein
- BSEP
bile salt export pump
- P-gp
P-glycoprotein
- SNPs
single nucleotide polymorphisms
Footnotes
Conflict of Interest: None.
References
- 1.Varki A, Cummings RD, Esko JD, et al. Essentials of Glycobiology. Cold Spring Harbor Laboratory Press; 2009. [PubMed] [Google Scholar]
- 2.Vagin O, Kraut JA, Sachs G. Role of N-glycosylation in trafficking of apical membrane proteins in epithelia. Am J Physiol Renal Physiol. 2009;296:F459–69. doi: 10.1152/ajprenal.90340.2008. [DOI] [PMC free article] [PubMed] [Google Scholar]
- 3.Blomme B, Van Steenkiste C, Callewaert N, Van Vlierberghe H. Alteration of protein glycosylation in liver diseases. J Hepatol. 2009;50:592–603. doi: 10.1016/j.jhep.2008.12.010. [DOI] [PubMed] [Google Scholar]
- 4.Zhan Y-T, Su H-Y, An W. Glycosyltransferases and non-alcoholic fatty liver disease. World J Gastroenterol. 2016;22:2483–93. doi: 10.3748/wjg.v22.i8.2483. [DOI] [PMC free article] [PubMed] [Google Scholar]
- 5.Ali R, Cusi K. New diagnostic and treatment approaches in non-alcoholic fatty liver disease (NAFLD) Ann Med. 2009;41:265–78. doi: 10.1080/07853890802552437. [DOI] [PubMed] [Google Scholar]
- 6.Blomme B, Francque S, Trépo E, et al. N-glycan based biomarker distinguishing non-alcoholic steatohepatitis from steatosis independently of fibrosis. Dig Liver Dis. 2012;44:315–22. doi: 10.1016/j.dld.2011.10.015. [DOI] [PubMed] [Google Scholar]
- 7.Chen C, Schmilovitz-Weiss H, Liu X, et al. Serum protein N-glycans profiling for the discovery of potential biomarkers for nonalcoholic steatohepatitis. J Proteome Res. 2009;8:463–70. doi: 10.1021/pr800656e. [DOI] [PubMed] [Google Scholar]
- 8.Itoh N, Sakaue S, Nakagawa H, et al. Analysis of N-glycan in serum glycoproteins from db/db mice and humans with type 2 diabetes. Am J Physiol Endocrinol Metab. 2007;293:E1069–77. doi: 10.1152/ajpendo.00182.2007. [DOI] [PubMed] [Google Scholar]
- 9.Helenius A, Aebi M. Roles of N-linked glycans in the endoplasmic reticulum. Annu Rev Biochem. 2004;73:1019–49. doi: 10.1146/annurev.biochem.73.011303.073752. [DOI] [PubMed] [Google Scholar]
- 10.Xu C, Ng DTW. Glycosylation-directed quality control of protein folding. Nat Rev Mol Cell Biol. 2015;16:742–52. doi: 10.1038/nrm4073. [DOI] [PubMed] [Google Scholar]
- 11.Lee TK, Koh AS, Cui Z, Pierce RH, Ballatori N. N-glycosylation controls functional activity of Oatp1, an organic anion transporter. Am J Physiol Gastrointest Liver Physiol. 2003;285:G371–81. doi: 10.1152/ajpgi.00358.2002. [DOI] [PubMed] [Google Scholar]
- 12.Hänggi E, Grundschober AF, Leuthold S, Meier PJ, St-Pierre MV. Functional analysis of the extracellular cysteine residues in the human organic anion transporting polypeptide, OATP2B1. Mol Pharmacol. 2006;70:806–17. doi: 10.1124/mol.105.019547. [DOI] [PubMed] [Google Scholar]
- 13.Zhang P, Tian X, Chandra P, Brouwer KLR. Role of glycosylation in trafficking of Mrp2 in sandwich-cultured rat hepatocytes. Mol Pharmacol. 2005;67:1334–41. doi: 10.1124/mol.104.004481. [DOI] [PubMed] [Google Scholar]
- 14.Draheim V, Reichel A, Weitschies W, Moenning U. N-glycosylation of ABC transporters is associated with functional activity in sandwich-cultured rat hepatocytes. Eur J Pharm Sci. 2010;41:201–9. doi: 10.1016/j.ejps.2010.06.005. [DOI] [PubMed] [Google Scholar]
- 15.Hardwick RN, Fisher CD, Canet MJ, Scheffer GL, Cherrington NJ. Variations in ATP-binding cassette transporter regulation during the progression of human nonalcoholic fatty liver disease. Drug Metab Dispos. 2011;39:2395–402. doi: 10.1124/dmd.111.041012. [DOI] [PMC free article] [PubMed] [Google Scholar]
- 16.Fisher CD, Lickteig AJ, Augustine LM, et al. Hepatic cytochrome P450 enzyme alterations in humans with progressive stages of nonalcoholic fatty liver disease. Drug Metab Dispos. 2009;37:2087–94. doi: 10.1124/dmd.109.027466. [DOI] [PMC free article] [PubMed] [Google Scholar]
- 17.Kleiner DE, Brunt EM, Van Natta M, et al. Design and validation of a histological scoring system for nonalcoholic fatty liver disease. Hepatology. 2005;41:1313–21. doi: 10.1002/hep.20701. [DOI] [PubMed] [Google Scholar]
- 18.Lake AD, Novak P, Fisher CD, et al. Analysis of global and absorption, distribution, metabolism, and elimination gene expression in the progressive stages of human nonalcoholic fatty liver disease. Drug Metab Dispos. 2011;39:1954–60. doi: 10.1124/dmd.111.040592. [DOI] [PMC free article] [PubMed] [Google Scholar]
- 19.Smyth GK. limma: Linear Models for Microarray Data. In: Gentleman R, Carey V, Huber W, Irizarry R, Duboit S, editors. Bioinformatics and Computational Biology Solutions Using R and Bioconductor. New York: Springer-Verlag; 2011. pp. 397–420. [Google Scholar]
- 20.Luo W, Friedman MS, Shedden K, Hankenson KD, Woolf PJ. GAGE: generally applicable gene set enrichment for pathway analysis. BMC Bioinformatics. 2009;10:161. doi: 10.1186/1471-2105-10-161. [DOI] [PMC free article] [PubMed] [Google Scholar]
- 21.Cui Y, König J, Nies AT, et al. Detection of the human organic anion transporters SLC21A6 (OATP2) and SLC21A8 (OATP8) in liver and hepatocellular carcinoma. Lab Invest. 2003;83:527–38. doi: 10.1097/01.lab.0000065015.02412.48. [DOI] [PubMed] [Google Scholar]
- 22.Shneider BL, Fox VL, Schwarz KB, et al. Hepatic basolateral sodium-dependent-bile acid transporter expression in two unusual cases of hypercholanemia and in extrahepatic biliary atresia. Hepatology. 1997;25:1176–83. doi: 10.1002/hep.510250521. [DOI] [PubMed] [Google Scholar]
- 23.Fernández SBM, Holló Z, Kern A, et al. Role of the N-terminal transmembrane region of the multidrug resistance protein MRP2 in routing to the apical membrane in MDCKII cells. J Biol Chem. 2002;277:31048–55. doi: 10.1074/jbc.M204267200. [DOI] [PubMed] [Google Scholar]
- 24.Chapy H, Klieber S, Brun P, Gerbal-Chaloin S, Boulenc X, Nicolas O. PBPK modeling of irbesartan: incorporation of hepatic uptake. Biopharm Drug Dispos. 2015;36:491–506. doi: 10.1002/bdd.1961. [DOI] [PubMed] [Google Scholar]
- 25.Clarke JD, Hardwick RN, Lake AD, Canet MJ, Cherrington NJ. Experimental nonalcoholic steatohepatitis increases exposure to simvastatin hydroxy acid by decreasing hepatic organic anion transporting polypeptide expression. J Pharmacol Exp Ther. 2014;348:452–8. doi: 10.1124/jpet.113.211284. [DOI] [PMC free article] [PubMed] [Google Scholar]
- 26.Hardwick RN, Fisher CD, Street SM, Canet MJ, Cherrington NJ. Molecular mechanism of altered ezetimibe disposition in nonalcoholic steatohepatitis. Drug Metab Dispos. 2012;40:450–60. doi: 10.1124/dmd.111.041095. [DOI] [PMC free article] [PubMed] [Google Scholar]
- 27.Fisher CD, Lickteig AJ, Augustine LM, et al. Experimental non-alcoholic fatty liver disease results in decreased hepatic uptake transporter expression and function in rats. Eur J Pharmacol. 2009;613:119–27. doi: 10.1016/j.ejphar.2009.04.002. [DOI] [PMC free article] [PubMed] [Google Scholar]
- 28.Hardwick RN, Clarke JD, Lake AD, et al. Increased susceptibility to methotrexate-induced toxicity in nonalcoholic steatohepatitis. Toxicol Sci. 2014;142:45–55. doi: 10.1093/toxsci/kfu156. [DOI] [PMC free article] [PubMed] [Google Scholar]
- 29.Dzierlenga AL, Clarke JD, Hargraves TL, et al. Mechanistic basis of altered morphine disposition in nonalcoholic steatohepatitis. J Pharmacol Exp Ther. 2015;352:462–70. doi: 10.1124/jpet.114.220764. [DOI] [PMC free article] [PubMed] [Google Scholar]
- 30.Hardwick RN, Fisher CD, Canet MJ, Lake AD, Cherrington NJ. Diversity in antioxidant response enzymes in progressive stages of human nonalcoholic fatty liver disease. Drug Metab Dispos. 2010;38:2293–301. doi: 10.1124/dmd.110.035006. [DOI] [PMC free article] [PubMed] [Google Scholar]
- 31.Canet MJ, Merrell MD, Hardwick RN, et al. Altered regulation of hepatic efflux transporters disrupts acetaminophen disposition in pediatric nonalcoholic steatohepatitis. Drug Metab Dispos. 2015;43:829–35. doi: 10.1124/dmd.114.062703. [DOI] [PMC free article] [PubMed] [Google Scholar]
- 32.Hardwick RN, Ferreira DW, More VR, et al. Altered UDP-glucuronosyltransferase and sulfotransferase expression and function during progressive stages of human nonalcoholic fatty liver disease. Drug Metab Dispos. 2013;41:554–61. doi: 10.1124/dmd.112.048439. [DOI] [PMC free article] [PubMed] [Google Scholar]
- 33.Clarke JD, Dzierlenga AL, Nelson NR, et al. Mechanism of Altered Metformin Distribution in Nonalcoholic Steatohepatitis. Diabetes. 2015;64:3305–13. doi: 10.2337/db14-1947. [DOI] [PMC free article] [PubMed] [Google Scholar]
- 34.Clarke JD, Hardwick RN, Lake AD, et al. Synergistic interaction between genetics and disease on pravastatin disposition. J Hepatol. 2014;61:139–47. doi: 10.1016/j.jhep.2014.02.021. [DOI] [PMC free article] [PubMed] [Google Scholar]
- 35.Asano T, Katagiri H, Takata K, et al. The role of N-glycosylation of GLUT1 for glucose transport activity. J Biol Chem. 1991;266:24632–6. [PubMed] [Google Scholar]
- 36.Dong M, Ladavière L, Penin F, Deléage G, Baggetto LG. Secondary structure of P-glycoprotein investigated by circular dichroism and amino acid sequence analysis. Biochim Biophys Acta - Biomembr. 1998;1371:317–334. doi: 10.1016/s0005-2736(98)00032-7. [DOI] [PubMed] [Google Scholar]
- 37.Potter BA, Hughey RP, Weisz OA. Role of N- and O-glycans in polarized biosynthetic sorting. Am J Physiol Cell Physiol. 2006;290:C1–C10. doi: 10.1152/ajpcell.00333.2005. [DOI] [PubMed] [Google Scholar]
- 38.Rodriguez-Boulan E, Gonzalez A. Glycans in post-Golgi apical targeting: sorting signals or structural props? Trends Cell Biol. 1999;9:291–294. doi: 10.1016/s0962-8924(99)01595-0. [DOI] [PubMed] [Google Scholar]
- 39.Schinkel AH, Kemp S, Dollé M, Rudenko G, Wagenaar E. N-glycosylation and deletion mutants of the human MDR1 P-glycoprotein. J Biol Chem. 1993;268:7474–81. [PubMed] [Google Scholar]
- 40.Urquhart P, Pang S, Hooper NM. N-glycans as apical targeting signals in polarized epithelial cells. Biochem Soc Symp. 2005:39–45. doi: 10.1042/bss0720039. [DOI] [PubMed] [Google Scholar]
- 41.Weisz OA, Rodriguez-Boulan E. Apical trafficking in epithelial cells: signals, clusters and motors. J Cell Sci. 2009;122:4253–66. doi: 10.1242/jcs.032615. [DOI] [PMC free article] [PubMed] [Google Scholar]
- 42.Yao J, Hong W, Huang J, Zhan K, Huang H, Hong M. N-Glycosylation dictates proper processing of organic anion transporting polypeptide 1B1. PLoS One. 2012;7:e52563. doi: 10.1371/journal.pone.0052563. [DOI] [PMC free article] [PubMed] [Google Scholar]
- 43.Mochizuki K, Kagawa T, Numari A, et al. Two N-linked glycans are required to maintain the transport activity of the bile salt export pump (ABCB11) in MDCK II cells. Am J Physiol Gastrointest Liver Physiol. 2007;292:G818–28. doi: 10.1152/ajpgi.00415.2006. [DOI] [PubMed] [Google Scholar]
- 44.Kameyama Y, Yamashita K, Kobayashi K, Hosokawa M, Chiba K. Functional characterization of SLCO1B1 (OATP-C) variants, SLCO1B1*5, SLCO1B1*15 and SLCO1B1*15+C1007G, by using transient expression systems of HeLa and HEK293 cells. Pharmacogenet Genomics. 2005;15:513–22. doi: 10.1097/01.fpc.0000170913.73780.5f. [DOI] [PubMed] [Google Scholar]
- 45.Tirona RG, Leake BF, Merino G, Kim RB. Polymorphisms in OATP-C: identification of multiple allelic variants associated with altered transport activity among European- and African-Americans. J Biol Chem. 2001;276:35669–75. doi: 10.1074/jbc.M103792200. [DOI] [PubMed] [Google Scholar]
- 46.Schwarz UI, Meyer zu Schwabedissen HE, Tirona RG, et al. Identification of novel functional organic anion-transporting polypeptide 1B3 polymorphisms and assessment of substrate specificity. Pharmacogenet Genomics. 2011;21:103–14. doi: 10.1097/FPC.0b013e328342f5b1. [DOI] [PMC free article] [PubMed] [Google Scholar]
- 47.Lee W, Glaeser H, Smith LH, et al. Polymorphisms in human organic anion-transporting polypeptide 1A2 (OATP1A2): implications for altered drug disposition and central nervous system drug entry. J Biol Chem. 2005;280:9610–7. doi: 10.1074/jbc.M411092200. [DOI] [PubMed] [Google Scholar]
- 48.Hallén S, Mareninova O, Brändén M, Sachs G. Organization of the membrane domain of the human liver sodium/bile acid cotransporter. Biochemistry. 2002;41:7253–66. doi: 10.1021/bi012152s. [DOI] [PubMed] [Google Scholar]
- 49.Sugiyama T, Shuto T, Suzuki S, et al. Posttranslational negative regulation of glycosylated and non-glycosylated BCRP expression by Derlin-1. Biochem Biophys Res Commun. 2011;404:853–8. doi: 10.1016/j.bbrc.2010.12.074. [DOI] [PMC free article] [PubMed] [Google Scholar]
- 50.Haider AJ, Cox MH, Jones N, et al. Identification of residues in ABCG2 affecting protein trafficking and drug transport, using co-evolutionary analysis of ABCG sequences. Biosci Rep. 2015;35:e00241. doi: 10.1042/BSR20150150. [DOI] [PMC free article] [PubMed] [Google Scholar]
Associated Data
This section collects any data citations, data availability statements, or supplementary materials included in this article.


