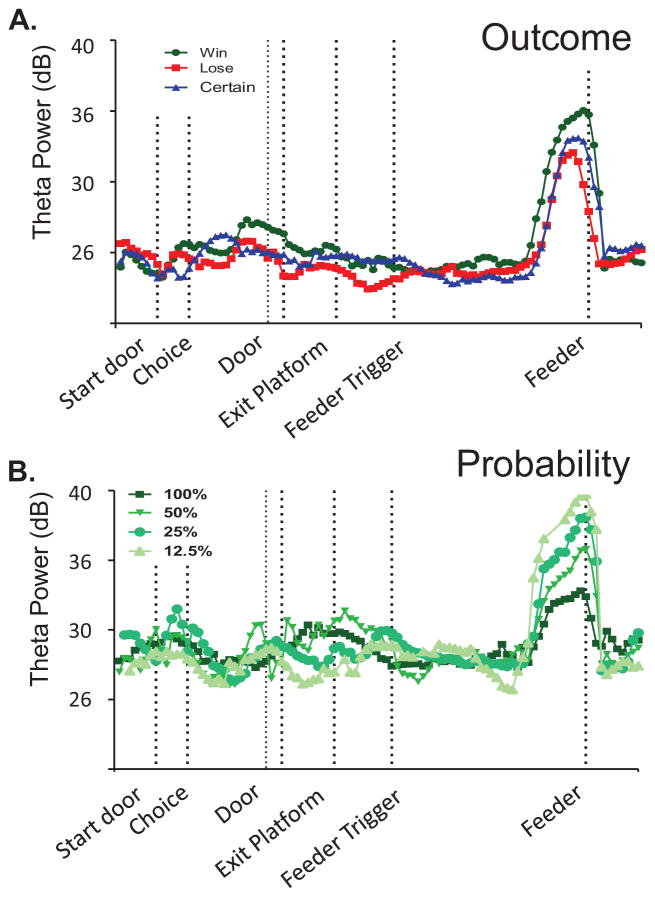
Figure 6. Theta power modulation according to the expected reward outcome and probability is observed on single tetrode traces.
A. Theta power was dramatically elevated just prior to reward encounters at the feeder, with the increase greatest during win trials, followed by certain trials. Lose trials showed the smallest increase. B. Single tetrode example of the inverse scaling of the increase in theta power as a function of the expected probability of reward during win trials. These data were collected during a single recording session. The fact that the scaled response can be seen in a single recording site illustrates that the group summary shown in Figure 5 is not to the averaging across a large number of sessions.

