

Abstract
Interactions with serum proteins such as alpha1-acid glycoprotein (AGP) can have a significant effect on the behavior and pharmacokinetics of drugs. Ultrafast affinity extraction and peak profiling were used with AGP microcolumns to examine these processes for several model drugs (i.e., chlorpromazine, disopyramide, imipramine, lidocaine, propranolol and verapamil). The association equilibrium constants measured for these drugs with soluble AGP by ultrafast affinity extraction were in the general range of 104–106 M−1 at pH 7.4 and 37°C and gave good agreement with literature values. Some of these values were dependent on the relative drug and protein concentrations that were present when using a single-site binding model; these results suggested a more complex mixed-mode interaction was actually present, which was also then used to analyze the data. The apparent dissociation rate constants that were obtained by ultrafast affinity extraction when using a single-site model varied from 0.24 to 7.0 s−1 and were dependent on the relative drug and protein concentrations. Lower apparent dissociation rate constants were obtained by this approach as the relative amount of drug versus protein was decreased, with the results approaching those measured by peak profiling at low drug concentrations. This information should be useful in better understanding how these and other drugs interact with AGP in the circulation. In addition, the chromatographic approaches that were optimized and used in this report to examine these systems can be adapted for the analysis of other solute-protein interactions of biomedical interest.
Keywords: High performance affinity chromatography, Ultrafast affinity extraction, Peak profiling, Alpha1-acid glycoprotein, Drug-protein binding
1. Introduction
The binding and rate of drug interactions with serum proteins are of great interest because these processes can affect the overall behavior and pharmacokinetics of many drugs in the body [1–5]. Alpha1-acid glycoprotein (AGP, or orosomucoid) is one serum protein that is involved in these interactions [6,7]. Human AGP has an average molar mass of 41 kDa and is heavily glycosylated (~45%), containing up to five N-linked glycan chains [6]. AGP functions as a transport protein in blood for numerous basic and neutral drugs, such as propranolol, imipramine, lidocaine, and verapamil [6,7]. AGP has a normal serum concentration of up to 1 g/L, and this concentration can increase by up to three- or four-fold as a result of infection, rheumatic disorders, surgery, myocardial infarction, malignancies, or nephritis [6,7]. In addition, variations in the concentration of AGP can significantly alter the binding of drugs with this protein [6].
A variety of techniques have been utilized to examine drug interactions with serum proteins such as AGP and related binding agents [8]. Ultrafiltration and equilibrium dialysis are common reference techniques for such work [9,10]. Methods such as absorption spectroscopy [11], fluorescence spectroscopy [11], X-ray crystallography [12], nuclear magnetic resonance spectroscopy [13], capillary electrophoresis [14,15], surface plasmon resonance spectroscopy [16] and stopped flow techniques [5] have also been used for these studies. However, there is still an ongoing need for more rapid, precise or convenient methods for analyzing drug-protein interactions in serum and related samples [8].
High performance affinity chromatography (HPAC) is one alternative approach for examining drug-protein interactions [2,17,18,19]. In this method, a column that contains an immobilized binding agent (e.g., a serum protein) can be used to study the binding of this immobilized agent to applied/injected compounds (e.g., drugs or drug analogs) or to examine the interactions of an applied compound with a second and soluble binding agent in the mobile phase [18,19]. Information that can be acquired through HPAC include the equilibrium constants for the interactions of a drug or target with a given binding agent and the rate constants for these interactions [2,18–20]. Potential advantages of using HPAC include its speed, precision, ease of automation, need for only a small amount of a protein or binding agent, and ability to often reuse the same immobilized binding agent for hundreds of experiments [20–22].
Many approaches have been created for using HPAC to examine the binding [2,19,21] or interaction kinetics [2,4,22–26] for drugs with serum proteins. Two such approaches are peak profiling and ultrafast affinity extraction. Ultrafast affinity extraction, as is illustrated in Figure 1(a), uses a microcolumn that contain an immobilized biological agent like an antibody or serum protein to quickly extract the non-protein bound (or free) form of a drug or solute from a sample [27–31]. Peak profiling, as depicted in Figure 1(b), can examine the rate of a drug-protein interaction by comparing band-broadening measurements that are made under linear elution conditions on an HPAC column and a control column [4,5,24,26]. Binding parameters that have previously been measured by peak profiling or ultrafast affinity extraction on columns containing immobilized human serum albumin (HSA) have given good agreement with those obtained by other methods for HSA or sex hormone binding globulin (SHBG) as they undergo saturable binding at fixed sites with various drugs, hormones and other solutes [24,26,27,29–31]. However, neither of these methods has been used with columns containing immobilized AGP to examine the rates of drug interactions with this protein, which may involve more complex processes such as a combination of saturable and non-saturable binding [32].
Figure 1.
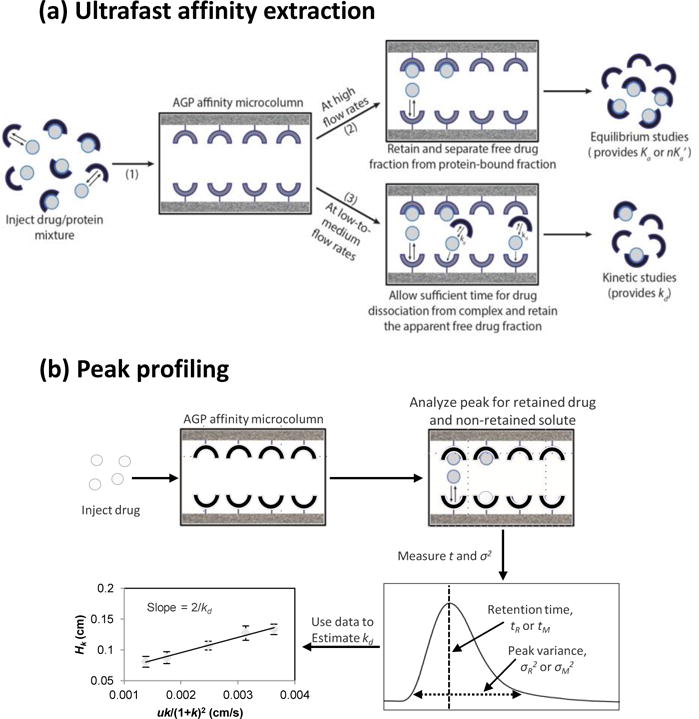
General schemes employed in this study for studying drug-protein interactions by using (a) ultrafast affinity extraction or (b) peak profiling. The method of ultrafast affinity extraction is described in more detail in Sections 3.1–3.3, and the technique of peak profiling is discussed in Section 3.4. Terms: Ka, association equilibrium constant; nKa’, global affinity constant; kd, dissociation rate constant; tR, retention time; tM, void time (i.e., elution time of a non-retained solute); σR2, peak variance of a retained solute; σ2M, peak variance of a non-retained solute; Hk, plate height for a drug or solute due to stationary phase mass transfer; u, linear velocity; k, retention factor.
This study will use ultrafast affinity extraction and peak profiling to study the binding and interaction rates of various drugs with AGP, as based on microcolumns [33] that contain immobilized or entrapped AGP. The conditions needed to carry out these studies will be optimized for each method. Ultrafast affinity extraction will first be used to measure the equilibrium constants, based on both single-site and mixed-mode models, and apparent rate constants for various drugs with soluble AGP, while peak profiling will be employed as a secondary method to study the rates of these interactions. The results should make it possible to determine the relative advantages and limitations of these HPAC methods when they are used to examine drug-AGP interactions. This data should also provide a more complete picture of how drugs bind and dissociate from AGP in the blood stream.
2. Experimental Section
2.1. Reagents
The human AGP (≥ 99% pure, from pooled human serum; product G9885, lot SLBG6410V), periodic acid reagent, lidocaine (≥ 98%), imipramine (≥ 99%), racemic verapamil (≥ 99%), racemic disopyramide (≥ 98%), racemic propranolol (≥ 99%), and S-propanolol (≥ 99%) were from Sigma (St. Louis, MO, USA). Chlorpromazine (≥ 97%) was purchased from Santa Cruz Biotechnology (Dallas, TX, USA), and the ethylene glycol was acquired from Fisher Scientific (Pittsburgh, PA, USA). The Nucleosil Si-300 (7 μm particle diameter, 300 Å pore size) and Nucleosil Si-100 silica (7 μm particle diameter, 100 Å pore size) were from Macherey Nagel (Dűren, Germany). Reagents for the micro bicinchoninic acid (BCA) protein assay were purchased from Pierce (Rockford, IL). All other chemicals were of the purest grades available. All solutions were prepared using water from a Nanopure system (Barnstead, Dubuque, IA, USA) and were filtered using 0.22 μm GNWP nylon filters from Fisher Scientific.
2.2. Apparatus
Centrifugation was performed using a 5702 RH centrifuge (Eppendorf, Hamburg, Germany) and Amicon Ultra centrifugal filtration devices (30 kDa cutoff) from Millipore (Billerica, MA, USA). The chromatographic supports were slurry-packed by using a Prep 24 pump from ChromTech (Apple Valley, MN, USA). The ultrafast affinity extraction experiments were carried out using a Jasco HPLC system (Easton, MD, USA) that included a PU-2080 Plus pump, an AS-2057 autosampler equipped with a 100 μL sample loop, and a UV-2075 absorbance detector. A Jasco CO-2060 oven was used to keep the columns of this system at a temperature of 37°C. The system components were controlled by using ChromNAV v1.18.04 software and LCNet from Jasco.
The experiments for peak profiling were conducted on an HPLC system that included a series 200 micro pump and a series 200 UV/Vis detector from Perkin Elmer (Shelton, CT, USA). Injections were made onto this system by using a six-port Rheodyne LabPro valve (Cotati, CA, USA) and a 5 μL sample loop. The temperature of the column and the mobile phase in this system was controlled by using a Millipore Waters TCM temperature control module (Buffalo Grove, IL, USA). The chromatographic data from this system were collected and processed using in-house programs written in LabView 5.1 (National Instruments, Austin, TX, USA). The chromatograms from both the ultrafast affinity extraction and peak profiling experiments were analyzed using PeakFit v4.12 software (Jandel Scientific, San Rafael, CA, USA).
2.3. Preparation of supports for ultrafast affinity extraction
Covalently immobilized AGP was used as the stationary phase and as a secondary agent to capture free drug fractions for the studies involving ultrafast affinity extraction and samples containing soluble AGP. This AGP support was prepared according to previous methods [34,35], using Nucleosil Si-300 as the starting material. This support was first converted into a diol-bonded form and then oxidized with periodate to give an aldehyde-activated form [34]. The aldehyde-activated silica was reacted for 2 h at room temperature and pH 5.0 with a five-fold mole excess of oxalic dihydrazide versus the initial diol groups on the support (i.e., 1 mg/mL oxalic dihydrazide, in this case) [34]. The hydrazide-activated support was washed with pH 7.0, 0.10 M potassium phosphate buffer. Any remaining aldehyde groups on the support were reduced by adding 20 mL of pH 8.0, 0.10 M potassium phosphate buffer that contained a 25-fold mole excess of sodium borohydride versus the initial diol groups, with this mixture being allowed to react for 90 min at room temperature in a fume hood. The final support was washed with pH 7.0, 0.10 M potassium phosphate buffer before its use in the immobilization of AGP.
AGP was oxidized under mild conditions with periodic acid prior to immobilization of this protein onto the hydrazide-activated silica, as described previously [35,36]. To make 0.10 g of the AGP silica, 10 mg of AGP was dissolved in 2 mL of pH 7.0, 0.020 M sodium acetate that also contained 0.15 M sodium chloride. This solution was combined in a 1:1 (v/v) ratio with a solution that contained 20 mM periodic acid in the same buffer. This mixture was covered in aluminum foil and allowed to react for 10 min in the dark at room temperature, with the reaction then being quenched by adding 0.25 mL of ethylene glycol per milliliter of solution. These conditions resulted in approximately five aldehyde groups being generated per AGP [35]. The oxidized AGP was purified by washing it with pH 7.0, 0.10 M potassium phosphate buffer in Amicon Ultra centrifugal filtration devices [36]; the final volume of the AGP solution was adjusted to 2.0 mL with the same buffer. This solution of oxidized and purified AGP was mixed with 0.10 g of hydrazide-activated silica, placed on an inversion shaker, and allowed to react for one week at 4°C. The reaction was stopped by centrifuging the slurry, removing the supernatant, and washing the support with pH 7.0, 0.10 M phosphate buffer. Any unreacted hydrazide groups that remained on the support were capped by adding a ~50-fold mol excess of glyceraldehyde versus the support’s original hydrazide content, with this mixture being shaken for 6 h at 4°C. The final support was washed with pH 7.0, 0.10 M phosphate buffer and stored in the same buffer at 4°C until further use. A control support was prepared in a similar manner but with no AGP being added to the hydrazide-activated silica during the immobilization step. The amount of immobilized AGP was determined by comparing the final and initial concentrations of AGP in the reaction slurry by using absorbance measurements at 280 nm, giving a value of 33 (± 1) mg AGP/g silica.
These AGP and control supports were placed into separate columns that had an inner diameter of 2.1 mm and lengths of 5 to 10 mm, as made by using standard stainless steel HPLC housings and end fittings, or with a length of 2 mm, as based on a frit-in-column design [37]. All columns were packed at 3000–3500 psi (21–24 MPa) using pH 7.4, 0.067 M potassium phosphate buffer as the packing solution and were stored in the same type of buffer at 4 °C when not in use. These columns were found to have good long-term stabilities, with retention factors that decreased by only 14–20% during regular injections of propranolol and verapamil over the course of approximately 150 injections and six months of use.
2.4. Preparation of supports for peak profiling
The experiments with peak profiling used soluble AGP that had been immobilized through entrapment, as prepared according to methods described in Refs. [36,38]. In this method, Nucleosil Si-100 silica was converted to diol-bonded silica, changed into an aldehyde-activated form, and reacted with oxalic dihydrazide to form hydrazide-activated silica [34], using an approach similar to that described in the previous section. The amount of oxalic dihydrazide that was added to the aldehyde-activated silica during this process was determined by using a ratio of 1:1 (mol/mol) for this reagent versus the diol groups that were originally present on the support [34,36]. A 17 mg portion of glycogen was oxidized by treating it with 135 mg of periodic acid in the dark for 18 h in 4.0 mL of a pH 5.0, 20 mM sodium acetate buffer that also contained 15 mM sodium chloride. This was followed by washing the glycogen with water by using Amicon Ultra centrifugal filtration devices, followed by washes with a pH 5.0, 0.10 M potassium phosphate solution to remove any remaining periodic acid or soluble oxidation products [36,38]. A 500 μL portion of 20 mg/mL AGP and 380 μL of 4.25 mg/mL oxidized glycogen, with the latter being used as a capping agent, were mixed with 80 mg of the hydrazide-activated silica in a pH 5.0, 0.10 M potassium phosphate solution at 4 ºC for 16 h. Any remaining aldehyde groups on the surface of the silica or on the glycogen were deactivated by adding 54 μL of 1 mg/mL oxalic dihydrazide that was dissolved in a pH 5.0, 0.10 M potassium phosphate solution. The same method was used to prepare a control support, with no AGP being added during the entrapment process. The amount of entrapped AGP on the support was determined by a micro BCA protein assay, giving a value of 36 (± 2) mg AGP/g silica.
The entrapped AGP and control supports were packed at 4000 psi (27.6 MPa) into separate 2.1 mm i.d. × 1 cm stainless steel columns by using pH 7.4, 0.067 M potassium phosphate buffer as the packing solution. These columns were stored in this same buffer at 4°C when not in use. These columns were found to provide consistent retention factors (i.e., changes of less than ± 4%) for all the tested drugs over the course of more than 200 injection cycles and six months of use.
2.5. Chromatographic studies
A pH 7.4, 0.067 M potassium phosphate buffer was used as the mobile phase and to prepare all drug solutions or drug/protein samples that were used in this study. The mobile phase was filtered and degassed under vacuum for 30 min prior to use. All studies were carried out at 37°C and by making three-to-four injections of each sample. Each working solution for a given drug was stored at 4°C and used within one week of preparation.
The model drugs used in this study were from several classes of pharmaceutical agents and represented a relatively broad range of therapeutic concentrations and affinities for AGP. These drugs included verapamil and disopyramide (i.e., antiarrythmic drugs with therapeutic concentrations of 0.1–0.6 and 6–24 μM; detection wavelength, 229 nm or 260–261 nm, respectively), lidocaine (a local anesthetic; therapeutic range, 4–26 μM; wavelength, 210 nm), imipramine (an antidepressant; therapeutic range, 0.2–0.5 μM; wavelength, 210 or 252 nm), propranolol (a beta blocker; therapeutic range, 0.1–1 μM; wavelength, 225 nm), and chlorpromazine (an antipsychotic drug; therapeutic range, 15 to 31 μM; wavelength, 254 nm) [39–46]. The association equilibrium constants for these drugs with AGP have been previously determined at 37°C and pH 7.4, with values spanning from 104–106 M−1 [7,32,39–45]. In addition, the dissociation rate constant for lidocaine with AGP has been measured previously [25]; however, no dissociation rate constants with AGP have been reported for the other drugs in this study.
For ultrafast affinity extraction, the drug and protein mixtures were incubated for at least 30 min prior to injection. This incubation time was sufficient to reach equilibrium in these samples due to the relatively fast association and dissociation rates that are typically present for drug interactions with serum proteins like HSA and AGP [27,47]. The drug/protein mixtures that were examined in this work contained between a 1.3- and 20-fold mol excess of soluble AGP versus the drug and were applied onto an AGP microcolumn using an injection volume of 5 to 10 μL. Additional details on the column sizes and flow rates that were used in these studies can be found in Section 3.1 and the Supplementary Materials. The areas of the resulting peaks were determined by using PeakFit 4.12 and the linear progressive baseline correction option of this program. The free drug fractions in each sample were found by dividing the retained peak area of a given drug by the total peak area that was obtained for a standard that contained the same total concentration of the drug but no protein [27,30].
In the peak profiling experiments, linear elution conditions were obtained when using the following concentrations for 20 μL injections of each drug or solute sample: 6 μM, disopyramide; 7 μM, imipramine; 10 μM, S-propranolol; 13 μM, chlorpromazine; or 6 μM, sodium nitrate (i.e., a solute which is often used as a non-retained marker for HPAC columns like those used in this study; detection wavelength, 205 nm) [2,5,8]. These samples were injected onto an AGP column and a control column at flow rates ranging from 0.5–1.5 mL/min. Injections were also made using a zero volume union in place of the column to correct for the elution time or band-broadening created by extra-column components of the system. The retention time and variance of each chromatographic peak were found by using PeakFit 4.12 with a linear progressive baseline correction and an exponentially-modified Gaussian fit.
3. Results and Discussion
3.1. Selection of conditions for ultrafast affinity extraction
Ultrafast affinity extraction was first used to examine the interactions of the model drugs with soluble AGP [29,30]. In this method, each drug was incubated with soluble AGP prior to injection of this mixture onto an AGP microcolumn. The free fraction of the drug in this mixture was retained by the AGP microcolumn as the soluble, bound form of the drug and soluble AGP eluted as a non-retained peak. At high flow rates, the results were used to determine the equilibrium concentration of the drug in its free form. At low-to-moderate flow rates, some of the drug bound to the soluble AGP dissociated from this protein while the sample was in the microcolumn; this dissociated drug then increased the measured free fraction. The change observed in this apparent free fraction when varying the flow rate made it possible to obtain the dissociation rate constant for this interaction [30].
The relationship between the time allowed for drug-protein dissociation in the microcolumn and the apparent free drug fraction that is measured can be described by the following reaction, as is written for a single-site saturable interaction of a drug (D) with a soluble protein (P) to form a reversible drug-protein complex (DP).
| (1) |
In this reaction, ka and kd are the association and dissociation rate constants for the drug-protein complex, respectively, and Ka is the association equilibrium constant for this process (where Ka = [DP]/[D][P]). When this drug/protein mixture is injected onto a microcolumn that also contains an immobilized form of the protein, P(s), the free form of the drug in the sample can be extracted and retained by the immobilized protein. This process is described by Eq. (2),
| (2) |
where ka(s) is the association rate constant for the drug with the immobilized protein. A large excess of immobilized protein versus the soluble protein helps to promote binding by the drug to P(s) versus rebinding of the free drug with the soluble protein P [30]. For example, the experiments in this study typically used a 15-fold mol excess of the immobilized AGP (effective concentration, 430 μM) versus the amount of soluble AGP that was in the injected samples.
The reactions in Eqs. (1–2) can be used to obtain the following equivalent integrated rate expressions that show how the apparent free drug fraction should change as the sample spends various amounts of time in the microcolumn [30].
| (3) |
| (4) |
In these equations, F0 is the original free fraction of the drug D in the sample (e.g., as determined at high flow rates), and Ft is the apparent free fraction that is measured at low-to-moderate flow rates (i.e., where the complex DP is allowed to dissociate for time t in the microcolumn).
Figure 2(a) shows some typical chromatograms that were obtained with an AGP microcolumn during the use of ultrafast affinity extraction for samples containing verapamil or verapamil plus soluble AGP. It was found in this experiment that greater than 95% extraction was obtained for the free drug fraction within as little as 370 ms. This captured free drug fraction was separated from the non-retained sample components and eluted under isocratic conditions. Similar behavior and results to those depicted in Figure 2(a) were obtained for the other model drugs. The time required for elution of the retained free drug fractions ranged from 0.5–7 min for the various drugs, column sizes, and flow rates that were used in this report.
Figure 2.

(a) Typical chromatograms obtained on a 5 mm × 2.1 mm i.d. AGP microcolumn for separation of the free and protein-bound fractions of verapamil in 5 μL samples containing 10 μM verapamil plus 20 μM AGP or 10 μM verapamil alone and injected at 2.25 mL/min. (b) Effect of flow rate on the measured free drug fractions for a sample containing 10 μM verapamil and 20 μM AGP. The error bars represent a range of ± 1 S.D.
The effect of varying the flow rate on the measured free drug fractions for the AGP microcolumns is illustrated in Figure 2(b), using verapamil again as an example. The same general behavior was noted for the other model drugs. At low-to-moderate flow rates (i.e., 2.0 mL/min or less, in this example), some of the AGP-bound verapamil in the sample was able to dissociate, leading to an increase in the apparent free drug fraction as the flow rate was decreased. However, the apparent free drug fraction reached a consistent value when the flow rate became sufficiently high to keep this dissociation at a negligible level. This situation, which occurred at a flow rate of 2.25 mL/min or higher in Figure 2(b), was used to determine the free drug fraction for verapamil in the original sample and the equilibrium constant for this drug with the soluble AGP (see Section 3.2). The free drug fractions that were measured at lower flow rates were used to determine the dissociation rate constant for this interaction (Section 3.3).
Column size is another factor that was optimized during the use of ultrafast affinity extraction. Ideally, the AGP microcolumn needed to be sufficiently small to provide reasonably low sample residence times (i.e., down to a few hundred milliseconds) while also providing a relatively high degree of extraction for the free form of the drug and good resolution between the retained free drug fraction and the non-retained sample components [30]. The AGP microcolumns used in this study ranged in size from 2–10 mm × 2.1 mm i.d. These columns had typical backpressures in the range of 2.5–5.1 MPa (360–740 psi) at 3.0 mL/min and could provide column residence times as low as 110–554 ms at this flow rate. Short 2 mm × 2.1 mm i.d AGP microcolumns gave good results when they were used with drugs that had relatively strong binding with AGP (e.g., an affinity in the range of 105–106 M−1, as occurred for propranolol, disopyramide and chlorpromazine) [32,35,43–45]. Longer AGP microcolumns with sizes of 5 or 10 mm × 2.1 mm i.d. worked well with drugs that had moderate binding to AGP (e.g., affinities of 104–105 M−1, as was the case for verapamil, lidocaine and imipramine) [7,39–42].
3.2. Determination of equilibrium constants by ultrafast affinity extraction
The affinities for various drugs with soluble AGP were first determined directly by ultrafast affinity extraction and using data obtained at high flow rates to estimate the free fraction of each drug at equilibrium in the original sample (F0). This information was then used along with Eq. (5) and the known total concentrations of the drug, [D]tot, and soluble protein, [P]tot, in the original sample to obtain an equilibrium constant for this interaction [30].
| (5) |
This particular form of Eq. (5) is for a drug-protein interaction that involves single-site binding, which would be described by the association equilibrium constant Ka. However, the same general relationship can be used to estimate the global affinity constant (nKa’) for a system in which there are multiple, independent and saturable interactions between the drug and protein [30].
Table 1 shows the equilibrium constants that were determined by this direct method for soluble AGP with the model drugs, as based on the use of Eq. (5) with ultrafast affinity extraction and AGP microcolumns. The equilibrium constants that were estimated by using Eq. (5) and measurements of F0 fell within or were similar to the reported range of reference values or were equivalent to these values at the 95% confidence level (see Supplementary Materials) [7,32,35,39–45]. All of the equilibrium constants determined by ultrafast affinity extraction and Eq. (5) also had good precisions, with relative standard deviations of ± 3–15%.
Table 1.
Association equilibrium constants or global affinity constants estimated for several drugs with soluble AGP by using a single-site binding model or mixed-mode model and data obtained with ultrafast affinity extraction and AGP microcolumnsa
| Drug | Drug:prot ein concentrat ions (μM:μM) | Association equilibrium constant, Ka, or global affinity constant, nKa’ (M−1), for a single-site binding model | Association equilibrium constant, Ka (M−1), and partition constant, KD, for a mixed-mode modelb | ||
|---|---|---|---|---|---|
| Direct method, Eq. (5) | Indirect method, Eqs. (4–5) | Literature value(s) [Ref.] | |||
| Verapamil | 10:20 | 1.2 (± 0.1) × 105 | 1.0 (± 0.2) × 105 | 1.2 × 10⁵ [7,39] |
Ka, 1.3 (± 0.4) × 105 |
| 3:15 | 1.3 (± 0.2) × 105 | 1.0 (± 0.3) × 105 | KD, 0.45 (± 0.04) × 105 | ||
| 3:25 | 1.3 (± 0.1) × 105 | 0.9 (± 0.2) × 105 | |||
| Lidocaine | 15:20 | 2.1 (± 0.3) × 105 | 1.3 (± 0.3) × 105 | 1.1 – 1.7 (± 0.2) × 105 [40] |
Ka, 1.5 (± 0.4) × 105 |
| 10:20 | 1.1 (± 0.2) × 105 | 1.6 (± 0.4) × 105 | KD, 0.67 (± 0.02) × 105 | ||
| 3:20 | 1.1 (± 0.2) × 105 | 1.2 (± 0.3) × 105 | |||
| Imipramine | 10:20 | 1.5 (± 0.1) × 105 | 1.6 (± 0.4) × 105 | 1.4 – 1.7 × 10⁵ [41,42] |
Ka, 0.91 (± 0.08) × 105 |
| 3:20 | 1.3 (± 0.1) × 105 | 1.7 (± 0.4) × 105 | KD, 0.46 (± 0.06) × 105 | ||
| 3:40 | 1.2 (± 0.2) × 105 | 0.5 (± 0.1) × 105 | |||
| Disopyramide | 5:7.5 | 6.9 (± 0.3) × 105 | 6.7 (± 1.1) × 105 | 6.3 × 10⁵ [43] |
Ka, 5.2 (± 0.3) × 105 |
| 3:15 | 5.6 (± 0.6) × 105 | 4.1 (± 1.1) × 105 | KD, 0.42 (± 0.08) × 105 | ||
| 3:25 | 5.5 (± 0.4) × 105 | 4.0 (± 1.0) × 105 | |||
| Chlorproma zine | 5:10 | 5.4 (± 0.4) × 105 | 3.9 (± 0.8) × 105 | 4 – 17 × 105 [44,45] |
Ka, 6.1 (± 0.5) × 105 |
| 3:20 | 3.8 (± 0.5) × 105 | 4.2 (± 0.7) × 105 | KD, 0.30 (± 0.03) × 105 | ||
| 3:40 | 3.5 (± 0.5) × 105 | 2.6 (± 0.3) × 105 | |||
| Propranolol | 5:10 | 2.9 (± 0.2) × 105 | 3.6 (± 0.8) × 105 | 3 – 14 × 105 [32,35] |
Ka, 3.3 (± 0.6) × 105 |
| 1:15 | 2.6 (± 0.1) × 105 | 2.1 (± 0.5) × 105 | KD, 0.30 (± 0.11) × 105 | ||
| 1:20 | 2.6 (± 0.4) × 105 | 1.9 (± 0.3) × 105 | |||
All of these results were determined at 37 °C and in pH 7.4 phosphate buffer. The numbers in parentheses represent a range of ± 1 S.D.
There are no units given for KD, since it is simply equal to the ratio [DP]/[D] at equilibrium.
Another method that was used to estimate the equilibrium constants for these drugs with soluble AGP was based on indirect measurements of F0 and the integrated rate expression in Eq. (4) [30]. In this approach, the value of F0 was acquired from the intercept of a plot of ln[1/(1 - Ft)] versus t, which was then used along with Eq. (5) to find Ka or nKa’. Figure 3(a) shows a typical plot that was used in this approach, as obtained for imipramine. A linear response was seen in this type of plot for all of the model drugs, with correlation coefficients that ranged from 0.938–0.990 (n = 4–7). Table 1 also provides the equilibrium constants that were obtained by this second approach. These values had relative precisions of ± 9–25% and also fell within or were similar to the range of reported values for these drugs or gave equivalent values at the 95% confidence level (see Supplementary Materials) [32,35,39–45].
Figure 3.
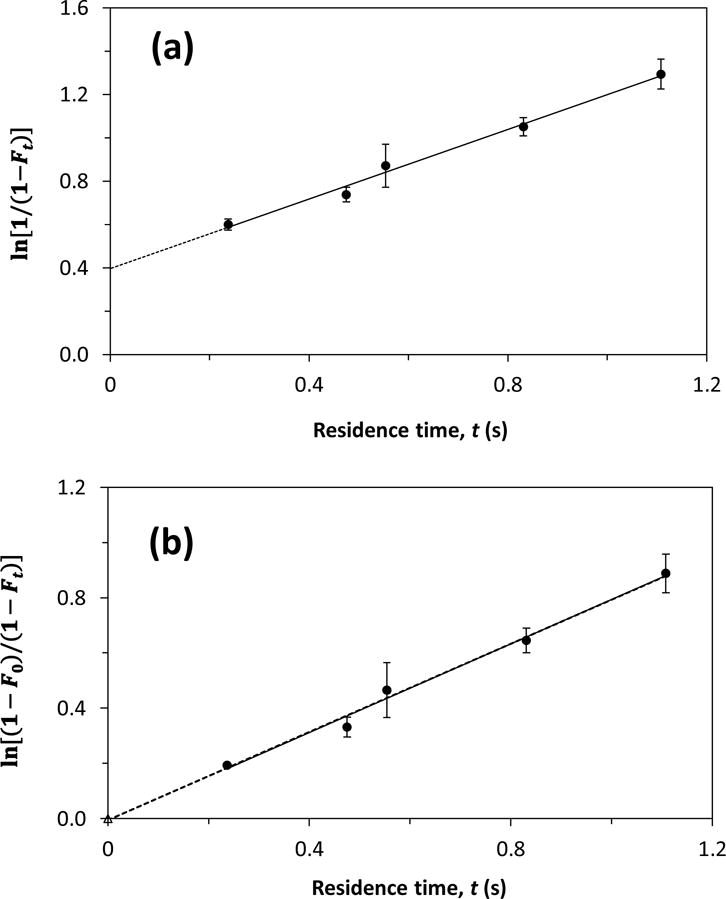
Analysis of the interactions by imipramine with soluble AGP by using ultrafast affinity extraction and Eqs. (3) and (4). The samples contained 10 μM imipramine and 20 μM AGP. The best-fit line in (a) was obtained by using Eq. (4); the equation for this line was y = 0.80 (± 0.05) x + 0.40 (± 0.03) and the correlation coefficient was 0.990. The solid best fit line (n = 5) and dashed best fit line (n = 6) in (b) were obtained with Eq. (3) and by excluding a point at the origin or including the origin point, respectively; the equations for these lines were y = 0.80 (± 0.05) x – 0.01 (± 0.03) and y = 0.80 (± 0.03) x – 0.01 (± 0.02), with correlation coefficients of 0.990 and 0.994, respectively. The error bars represent a range of ± 1 S.D.
A comparison was next made between the results of the two approaches based on ultrafast affinity extraction. The equilibrium constants obtained by the direct and indirect methods were found to be equivalent at the 95% confidence level for most of the samples that were tested; the only exceptions were the samples at the highest protein concentrations for imipramine and propranolol. The precision of the direct method tended to be better than the indirect approach, which used intercepts from plots made according to Eq. (4) to provide F0. The direct method also required fewer experiments to obtain an estimate of the equilibrium constant. An advantage of the indirect approach was its ability to be used with data that were obtained at lower flow rates than the direct method; this feature could be attractive for work in situations where it might not be possible to reach sufficiently high flow rates to minimize drug-protein dissociation effects within the column [30].
An additional comparison was made of the equilibrium constants that were obtained by both methods at various drug and protein concentrations (see Supplementary Materials). A decrease in these values of 19–71%, which was significant at the 95% confidence level, was present as the drug:protein concentration ratio decreased for at least some samples containing disopyramide, propranolol, imipramine or chlorpromazine in the indirect approach and containing chlorpromazine, disopyramide or lidocaine in the direct method. These concentration-dependent changes in the apparent equilibrium constants that were obtained for AGP with a single-site binding model are in line with previous observations that the concentration of AGP can alter the degree of binding by this protein to some pharmaceutical agents [6]. No significant change in the equilibrium constants that have been obtained by ultrafast affinity extraction have been noted in prior work with drugs or hormones and other proteins, such HSA and SHBG, even when working over a broad range of solute and protein concentrations [30,31,48]. However, these systems have involved saturable interactions, while AGP has been reported to have a more complex mixed-mode system of saturable plus non-saturable interactions for drugs such as propranolol and disopyramide [32,49].
A mixed-mode model was next used to analyze the AGP-drug binding data from the ultrafast affinity extraction experiments by adding the following reaction to the single-site saturable model given earlier in Eq. (1) [32,49].
| (6) |
In Eq. (6), D undergoes partitioning from the solution into a portion of protein P, giving DP as the new state of this drug within the protein. This non-saturable process is described by the distribution constant KD. The mixed-mode model in Eqs. (1) plus (6) can be used with Eq. (7) (see derivation in the Supplementary Material) and the known total concentrations of AGP (CP) and the drug (CD) in several mixtures of these agents to estimate the values of Ka and KD.
| (7) |
Table 1 includes the values of Ka and KD that were obtained when Eq. (7) was used to examine the data obtained by ultrafast affinity extraction. The Ka results again showed good agreement with previous reference values that have been reported for AGP and its saturable interactions with the same drugs (i.e., results falling with the range of reference values or agreeing at the 95% confidence level). However, the addition of a non-saturable interaction to the binding model made it possible to now describe the entire set of data for each drug/AGP combination with a single set of values for Ka and KD. These values had variations of ± 6–31% for Ka and ± 3–37% for KD, with an average precision of ± 15% for both types of values, under the range of concentration conditions that was used in this study. In addition, the KD values that were estimated in this study were in the same general range of 103–104 that has been measured or observed in prior studies for the non-saturable interactions by several of these drugs with AGP [32,49].
3.3. Determination of dissociation rate constants by ultrafast affinity extraction
Ultrafast affinity extraction was next used to determine the dissociation rate constants for the model drugs with soluble AGP. This was accomplished by making a plot of either ln[(1 - F0)/(1 - Ft)] or ln[1/(1 - Ft)] versus t for each drug. As is indicated by Eqs. (3) and (4), these plots should result in linear relationships in which the slope provides the dissociation rate constant for the drug with the soluble protein. An example of a plot that was made according to Eq. (4) is given in Figure 3(a). Figure 3(b) shows the result when the same data were plotted according to Eq. (3). A linear response was obtained for both types of plots for all of the model drugs, with correlation coefficients that ranged from 0.955–0.998 (n = 4–6).
Table 2 lists the apparent kd values that were obtained for the model drugs with soluble AGP when using these two types of plots (Note: the term “apparent” is used here because these values would represented the observed composite of dissociation rate constants for saturable and non-saturable interactions when both processes are present) [50]. The values that were acquired by using Eq. (3) or (4) had precisions ranging from ± 4–15% or ± 4–21%, respectively. The dissociation rate constants that were obtained from these plots spanned from 0.14 to 7.0 s−1 at pH 7.4 and 37°C. Reference values for the dissociation rate constants were not available for most of these drugs; however, a previous value reported for AGP that had been treated with an excess of lidocaine [25] differed by only 16% from the values that were measured here at the highest lidocaine concentrations. In addition, the dissociation rate constants that were measured with the other model drugs were comparable to those reported for AGP with different targets [25] and for HSA with solutes that had equilibrium constants similar to those for AGP and the drugs used in this present study [25,30].
Table 2.
Apparent dissociation rate constants measured at various concentrations for drugs and AGP by using ultrafast affinity extraction or peak profilinga
| Drug | Drug:protein concentrations (μM:μM) | Apparent dissociation rate constant, kd (s−1) | |||
|---|---|---|---|---|---|
| Ultrafast affinity extraction | Peak profiling | Literature value [Ref.] | |||
| Eq. (3)b | Eq. (4) | ||||
| Verapamil | 10:20 | 0.62 (± 0.05) | 0.59 (± 0.07) | Not studied | Not reported |
| 3:15 | 0.35 (± 0.05) | 0.34 (± 0.06) | |||
| 3:25 | 0.20 (± 0.03) | 0.19 (± 0.04) | |||
| Lidocaine | 15:20 | 0.63 (± 0.05) | 0.61 (± 0.05) | Not studied | 0.73 (± 0.07) [25] |
| 10:20 | 0.32 (± 0.03) | 0.35 (± 0.04) | |||
| 3:20 | 0.14 (± 0.02) | 0.15 (± 0.02) | |||
| Imipramine | 10:20 | 0.80 (± 0.03) | 0.80 (± 0.05) | 0.13 (± 0.01) | Not reported |
| 3:20 | 0.48 (± 0.03) | 0.51 (± 0.04) | |||
| 3:40 | 0.27 (± 0.04) | 0.24 (± 0.04) | |||
| Disopyramide | 5:7.5 | 2.6 (± 0.1) | 2.6 (± 0.2) | 0.38 (± 0.02) | Not reported |
| 3:15 | 0.63 (± 0.05) | 0.62 (± 0.06) | |||
| 3:25 | 0.29 (±0.04) | 0.28 (±0.06) | |||
| Chlorpromazine | 5:10 | 2.6 (± 0.4) | 4.5 (± 0.6) | 0.10 (± 0.01) | Not reported |
| 3:20 | 1.1 (± 0.1) | 1.0 (± 0.2) | |||
| 3:40 | 0.60 (± 0.03) | 0.56 (± 0.02) | |||
| Propranolol | 5:10 | 5.2 (± 0.8) | 7.0 (± 0.8) | S-Propranolol | Not reported |
| 1:15 | 0.81 (± 0.07) | 0.77 (± 0.09) | |||
| 1:20 | 0.24 (± 0.02) | 0.24 (± 0.02) | 0.19 (± 0.01) | ||
All of these results were determined at 37 °C and in pH 7.4 phosphate buffer. The values in parentheses represent a range of ± 1 S.D., as determined from the slopes of best-fit lines that were obtained according to Eqs. (3), (4), and (7) and by using error propagation.
These kd values were estimated by using Eq. (3) when a point at the origin was included in the plots.
The effect of drug and protein concentration on the estimated rate constants was evaluated in more detail. It was found that the measured value of kd decreased by 36–97% as the relative concentration of the drug versus AGP was decreased. These decreases were significant at the 95% confidence level (see Supplementary Material). Such variations in the dissociation rate constants as a function of drug or protein concentration have not been observed in previous work with HSA or SHBG and solutes that involved saturable binding [30,31,51]. These results again indicate that concentration-dependent effects on binding, such as can occur through a mixture of saturable and non-saturable interactions [32,49], may have influenced the apparent dissociation rate constants that were estimated in this study for the model drugs with AGP.
3.4. Determination of dissociation rate constants by peak profiling
Peak profiling was used as a second approach to estimate the dissociation rate constants for the model drugs with AGP. This method is illustrated in Figure 1(b) and is based on measurements of the chromatographic retention and band-broadening of solutes in the presence and absence of an immobilized binding agent [4,5,24,26]. One reason peak profiling was chosen as a second method for this study is this technique ideally provides results under conditions in which the amount of drug that is present is much lower than that of the protein (i.e., as represented by linear elution conditions) [24,26]. This feature allowed peak profiling to be used to estimate the limiting value for kd for each drug with AGP as the ratio of the drug and protein concentrations approached zero.
The binding of a drug (D) with an immobilized protein, P(s), was described in this approach by using a reversible 1:1 interaction model, as given in Eq. (8) [24].
| (8) |
Other terms that again appear in such a reaction include the association equilibrium constant (Ka), association rate constant (ka), and dissociation rate constant (kd) for the drug-protein interaction. In the case where the immobilized protein is physically entrapped but fully soluble, as was true in this study, the values of Ka, ka, and kd in Eq. (8) should be equivalent to the values for AGP in a solution.
The peak profiling method in this report made use of a range of flow rates, over which measurements were obtained for the retention times and variances of a drug and a non-retained solute under linear elution conditions on an AGP microcolumn. The results were then plotted according to Eq. (9), as utilized in previous work with columns containing HSA and employing a single-site interaction model [26].
| (9) |
In this study, HR represented the total plate height measured for a drug on an AGP microcolumn, HM was the total plate height measured on the same microcolumn for a non-retained solute, Hk was the plate height contribution due to stationary phase mass transfer for the drug, u was the linear velocity, and k was the retention factor for the drug on the AGP microcolumn. According to Eq. (9), a linear relationship should have been observed when a plot was made of (HR - HM) versus uk/(1+k)2 if all band-broadening sources other than Hk were negligible or the same for the drug and the non-retained solute. The dissociation rate constant could then be estimated from the best-fit slope of this plot, which had a value equal to 2/kd.
Figure 4 provides some typical chromatograms that were obtained when injecting disopyramide and sodium nitrate (i.e., a non-retained solute) onto an AGP microcolumn at various flow rates. Each chromatogram was acquired within 20 to 120 s, which made it possible to quickly carry out multiple injections for both the drug and non-retained solute at each flow rate. The overall retention factor (k) of disopyramide on the AGP microcolumn was estimated to be 13.7 (± 1.8). The value of Hk at each flow rate was calculated based on the retention time and peak variances of this drug and sodium nitrate, as described in prior work with HSA [24,26], and the results were analyzed by making a plot of Hk versus the combined term uk/(1+k)2. As is shown in Figure 5(a), the plot that was obtained gave a linear response with a correlation coefficient of 0.996 (n = 5). The value of kd that was estimated from the slope resulted in a dissociation rate constant between disopyramide and the entrapped AGP of 0.38 (± 0.02) s−1 at pH 7.4 and 37°C.
Figure 4.

Typical chromatograms obtained using peak profiling for (a) sodium nitrate (i.e., a non-retained solute) and (b) disopyramide on a 1 cm × 2.1 mm i.d. AGP microcolumn at several flow rates.
Figure 5.

Plots for injections of sodium nitrate and (a) disopyramide, (b) imipramine, (c) S-propranolol, or (d) chlorpromazine on an AGP microcolumn. The correlation coefficients for these results were as follows: (a) 0.996, n = 5; (b) 0.982, n = 5; (c) 0.996, n = 5; and (d) 0.994, n = 5. The error bars in these plots represent a range of ± 1 S.D.
Similar experiments were performed for imipramine, S-propranolol, and chlorpromazine on the entrapped AGP microcolumns. These drugs eluted within 2–6, 1–3, or 4–16 min, respectively, at the flow rates used in these studies and gave retention factors of 65.0 (± 4.9), 29.8 (± 3.4), or 228 (± 18). The plots of Hk versus uk/(1+k)2 that were produced for these drugs are shown in Figures 5(b–d); these plots again produced linear relationships and gave correlation coefficients of 0.982 (n = 5), 0.996 (n = 5), and 0.994 (n = 5), respectively. The corresponding apparent dissociation rate constants that were estimated for these drugs with AGP are summarized in Table 2 and ranged from 0.10 to 0.38 s−1 (see Supplementary Materials for additional information and equations), with precisions that varied from ± 5.2 to 10%.
As is shown in Table 2, the dissociation rate constants that were determined by ultrafast affinity extraction approached the results obtained by peak profiling as the ratio of the drug/protein concentrations was decreased in the former method. For instance, this can be seen in the results for disopyramide and propranolol, where the results for the two approaches were equivalent at the 99% or 99.8% confidence levels, respectively, at the lowest drug/protein ratios that were employed for ultrafast affinity extraction. The same trend was seen for imipramine and chlorpromazine; however, for these drugs the peak profiling results were still significantly lower at the 95–99.8% confidence levels, giving kd values that were 46–83% smaller than those obtained by ultrafast affinity extraction under the conditions used in this study. In all of these cases, the combined results of the two methods provided an estimate for the range in kd values that might be encountered at various concentration ratios for each of the model drugs with AGP.
4. Conclusion
This study used affinity microcolumns with the methods of ultrafast affinity extraction and peak profiling to examine the interactions for a number of basic and neutral drugs with AGP. The conditions needed in each of these techniques to determine equilibrium and/or dissociation rate constants were first optimized. The effect of varying the concentrations of the drugs and soluble AGP were also investigated in the studies based on ultrafast affinity extraction. The final results obtained by these two methods were compared with each other and with values that were available from the literature. The association equilibrium constants measured for the given drugs with soluble AGP by ultrafast affinity extraction were in the general range of 104–106 M−1 at pH 7.4 and 37°C and gave good agreement with literature values when using either a single-site saturable model or a mixed-mode model based on both saturable and non-saturable binding [7,32,33,39–45]. The mixed-mode model was more useful in describing these systems than a single-site model, which gave concentration-dependent binding constants. The presence of multiple types of interactions was also suggested by the apparent dissociation rate constants that were determined by ultrafast affinity extraction, which varied from 0.14 to 7.0 s−1 and were dependent on the relative drug and protein concentrations that were employed. This information should be useful in better understanding how these and other drugs interact with AGP in the circulation and on the effects of drug or protein concentration on these processes. In addition, the approaches used in this report to examine these interactions can be extended to other solute-protein systems.
Supplementary Material
Highlights.
The interactions of drugs with alpha1-acid glycoprotein (AGP) were studied.
Several chromatographic methods based on affinity microcolumns were used.
Ultrafast affinity extraction gave information on the binding strength and rates.
Peak profiling was also used to examine the dissociation rates of these systems.
The results agreed with the literature but were concentration-dependent.
These approaches can be adapted for use with other solutes and proteins.
Acknowledgments
This work was funded by the National Institutes of Health under grant number R01 GM044931.
Footnotes
Publisher's Disclaimer: This is a PDF file of an unedited manuscript that has been accepted for publication. As a service to our customers we are providing this early version of the manuscript. The manuscript will undergo copyediting, typesetting, and review of the resulting proof before it is published in its final citable form. Please note that during the production process errors may be discovered which could affect the content, and all legal disclaimers that apply to the journal pertain.
References
- 1.Banker MJ, Clark TH. Plasma/serum protein binding determinations. Curr Drug Metab. 2008;9:854–859. doi: 10.2174/138920008786485065. [DOI] [PubMed] [Google Scholar]
- 2.Hage DS, Jackson A, Sobansky MR, Schiel JE, Yoo MJ, Joseph KS. Characterization of drug-protein interactions in blood using high-performance affinity chromatography. J Sep Sci. 2009;32:835–853. doi: 10.1002/jssc.200800640. [DOI] [PMC free article] [PubMed] [Google Scholar]
- 3.Vuignier K, Schappler J, Veuthey JL, Carrupt PA, Martel S. Drug–protein binding: a critical review of analytical tools. Anal Bioanal Chem. 2010;398:53–66. doi: 10.1007/s00216-010-3737-1. [DOI] [PubMed] [Google Scholar]
- 4.Bi C, Beeram S, Li Z, Zheng X, Hage DS. Kinetic analysis of drug–protein interactions by affinity chromatography. Drug Discov Today Technol. 2015;17:16–21. doi: 10.1016/j.ddtec.2015.09.003. [DOI] [PMC free article] [PubMed] [Google Scholar]
- 5.Zheng X, Bi C, Li Z, Podariu M, Hage DS. Analytical methods for kinetic studies of biological interactions: a review. J Pharm Biomed Anal. 2015;113:163–180. doi: 10.1016/j.jpba.2015.01.042. [DOI] [PMC free article] [PubMed] [Google Scholar]
- 6.Fournier T, Medjoubi-N N, Porquet D. Alpha-1-acid glycoprotein, Biochim. Biophys Acta. 2000;1482:157–171. doi: 10.1016/s0167-4838(00)00153-9. [DOI] [PubMed] [Google Scholar]
- 7.Israili ZH, Dayton PG. Human alpha-1-glycoprotein and its interactions with drugs. Drug Metab Rev. 2001;33:161–235. doi: 10.1081/dmr-100104402. [DOI] [PubMed] [Google Scholar]
- 8.Hage DS, Anguizola JA, Jackson AJ, Matsuda R, Papastavros E, Pfaunmiller E, Tong Z, Vargas-Badilla J, Yoo MJ, Zheng X. Chromatographic analysis of drug interactions in the serum proteome. Anal Methods. 2011;3:1449–1460. doi: 10.1039/C1AY05068K. [DOI] [PMC free article] [PubMed] [Google Scholar]
- 9.Heinze A, Holzgrabe U. Protein bonding of drugs. Rapid determination by means of continuous ultra filtration. Bioforum. 2005;28:21–23. [Google Scholar]
- 10.Zhirkov YA, Piotrovskii VK. On the usefulness of ultrafiltration in drug-protein binding studies. J Pharm Pharmacol. 1984;36:844–845. doi: 10.1111/j.2042-7158.1984.tb04891.x. [DOI] [PubMed] [Google Scholar]
- 11.Xie M, Long M, Liu Y, Qin C, Wang Y. Characterization of the interaction between human serum albumin and morin. Biochim Biophys Acta. 2006;1760:1184–1191. doi: 10.1016/j.bbagen.2006.03.026. [DOI] [PubMed] [Google Scholar]
- 12.Curry S. Lessons from the crystallographic analysis of small molecule binding to human serum albumin. Drug Metab Pharmacokinet. 2009;24:342–357. doi: 10.2133/dmpk.24.342. [DOI] [PubMed] [Google Scholar]
- 13.Shortridge MD, Hage DS, Harbison GS, Powers R. Estimating protein-ligand binding affinity using high throughput screening by NMR. J Comb Chem. 2008;10:948–958. doi: 10.1021/cc800122m. [DOI] [PMC free article] [PubMed] [Google Scholar]
- 14.Heegaard NHH, Schou C. Affinity ligands in capillary electrophoresis. In: Hage DS, editor. Handbook of Affinity Chromatography. 2. CRC Press; Boca Raton: 2006. pp. 699–735. [Google Scholar]
- 15.Liu X, Chen X, Yue Y, Zhang J, Song Y. Study of interaction between drug enantiomers and human serum albumin by flow injection-capillary electrophoresis frontal analysis. Electrophoresis. 2008;29:2876–2883. doi: 10.1002/elps.200700748. [DOI] [PubMed] [Google Scholar]
- 16.Day YSN, Myszka DG. Characterizing a drug’s primary binding site on albumin. J Pharm Sci. 2003;92:333–343. doi: 10.1002/jps.10293. [DOI] [PubMed] [Google Scholar]
- 17.Schiel JE, Mallik R, Soman S, Joseph KS, Hage DS. Applications of silica supports in affinity chromatography. J Sep Sci. 2006;29:719–737. doi: 10.1002/jssc.200500501. [DOI] [PubMed] [Google Scholar]
- 18.Chaiken IM. Analytical Affinity Chromatography. Vol. 1987 CRC Press; Boca Raton: [Google Scholar]
- 19.Hage DS, Anguizola JA, Bi C, Li R, Matsuda R, Papastavros E, Pfaunmiller E, Vargas J, Zheng X. Pharmaceutical and biomedical applications of affinity chromatography: recent trends and developments. J Pharm Biomed Anal. 2012;69:93–105. doi: 10.1016/j.jpba.2012.01.004. [DOI] [PMC free article] [PubMed] [Google Scholar]
- 20.Winzor DJ. Determination of binding constants by affinity chromatography. J Chromatogr A. 2004;1037:351–367. doi: 10.1016/j.chroma.2003.11.092. [DOI] [PubMed] [Google Scholar]
- 21.Hage DS, Anguizola J, Barnaby O, Jackson A, Yoo MJ, Papastavros E, Pfaunmiller E, Sobansky M, Tong Z. Characterization of drug interactions with serum proteins by using high-performance affinity chromatography. Curr Drug Metab. 2011;12:313–328. doi: 10.2174/138920011795202938. [DOI] [PMC free article] [PubMed] [Google Scholar]
- 22.Hage DS, Chen J. Quantitative affinity chromatography: practical aspects. In: Hage DS, editor. Handbook of Affinity Chromatography. 2. CRC Press; Boca Raton, FL: 2006. pp. 595–628. [Google Scholar]
- 23.Talbert AM, Tranter GE, Holmes E, Francis PL. Determination of drug-plasma protein binding kinetics and equilibria by chromatographic profiling: exemplification of the method using L-tryptophan and albumin. Anal Chem. 2002;74:446–452. doi: 10.1021/ac010643c. [DOI] [PubMed] [Google Scholar]
- 24.Schiel JE, Ohnmacht CM, Hage DS. Measurement of drug-protein dissociation rates by high performance affinity chromatography and peak profiling. Anal Chem. 2009;81:4320–4333. doi: 10.1021/ac9000404. [DOI] [PMC free article] [PubMed] [Google Scholar]
- 25.Yoo MJ, Hage DS. High-throughput analysis of drug dissociation from serum proteins using affinity silica monoliths. J Sep Sci. 2011;34:2255–2263. doi: 10.1002/jssc.201100280. [DOI] [PMC free article] [PubMed] [Google Scholar]
- 26.Tong Z, Schiel JE, Papastavros E, Ohnmacht CM, Smith QR, Hage DS. Kinetic studies of drug–protein interactions by using peak profiling and high-performance affinity chromatography: examination of multi-site interactions of drugs with human serum albumin columns. J Chromatogr A. 2011;1218:2065–2071. doi: 10.1016/j.chroma.2010.10.070. [DOI] [PMC free article] [PubMed] [Google Scholar]
- 27.Mallik R, Yoo MJ, Briscoe CJ, Hage DS. Analysis of drug-protein binding by ultrafast affinity chromatography using immobilized human serum albumin. J Chromatogr A. 2010;1217:2796–2803. doi: 10.1016/j.chroma.2010.02.026. [DOI] [PMC free article] [PubMed] [Google Scholar]
- 28.Schiel JE, Tong Z, Sakulthaew C, Hage DS. Development of a flow-based ultrafast immunoextraction and reverse displacement immunoassay: analysis of free drug fractions. Anal Chem. 2011;83:9384–9390. doi: 10.1021/ac201973v. [DOI] [PMC free article] [PubMed] [Google Scholar]
- 29.Zheng X, Yoo MJ, Hage DS. Analysis of free fractions for chiral drugs using ultrafast extraction and multi-dimensional high-performance affinity chromatography. Analyst. 2013;138:6262–6265. doi: 10.1039/c3an01315d. [DOI] [PMC free article] [PubMed] [Google Scholar]
- 30.Zheng X, Li Z, Podariu MI, Hage DS. Determination of rate constants and equilibrium constants for solution-phase drug-protein interactions by ultrafast affinity extraction. Anal Chem. 2014;86:6454–6460. doi: 10.1021/ac501031y. [DOI] [PMC free article] [PubMed] [Google Scholar]
- 31.Zheng X, Bi C, Brooks M, Hage DS. Analysis of hormone-protein binding in solution by ultrafast affinity extraction: interactions of testosterone with human serum albumin and sex hormone binding globulin. Anal Chem. 2015;87:1187–11194. doi: 10.1021/acs.analchem.5b03007. [DOI] [PMC free article] [PubMed] [Google Scholar]
- 32.Mallik R, Xuan H, Guiochon G, Hage DS. Immobilization of α1-acid glycoprotein for chromatographic studies of drug–protein binding. II. Correction for errors in association constant measurements. Anal Biochem. 2008;376:154–156. doi: 10.1016/j.ab.2008.01.035. [DOI] [PMC free article] [PubMed] [Google Scholar]
- 33.Zheng X, Li Z, Beeram S, Podariu M, Matsuda R, Pfaunmiller E, White C, Carter N, Hage DS. Analysis of biomolecular interactions using affinity microcolumns: a review. J Chromatogr B. 2014;968:49–63. doi: 10.1016/j.jchromb.2014.01.026. [DOI] [PMC free article] [PubMed] [Google Scholar]
- 34.Ruhn PF, Garver S, Hage DS. Development of dihydrazide-activated silica supports for high-performance affinity chromatography. J Chromatogr A. 1994;669:9–19. doi: 10.1016/0021-9673(94)80332-3. [DOI] [PubMed] [Google Scholar]
- 35.Xuan H, Hage DS. Immobilization of α1-acid glycoprotein for chromatographic studies of drug-protein binding. Anal Biochem. 2005;346:300–310. doi: 10.1016/j.ab.2005.08.025. [DOI] [PubMed] [Google Scholar]
- 36.Bi C, Jackson A, Vargas-Badilla J, Li R, Rada G, Anguizola J, Pfaunmiller E, Hage DS. Entrapment of alpha1-acid glycoprotein in high-performance affinity columns for drug-protein binding studies. J Chromatogr B. 2016;1021:188–196. doi: 10.1016/j.jchromb.2015.11.021. [DOI] [PMC free article] [PubMed] [Google Scholar]
- 37.Schiel JE. PhD Dissertation. University of Nebraska-Lincoln; Lincoln, NE: 2009. Clinical and pharmaceutical applications of high-performance affinity chromatography. [Google Scholar]
- 38.Jackson AJ, Xuan H, Hage DS. Entrapment of proteins in glycogen-capped and hydrazide-activated supports. Anal Biochem. 2010;404:106. doi: 10.1016/j.ab.2010.05.004. [DOI] [PMC free article] [PubMed] [Google Scholar]
- 39.McGowan FX, Reiter MJ, Pritchett ELC, Shand DG. Verapamil plasma binding: relationship to α1-acid glycoprotein and drug efficacy. Clin Pharmacol Ther. 1983;33:485–490. doi: 10.1038/clpt.1983.66. [DOI] [PubMed] [Google Scholar]
- 40.Soman S, Yoo MJ, Jang YJ, Hage DS. Analysis of lidocaine interactions with serum proteins using high-performance affinity chromatography. J Chromatogr B. 2010;878:705–708. doi: 10.1016/j.jchromb.2010.01.016. [DOI] [PMC free article] [PubMed] [Google Scholar]
- 41.Nyberg G, Maartensson E. Determination of free fractions of tricyclic antidepressants. Naunyn-Schmiedeberg’s Arch Pharmacol. 1984;327:260–265. doi: 10.1007/BF00502459. [DOI] [PubMed] [Google Scholar]
- 42.Freilich DI, Giardina EGV. Imipramine binding to alpha-1-acid glycoprotein in normal subjects and cardiac patients. Clin Pharmacol Ther. 1984;35:670–674. doi: 10.1038/clpt.1984.93. [DOI] [PubMed] [Google Scholar]
- 43.Lima JJ, Jungbluth GL, Devine T, Robertson LW. Stereoselective binding of disopyramide to human plasma protein. Life Sci. 1984;35:835–839. doi: 10.1016/0024-3205(84)90408-9. [DOI] [PubMed] [Google Scholar]
- 44.Wright DS, Friedman ML, Jenkins SH, Heineman WR, Halsall HB. Sequestration electrochemistry: the interaction of chlorpromazine and human orosomucoid. Anal Biochem. 1988;171:290–293. doi: 10.1016/0003-2697(88)90488-5. [DOI] [PubMed] [Google Scholar]
- 45.Piafsky KM, Borga O, Odar-Cederlof I, Johansson C, Sjoqvist F. Increased plasma protein binding of propranolol and chlorpromazine mediated by disease-induced elevations of plasma α1 acid glycoprotein. N Engl J Med. 1978;299:1435–1439. doi: 10.1056/NEJM197812282992604. [DOI] [PubMed] [Google Scholar]
- 46.Regenthal R, Krueger M, Koeppel C, Preiss R. Drug levels: therapeutic and toxic serum/plasma concentrations of common drugs. J Clin Monit. 1999;15:529–544. doi: 10.1023/a:1009935116877. [DOI] [PubMed] [Google Scholar]
- 47.Barri T, Trtic-Petrovic T, Karlsson M, Joensson JA. Characterization of drug-protein binding process by employing equilibrium sampling through hollow-fiber supported liquid membrane and Bjerrum and Scatchard plots. J Pharm Biomed Anal. 2008;48:49–56. doi: 10.1016/j.jpba.2008.04.030. [DOI] [PubMed] [Google Scholar]
- 48.Zheng X, Matsuda R, Hage DS. Analysis of free drug fractions by ultrafast affinity extraction: interactions of sulfonylurea drugs with normal or glycated human serum albumin. J Chromatogr A. 2014;1371:82–89. doi: 10.1016/j.chroma.2014.10.092. [DOI] [PMC free article] [PubMed] [Google Scholar]
- 49.Handa K, Ohta T, Hirai M, Arai M, Ogata H. Enantioselective binding of propranolol, disopyramide, and verapamil to human α1-acid glycoprotein. J Pharm Sci. 2000;89:751–757. doi: 10.1002/(SICI)1520-6017(200006)89:6<751::AID-JPS6>3.0.CO;2-8. [DOI] [PubMed] [Google Scholar]
- 50.Espenson JH. Chemical Kinetics and Reaction Mechanisms. 2. McGraw-Hill; New York: 2002. [Google Scholar]
- 51.Yoo MJ, Hage DS. Use of peak decay analysis and affinity microcolumns containing silica monoliths for rapid determination of drug–protein dissociation rates. J Chromatogr A. 2011;1218:2072–2078. doi: 10.1016/j.chroma.2010.09.070. [DOI] [PMC free article] [PubMed] [Google Scholar]
Associated Data
This section collects any data citations, data availability statements, or supplementary materials included in this article.