Abstract
Resistin is an adipocyte hormone that modulates glucose homeostasis. Here we show that in 3T3-L1 adipocytes, resistin attenuates multiple effects of insulin, including insulin receptor (IR) phosphorylation, IR substrate 1 (IRS-1) phosphorylation, phosphatidylinositol-3-kinase (PI3K) activation, phosphatidylinositol triphosphate production, and activation of protein kinase B/Akt. Remarkably, resistin treatment markedly induces the gene expression of suppressor of cytokine signaling 3 (SOCS-3), a known inhibitor of insulin signaling. The 50% effective dose for resistin induction of SOCS-3 is ∼20 ng/ml, close to levels of resistin in serum. Association of SOCS-3 protein with the IR is also increased by resistin. Inhibition of SOCS function prevented resistin from antagonizing insulin action in adipocytes. SOCS-3 induction is the first cellular effect of resistin that is independent of insulin and is a likely mediator of resistin's inhibitory effect on insulin signaling in adipocytes.
Obesity is occurring in epidemic proportions on a global scale. Excess adipose tissue is associated with insulin resistance and type 2 diabetes in rodents as well as humans. In addition to its metabolic properties, adipose tissue has received attention recently for its endocrine properties. Leptin, tumor necrosis factor alpha (TNF-α), interleukin 6 (IL-6), adiponectin (also known as Acrp30 and adipoQ), and resistin are all adipose tissue-secreted molecules that have been implicated in glucose homeostasis and insulin sensitivity (36).
Resistin (also known as FIZZ3 and adipocyte-derived secretory factor) is produced exclusively by adipocytes in rodents (13, 15, 35). Acute administration of recombinant resistin to rats results in impaired glucose tolerance (35) and hepatic insulin resistance (24). Conversely, mice lacking resistin have decreased fasted glucose levels, suggestive of a normal physiological role for resistin in glucose homeostasis (3). Similarly, transgenic mice expressing dominant-negative resistin/ADSF exhibit improved glucose tolerance and insulin sensitivity (16). Longer-term adenovirus-mediated hyperresistinemia causes insulin resistance in liver, skeletal muscle, and adipose tissue (30), and resistin has been shown to impair glucose transport in cultured rat L6 myotubes (19) and mouse 3T3-L1 adipocytes (35).
The insulin signaling cascade has been studied extensively in 3T3-L1 adipocytes (37). The insulin receptor (IR) is a transmembrane protein whose intrinsic kinase activity is activated upon insulin binding (29), resulting in autophosphorylation and docking of IR substrate (IRS) proteins such as IRS-1 (29). Tyrosine phosphorylation of IRS-1 leads to recruitment and activation of phosphatidylinositol-3-kinase (PI3K), which generates intracellular lipids such as phosphatidylinositol triphosphate (PIP3) and PI(3,4,5)P3, that activate PIP3-dependent kinases (PDK) that, in turn, phosphorylate and activate Akt/protein kinase B, which is necessary for stimulation of glucose transport (6, 14).
Several cellular mechanisms of insulin resistance have been described. TNF-α and fatty acids lead to inhibitory phosphorylation of IRS-1 at Ser307 via activation of jun amino-terminal kinase (JNK1) (1) and protein kinase C-θ, (43), respectively. Chronic TNF-α exposure has also been demonstrated to lead to IRS-1 degradation (28). In addition to these mechanisms, suppressor of cytokine signaling (SOCS) proteins have emerged as inhibitors of insulin signaling (17). The SOCS family of proteins consists of eight family members, all of which contain a central SH2 domain and conserved carboxy terminus containing a SOCS box (18). SOCS expression is tightly regulated at the transcriptional level and is induced by multiple cytokines in different tissues in a cytokine- and tissue-dependent manner (18).
Here we have investigated the effects of resistin on the insulin signaling cascade in 3T3-L1 adipocytes. In a dose-dependent manner, preincubation with resistin impairs insulin action at multiple steps in the signaling cascade. Remarkably, resistin markedly induced SOCS-3 expression, without altering IRS-1 levels or serine phosphorylation. Moreover, loss of SOCS function impairs resistin action in adipocytes. This is the first known insulin-independent action of resistin on 3T3-L1 adipocytes and is a likely mediator of resistin's inhibitory action on insulin signaling.
MATERIALS AND METHODS
Antibodies.
Rabbit polyclonal antibody to IRβ subunit was purchased from Transduction Laboratories (Lexington, Ky.). The rabbit polyclonal anti-IRS-1 and mouse monoclonal antiphosphotyrosine (4G10) antibodies were obtained from Upstate Biotechnology (Lake Placid, N.Y.). Phospho-Akt and Akt antibodies were purchased from Cell Signaling (Beverly, Mass.). IRS-1 phosphospecific antibodies were kindly provided by Roberto Polakiewicz from Cell Signaling. The rabbit polyclonal antibody for SOCS-3 (M-20) was purchased from Santa Cruz Biotechnology.
Preparation of recombinant resistin.
Recombinant resistin was purified as previously described with the following modifications (35). Conditioned medium was collected from HEK-293 cells that stably express either resistin or empty vector (pIRESneo; Clontech, Palo Alto, Calif.) and subjected to immunopurification with Flag antibody-agarose (Sigma, St. Louis, Mo.) and eluted with Flag peptide in phosphate-buffered saline (PBS). Purification to homogeneity was confirmed by silver stain and Western blot analysis. Endotoxin levels were measured with the Limulus amoebocyte lysate assay and determined to be less than 0.008 endotoxin unit per ml. Protein concentration was determined with a mouse resistin radioimmunoassay (Linco, St. Louis, Mo.). The vehicle or control used for all experiments was mock-purified conditioned medium added in equal volumes as purified recombinant resistin.
Adenovirus preparation and use.
Adenovirus expressing the green fluorescent protein-Grp1 pleckstrin homology (GFP-Grp1-PH) fusion protein has been previously described (41). Adenovirus expressing the dominant-negative SOCSF59D protein (12, 38) and enhanced GFP (EGFP; control) were prepared by standard methods. All adenoviruses were amplified by the Viral Vector Core of the Penn Diabetes Center.
Cell culture.
3T3-L1 cells were maintained and differentiated as previously described (35). Fully differentiated 3T3-L1 adipocytes (day 10) were serum starved overnight in Dulbecco's modified Eagle's medium containing 0.2% fatty acid-free bovine serum albumin prior to resistin and/or insulin treatment in all experiments. 3T3-L1 adipocytes were infected with adenoviruses as described previously (21).
Immunoblotting and immunoprecipitation.
Cells were washed in ice-cold PBS and lysed in buffer (50 mM Tris, 150 mM NaCl, 10 mM EDTA,1% Triton X-100, 10% glycerol, 200 mM NaF, 4 mM Na orthovanadate-containing protease inhibitors, pH 7.5) (34). IRβ and IRS-1 were immunoprecipitated from cell lysates (200 μg) with 4 μg of antibody at 4°C overnight. Protein A-agarose was added to collect the immune complexes, and the antibody conjugates were washed three times with lysis buffer. All immune complexes were solubilized in Laemmli buffer and resolved by sodium dodecyl sulfate-polyacrylamide gel electrophoresis. Immunoblots of cell lysates and immunoprecipitated proteins were analyzed as described previously (35). As SOCS-3 is a labile protein, experiments detecting SOCS-3 by Western blotting were performed in the presence of a proteosome inhibitor, MG-132 (10 μm). Densitometric analysis of the immunoblots was performed with NIH Image software.
Assessment of in vivo PIP3 production.
One day postinfection with adenovirus expressing the GFP-Grp1-PH fusion protein (41), 3T3-L1 adipocytes were serum starved overnight followed by resistin treatment for 2 h prior to insulin stimulation (10 nM) for 5 min. Confocal laser microscopy was used to perform live cell imaging prior to and following insulin stimulation as previously described (41). Briefly, images were acquired with an Ultraview LCI Nipkow disk confocal microscope (Perkin-Elmer, Inc., Norwalk, Conn.) at 7.5-s intervals before and after the addition of insulin. Recruitment of GFP-Grp1-PH protein to the plasma membrane was quantitated with line intensity profiles drawn across each cell. These profiles were used to determine average pixel intensities at the plasma membrane and in the cytosol.
Measurement of PI3K Activity.
PI3K activity associated with IRS-1 was assayed as described previously (41). Briefly, IRS-1 immunoprecipitates were washed extensively followed by an incubation with phosphatidylinositol and γ-ATP. Lipids were extracted with chloroform-methanol (1:1) and resolved by thin-layer chromatography. The amount of PIP3 generated was then visualized and quantitated on the Storm PhosphorImager (Molecular Dynamics, Sunnyvale, Calif.).
RNA isolation and RT-qPCR analysis.
For reverse transcription-quantitative PCR (RT-qPCR) analysis, total RNA was isolated with RNeasy kits (QIAGEN, Inc., Valencia, Calif.). cDNA was synthesized from total RNA with the reagents and conditions of the Superscript RT II kit (Gibco BRL) following DNase treatment. This cDNA then served as a template for the real-time (Taqman) qPCR performed using the ABI Prism 7900 sequence detection system (Applied Biosystems, Foster City, Calif.). A housekeeping gene (36B4) was amplified in separate reaction to normalize results to starting amounts of RNA and efficiency of the RT reaction. The following primer and fluorigenic probe sets generated with Primer Express (Applied Biosystems) were used: SOCS-3 (forward primer, 5′-GCGGGCACCTTTCTTATCC-3′; reverse primer, 5′-TCCCCGACTGGGTCTTGAC-3′; and probe, 5′-6-FAM-CTCGGACCAGCGCCACTTCTTCA-TAMRA) and 36B4 (forward primer, 5′-CGGAGGAATCAGATGAGGATATG-3′; reverse primer, 5′-CAAATTAAGCAGGCTGACTTGGT-3′; and probe, 5′-6-FAM-CGGTCTCTTCGACTAATCCCGCCAAA-TAMRA). Validation experiments were performed such that both target and the housekeeping genes are amplified with similar efficiencies. For each condition, expression was quantified in triplicate as the number of cycles (CT) after which fluorescence exceeds the background threshold minus the CT for the housekeeping control (ΔCT). Relative expression levels were calculated by the formula 2−ΔΔCT, comparing resistin- and vehicle-treated samples.
Resistin administration to C57BL/6J mice.
Male C57BL/6J mice (Jackson Laboratories, Bar Harbor, Maine) aged 8 to 10 weeks were fasted for 12 h prior to an intraperitoneal (i.p.) administration of either vehicle (mock-purified conditioned medium, 300 μl) or resistin (1.5 μg in 300 μl). Epididymal adipose tissue and serum were harvested at the start of the experiment and at indicated time points following i.p. injection (2, 4, 6, and 8 h). Animal care and procedures were performed in accordance with guidelines and regulations of the Institutional Animal Care and Use Committee of the University of Pennsylvania. Mice were housed (four mice per cage) under 12-h light/dark cycles (lights on at 0600), at an ambient temperature of 23°C, with ad libitum access to food and water prior to experimentation. The chow diet (LabDiet5010) contained 23% protein, 4.5% fat, and 6% fiber.
Statistical analysis.
The mean, standard error of the mean (SEM), and significance by Student's t test were calculated with StatView statistical software (SAS, Cary, N.C.).
RESULTS
Resistin induces cellular insulin resistance in 3T3-L1 adipocytes.
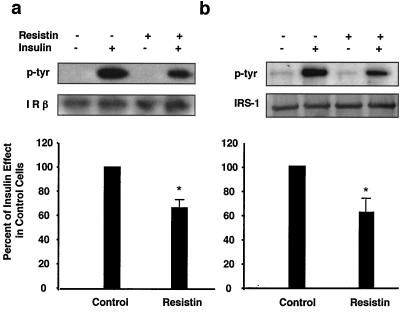
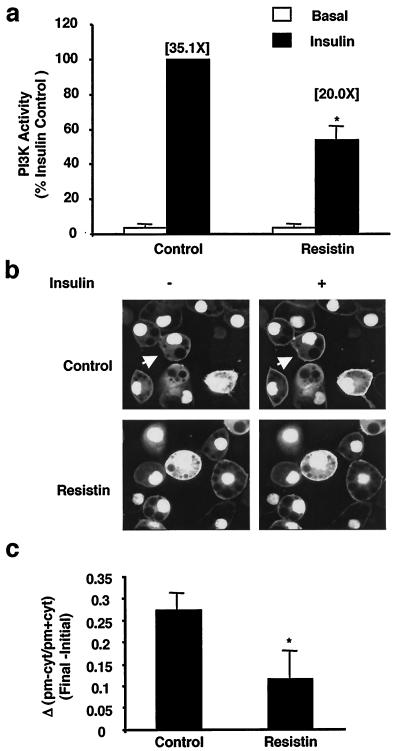
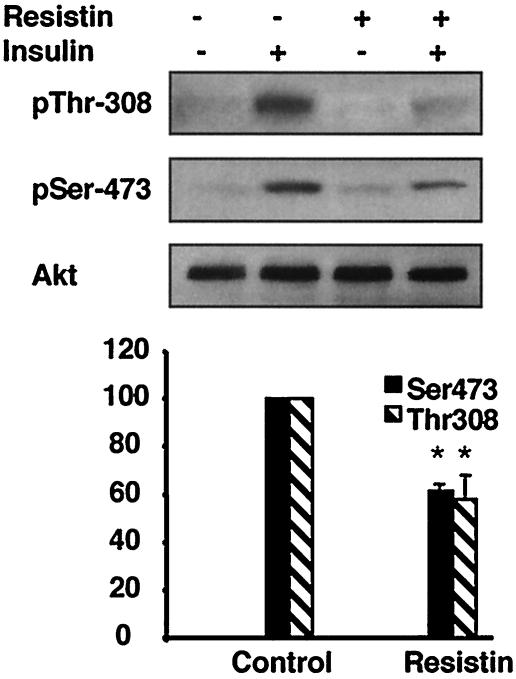
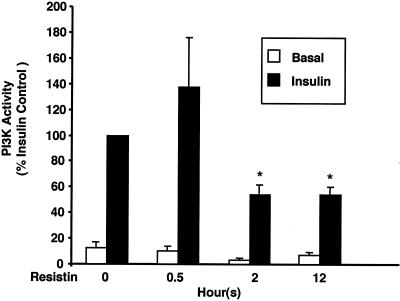
Previously, we have demonstrated that recombinant resistin decreased insulin stimulation of glucose uptake in 3T3-L1 adipocytes (35). To understand the mechanism by which resistin inhibits insulin action in this system, we examined the effects of resistin treatment on the proximal steps in insulin signaling. Resistin had no effect upon specific insulin binding to the cells (data not shown) but decreased insulin-stimulated tyrosine phosphorylation of the IR by ∼40% without affecting absolute levels of the IR (Fig. 1a). Correspondingly, phosphorylation of IRS-1 was attenuated by ∼40% by resistin treatment (Fig. 1b). Levels of IRS-1 protein were unaltered by acute resistin treatment (Fig. 1b). In parallel, IRS-1-associated PI3K was reduced by ∼50% in resistin-treated adipocytes (Fig. 2a). The cellular impact of this was assessed by measuring insulin-stimulated membrane accumulation of the PIP3 binding protein GFP-Grp1-PH (41) in live adipocytes (Fig. 2b; see Video S1 in the supplemental material). Consistent with the reduction in IRS-1-associated PI3K activity, resistin significantly attenuated the formation of PIP3 at the plasma membrane following insulin addition (Fig. 2c). Furthermore, the downstream activation of Akt by insulin was diminished by ∼40% by resistin (Fig. 3). Thus, exposure of cultured adipocytes to exogenous resistin induces a state of cellular insulin resistance at steps in the signaling cascade from IR phosphorylation to Akt activation.
FIG. 1.
Resistin inhibits insulin-stimulated tyrosine phosphorylation of IR and IRS-1 in 3T3-L1 adipocytes. 3T3-L1 adipocytes were treated with resistin (30 ng/ml) for 2 h prior to insulin stimulation (10 nM) for 2 min, and then phosphorylation of IR and IRS-1 and total protein levels were determined by immunoblot analysis. (a) Effects of resistin on IR tyrosine phosphorylation (p-tyr). *, P = 0.002. (b) Effects of resistin on IRS-1 tyrosine phosphorylation. *, P = 0.008. A representative Western blot and quantitation of three independent experiments are shown.
FIG. 2.
Resistin inhibits insulin-stimulated IRS-1-associated PI3K and PIP3 generation in living cells. 3T3-L1 adipocytes were treated with resistin (30 ng/ml) for 2 h prior to insulin stimulation (10 nM) for 2 min. (a) Effects of resistin on IRS-1-associated PI3K activity. The fold increase in PI3K activity relative to the basal levels is noted in parentheses. Data are represented as the percent of insulin effect in control cells and the average of three independent experiments. *, P < 0.05. (b) Effects of resistin on in vivo PIP3 accumulation at the plasma membrane. 3T3-L1 adipocytes were infected with an adenovirus expressing a PIP3 binding protein, GFP-GRP1-PH, 1 day prior to resistin and insulin treatment as in panel a. Fluorescence confocal laser microscopy was used to image the living cells before and after insulin stimulation (5 min). An arrow denotes a representative cell which upon insulin stimulation results in the accumulation of PIP3 at the plasma membrane in response to insulin. A movie of these experiments is available (see Video S1 in the supplemental material). (c) Quantitation of the change in fluorescence intensity of the plasma membrane (pm) relative to the cytosol (cyt) calculated as [(pm − cyt)/(pm + cyt)] following insulin stimulation for 5 min (Final) minus values prior to insulin stimulation (Initial). Data are expressed as the mean values of 10 cells ± SEM. *, P = 0.05.
FIG. 3.
Resistin decreases insulin-stimulated serine and threonine phosphorylation of Akt in 3T3-L1 adipocytes. 3T3-L1 adipocytes were treated with resistin (30 ng/ml) for 2 h prior to insulin stimulation (10 nM) for 2 min, and then phosphorylation of Akt on serine 473 (pSer-473) and threonine 307 (pThr-308) and total Akt protein levels were measured by immunoblot analysis. A representative Western blot and quantitation of three independent experiments are shown. *, P < 0.05.
Resistin treatment does not lead to serine phosphorylation of IRS-1.
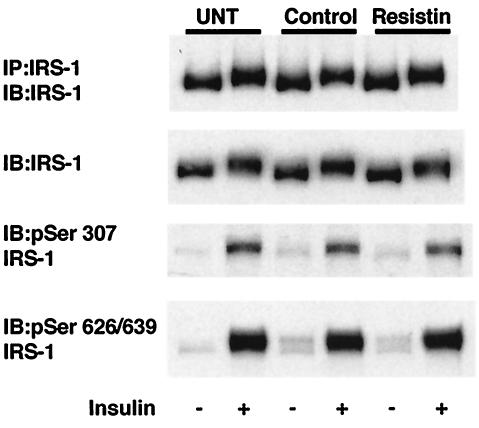
Serine phosphorylation of IRS-1 is a prominent mechanism underlying insulin resistance caused by such diverse modulators as free fatty acids (26), hyperosmotic stress (11), TNF-α (27), insulin-like growth factor 1 (IGF-1) (27), and insulin itself (27). We therefore assessed whether this mechanism underlies the effects of resistin. Insulin treatment led to a mobility shift of IRS-1 protein due to phosphorylation on tyrosine and serine/threonine residues, and specific phosphorylation of serine residues 307 and 629/639 as shown in Fig. 4 and described previously (22, 27). However, resistin treatment did not induce phosphorylation of IRS-1 on any of these serine residues, as indicated by the lack of mobility shift of IRS-1 or lack of band with the phosphospecific antibodies, nor did it amplify (or inhibit) the effect of insulin on serine phosphorylation of IRS-1 (Fig. 4).
FIG. 4.
Resistin treatment does not result in serine phosphorylation of IRS-1. Serum-starved 3T3-L1 adipocytes were either untreated (UNT) or treated with vehicle control or resistin (30 ng/ml) for 2 h prior to insulin stimulation for 15 min. Immunoblot (IB) analysis using IRS-1 and phosphospecific antibodies generated to specific serine residues (Ser 307 and 626/639) is shown. IP, immunoprecipitation.
Preincubation with resistin is required for inhibition of insulin action.
In the preceding studies, adipocytes were pretreated with resistin for 2 h. To further characterize resistin-induced insulin resistance, we determined the time course of the inhibitory effect of resistin on insulin stimulation of IRS-1-associated PI3K activity. As noted earlier, resistin decreased IRS-1-associated PI3K activity at 2 h, and the effect was maintained 12 h following resistin exposure (Fig. 5). However, a 30-min preincubation with resistin was insufficient to inhibit insulin action (Fig. 5).
FIG. 5.
Time course of resistin-induced insulin resistance. 3T3-L1 adipocytes were treated with resistin (30 ng/ml) for various times prior to insulin stimulation (10 nM) for 2 min. In vitro PI3K activity is represented as a percentage of the insulin effect in control cells and is the average of three independent experiments. *, P < 0.05 as compared to control cells treated with insulin.
Resistin activates SOCS-3 in a time- and dose-dependent manner.
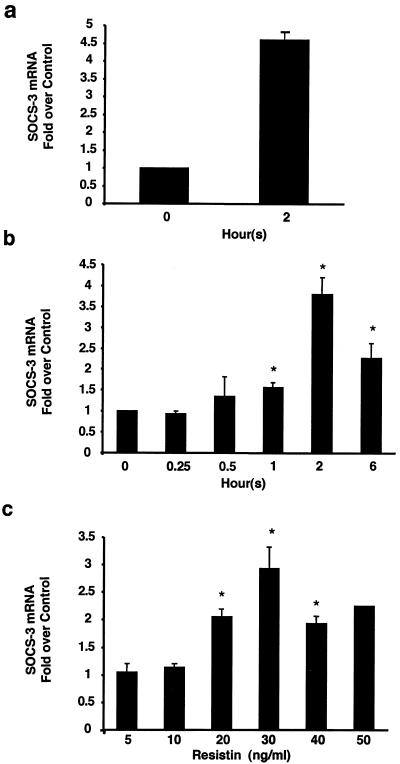
The inability of resistin to stimulate serine phosphorylation of IRS-1 and the requirement for preincubation of greater than 30 min led us to consider the SOCS family of proteins, whose transcriptional induction underlies resistance to signaling by cytokines (18) as well as hormones such as leptin (4, 5) and insulin (17, 23). In particular, SOCS-3 has been shown to inhibit insulin signaling (10). Remarkably, resistin dramatically induced adipocyte SOCS-3 gene expression (Fig. 6a). This effect was detectable at 30 to 60 min after resistin treatment, was maximal at 2 h, and was still significant, although waning at 6 h (Fig. 6b). SOCS-3 was induced by resistin in a dose-dependent manner, with a 50% effective dose (ED50) of approximately 20 ng/ml, which is close to the concentration of resistin in serum in lean mice. Thus, resistin activates SOCS-3 in a time- and dose-dependent manner.
FIG. 6.
Resistin activates SOCS-3 in a time- and dose-dependent manner in 3T3-L1 adipocytes. (a) Effect of 2-h treatment with resistin (30 ng/ml) on SOCS-3 mRNA relative to 36B4. (b) Time course of effects of resistin (30 ng/ml) on SOCS-3 mRNA. *, P < 0.02. (c) Dose response for SOCS-3 mRNA induction after resistin treatment for 2 h. The average values ± SEM of three to five independent experiments are shown. *, P < 0.05.
Resistin induces SOCS-3 association with the insulin receptor.
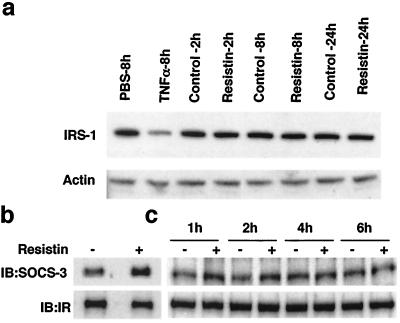
SOCS-3 negatively regulates insulin signaling by two distinct mechanisms. One mechanism involves SOCS-3 binding to IRS-1 via its “SOCS box,” thereby targeting the protein for degradation by the 26S proteasome (28). We confirmed that IRS-1 protein levels were markedly reduced following TNF-α treatment of 3T3-L1 cells for 8 h (Fig. 7a). However, treatment with resistin for up to 24 h had no effect on IRS-1 protein levels (Fig. 7a). SOCS-3 has been also shown to physically interact with the IR via its SH2 domain (10). Consistent with this, increased SOCS-3 protein was associated with the IR in adipocytes treated with resistin for 2 h (Fig. 7b). Interaction between IRS-1 and SOCS-3 was not observed under these basal conditions (data not shown). The enhanced association between IR and SOCS-3 was noted after 1 and 2 h of resistin treatment and returned to near baseline by 4 h (Fig. 7c), a time course that was generally consistent with the induction of SOCS-3 by resistin.
FIG. 7.
SOCS-3 induced by resistin associates with the IR. 3T3-L1 adipocytes were treated with resistin (30 ng/ml) or TNF-α (30 ng/ml) for the indicated times. (a) Treatment with TNF-α, but not resistin, reduces IRS-1 protein levels. Actin immunoblot analysis was used as a loading control. (b) Resistin stimulates IR association of SOCS-3. Cell extracts were immunoblotted (IB) for IR and SOCS-3 following immunoprecipitation (IP) of IR. (c) Time course of resistin enhancement of IR association with SOCS-3.
Resistin induces SOCS-3 in adipose tissue in vivo.
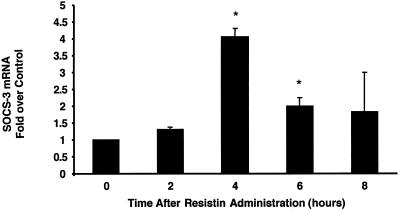
We next determined whether resistin could activate SOCS-3 in adipose tissue in vivo by administering resistin i.p. to male C57/LB6J mice. The dose of resistin used in this experiment (1.5 μg) raises circulating levels by two to three times the normal level (3), comparable to the increase in serum resistin concentration in obese mice (25, 35). SOCS-3 mRNA in epididymal white adipose tissue was markedly induced following administration of resistin, with maximal activation observed at 4 h (Fig. 8). This time course was consistent with serum resistin levels that peaked 2 h postinjection, returning to baseline by 8 h (data not shown). Thus, resistin induces SOCS-3 in cultured adipocytes as well as adipose tissue in vivo.
FIG. 8.
Resistin activates SOCS-3 in vivo. Resistin (1.5 μg) or vehicle was administered i.p. to male C57BL/6J mice following an overnight fast, epididymal adipose tissue was isolated at the indicated time points, and SOCS-3 and 36B4 mRNA was measured by qPCR. SOCS-3 expression was normalized to that of 36B4, and the data shown are the fold activation in resistin-treated mice relative to vehicle-treated mice. The average values ± SEM of three independent experiments are shown. *, P < 0.04 compared to time zero.
Loss of SOCS function impairs resistin antagonism of insulin action.
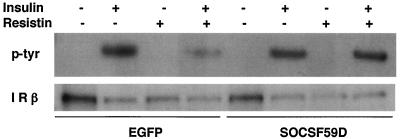
To address the role of SOCS-3 induction in resistin action, the effects of a mutant SOCS protein (SOCSF59D) that has been previously demonstrated to function as a dominant negative for SOCS-1 and SOCS-3 (12, 38) were studied with adenovirus to express the protein (or EGFP control) in mature 3T3-L1 adipocytes. SOCSF59D had little effect on insulin-induced IR phosphorylation but almost completely prevented resistin from impairing this action of insulin (Fig. 9). This result implicates SOCS as a mediator of resistin antagonism of insulin action in adipocytes.
FIG. 9.
Dominant-negative SOCS protein prevents resistin antagonism of insulin signaling in adipocytes. 3T3-L1 adipocytes were infected with adenovirus expressing EGFP or SOCSF59D and then treated with resistin (30 ng/ml) for 2 h prior to insulin stimulation (10 nM) for 2 min, and then phosphorylation of IR and total IR protein levels were determined by immunoblot analysis.
DISCUSSION
We have shown that resistin inhibits multiple steps involved in insulin signaling in 3T3-L1 adipocytes. These results provide a molecular basis for the inhibition of insulin-stimulated glucose transport in these cells. The mechanism by which resistin signals is not established, but we show that resistin induces SOCS-3 in a time- and dose-dependent manner in cultured adipocytes as well as in adipose tissue and that inhibition of SOCS function impairs resistin action. These results suggest that SOCS-3 may be a cellular mediator of the ability of resistin to antagonize insulin action in adipocytes.
Studies of rats treated with exogenous resistin (24) as well as mice lacking resistin (3) have implicated the liver as an important physiological target of resistin. We have observed activation of SOCS-3 in liver after acute administration of resistin, although the magnitude of the effect is less than that in adipose tissue (data not shown). In addition to its effects on the liver, resistin has been demonstrated to inhibit glucose uptake in L6 skeletal muscle cells (19) as well as in adipocytes (35). Resistin/ADSF has also been shown to inhibit adipocyte differentiation (15, 16). The data presented here provide further support for the hypothesis that adipose tissue is a target of resistin action.
The effects of resistin on the insulin signaling pathway occur at the level of the IR, as evidenced by decreased insulin-dependent phosphorylation of the IR and comparable reductions in downstream signals, including tyrosine phosphorylation of IRS-1, IRS-1-associated PI3K activity, PIP3 generation, and activation of Akt. The effects of ∼50% reduction in Akt activation may be context dependent since while Akt2 heterozygote-null mice are not glucose intolerant (7), a 50% reduction in Akt1 dramatically worsens the metabolic defects in Akt2-null mice (6).
The inhibitory actions of resistin on the insulin signaling pathway are not immediate and require a preincubation of at least 30 min. Consistent with this, we did not observe serine phosphorylation of IRS-1 in response to resistin. Importantly, the transcriptional induction of SOCS-3 corresponds with the time course of resistin action. Although other cytokines induce SOCS-3 via phosphorylation of STAT transcription factors, we did not observe any increase in phosphorylation of STAT1, STAT3, and STAT5 nor phosphorylation of p42/44 mitogen-activated protein kinase (MAPK), JNK, and p38 MAPK in response to resistin (data not shown). Studies are in progress to determine the transcriptional mediator of SOCS-3 activation by resistin.
SOCS-3 has been implicated as a mediator by which insulin negatively regulates its own signaling cascade. In 3T3-L1 cells, insulin induces SOCS-3 mRNA within 30 min, with the peak occurring several hours later (10). Several complementary mechanisms have been proposed to explain SOCS-3 inhibition of insulin signaling. Overexpressed SOCS-3 has been convincingly shown to target IRS-1 for proteasomal degradation in 293T cells (28), although in other systems overexpression of SOCS-3 decreased insulin-stimulated IRS-1 phosphorylation without reducing IRS levels (8, 14). Significantly, SOCS-3 binds to phosphorylated tyrosine 960 of the IR in vitro (10) and in cells (10, 20), and inhibits IR autophosphorylation (31). We have found that resistin attenuates IR phosphorylation and increases its association with SOCS-3 and that inhibition of SOCS function prevents resistin from exerting its inhibition of IR autophosphorylation. These data strongly suggest that induction of SOCS-3 is critical for the inhibition of insulin signaling by resistin. The induction of SOCS-3 by resistin is the first molecular and cellular effect of resistin yet described that is independent of the presence of insulin. Thus, although the receptor for resistin is unknown, resistin is likely to signal in a cytokine-like fashion.
SOCS-3 mRNA levels are elevated in white adipose tissue of obese mice (9, 32, 39) as well as rats (40). Serum resistin levels are increased in obese and diabetic mice (35) and possibly in humans (2, 8, 33, 42, 44). Isolated resistin deficiency or excess does not significantly alter steady-state SOCS-3 levels in mouse adipose tissue (data not shown), but several other cytokines that circulate at high levels in obesity, including TNF-α and IL-6, as well as insulin, all contribute to the net increase in SOCS-3. Our data suggest that resistin is likely to collaborate with insulin as well as these other obesity-induced cytokines that are characteristic of the inflammatory milieu of obesity in elevating tissue SOCS-3 levels and contributing to systemic insulin resistance.
Supplementary Material
Acknowledgments
We thank Alessandra Tosolini-Borst and Nicole Dudley-Rucker for technical assistance in producing recombinant mouse proteins and Patricia Chui for performing insulin binding assays. IRS-1 phosphospecific antibodies were kindly provided by Roberto Polakiewicz from Cell Signaling. The SOCS F59D cDNA was kindly provided by Irene Nowak and Robert Mooney from the University of Rochester.
This work was supported by grants to C.M.S. (DK K01 DK59896 from NIH and ADA RA117 from the American Diabetes Association), M.A.L. (RO1 DK49780 and PO1 DK49210 from NIH), M.J.B. (RO1 DK56886 from NIH), and the Viral Vector Core of the Penn Diabetes Center (DK19525 from NIH). E.L.W. was supported by a Howard Hughes Predoctoral Fellowship for the Biological Sciences.
Footnotes
Supplemental material for this article may be found at http://mcb.asm.org/.
REFERENCES
- 1.Aguirre, V., E. D. Werner, J. Giraud, Y. H. Lee, S. E. Shoelson, and M. F. White. 2002. Phosphorylation of Ser307 in insulin receptor substrate-1 blocks interactions with the insulin receptor and inhibits insulin action. J. Biol. Chem. 277:1531-1537. [DOI] [PubMed] [Google Scholar]
- 2.Azuma, K., F. Katsukawa, S. Oguchi, M. Murata, H. Yamazaki, A. Shimada, and T. Saruta. 2003. Correlation between serum resistin level and adiposity in obese individuals. Obes. Res. 11:997-1001. [DOI] [PubMed] [Google Scholar]
- 3.Banerjee, R. R., S. M. Rangwala, J. S. Shapiro, A. S. Rich, B. Rhoades, Y. Qi, J. Wang, M. W. Rajala, A. Pocai, P. E. Scherer, C. M. Steppan, R. S. Ahima, S. Obici, L. Rossetti, and M. A. Lazar. 2004. Regulation of fasted blood glucose by resistin. Science 303:1195-1198. [DOI] [PubMed] [Google Scholar]
- 4.Bjorbaek, C., K. El-Haschimi, J. D. Frantz, and J. S. Flier. 1999. The role of SOCS-3 in leptin signaling and leptin resistance. J. Biol. Chem. 274:30059-30065. [DOI] [PubMed] [Google Scholar]
- 5.Bjorbaek, C., J. K. Elmquist, J. D. Frantz, S. E. Shoelson, and J. S. Flier. 1998. Identification of SOCS-3 as a potential mediator of central leptin resistance. Mol. Cell 1:619-625. [DOI] [PubMed] [Google Scholar]
- 6.Cho, H., and M. J. Birnbaum. Unpublished results.
- 7.Cho, H., J. Mu, J. K. Kim, J. L. Thorvaldsen, Q. Chu, E. B. Crenshaw III, K. H. Kaestner, M. S. Bartolomei, G. I. Shulman, and M. J. Birnbaum. 2001. Insulin resistance and a diabetes mellitus-like syndrome in mice lacking the protein kinase Akt2 (PKB beta). Science 292:1728-1731. [DOI] [PubMed] [Google Scholar]
- 8.Degawa-Yamauchi, M., J. E. Bovenkerk, B. E. Juliar, W. Watson, K. Kerr, R. Jones, Q. Zhu, and R. V. Considine. 2003. Serum resistin (FIZZ3) protein is increased in obese humans. J. Clin. Endocrinol. Metab. 88:5452-5455. [DOI] [PubMed] [Google Scholar]
- 9.Emanuelli, B., P. Peraldi, C. Filloux, C. Chavey, K. Freidinger, D. J. Hilton, G. S. Hotamisligil, and E. Van Obberghen. 2001. SOCS-3 inhibits insulin signaling and is up-regulated in response to tumor necrosis factor-alpha in the adipose tissue of obese mice. J. Biol. Chem. 276:47944-47949. [DOI] [PubMed] [Google Scholar]
- 10.Emanuelli, B., P. Peraldi, C. Filloux, D. Sawka-Verhelle, D. Hilton, and E. Van Obberghen. 2000. SOCS-3 is an insulin-induced negative regulator of insulin signaling. J. Biol. Chem. 275:15985-15991. [DOI] [PubMed] [Google Scholar]
- 11.Gual, P., T. Gonzalez, T. Gremeaux, R. Barres, Y. Le Marchand-Brustel, and J. F. Tanti. 2003. Hyperosmotic stress inhibits insulin receptor substrate-1 function by distinct mechanisms in 3T3-L1 adipocytes. J. Biol. Chem. 278:26550-26557. [DOI] [PubMed] [Google Scholar]
- 12.Hanada, T., T. Yoshida, I. Kinjyo, S. Minoguchi, H. Yasukawa, S. Kato, H. Mimata, Y. Nomura, Y. Seki, M. Kubo, and A. Yoshimura. 2001. A mutant form of JAB/SOCS1 augments the cytokine-induced JAK/STAT pathway by accelerating degradation of wild-type JAB/CIS family proteins through the SOCS-box. J. Biol. Chem. 276:40746-40754. [DOI] [PubMed] [Google Scholar]
- 13.Holcomb, I. N., R. C. Kabakoff, B. Chan, T. W. Baker, A. Gurney, W. Henzel, C. Nelson, H. B. Lowman, B. D. Wright, N. J. Skelton, G. D. Frantz, D. B. Tumas, F. V. Peale, Jr., D. L. Shelton, and C. C. Hebert. 2000. FIZZ1, a novel cysteine-rich secreted protein associated with pulmonary inflammation, defines a new gene family. EMBO J. 19:4046-4055. [DOI] [PMC free article] [PubMed] [Google Scholar]
- 14.Kawazoe, Y., T. Naka, M. Fujimoto, H. Kohzaki, Y. Morita, M. Narazaki, K. Okumura, H. Saitoh, R. Nakagawa, Y. Uchiyama, S. Akira, and T. Kishimoto. 2001. Signal transducer and activator of transcription (STAT)-induced STAT inhibitor 1 (SSI-1)/suppressor of cytokine signaling 1 (SOCS1) inhibits insulin signal transduction pathway through modulating insulin receptor substrate 1 (IRS-1) phosphorylation. J. Exp. Med. 193:263-269. [DOI] [PMC free article] [PubMed] [Google Scholar]
- 15.Kim, K. H., K. Lee, Y. S. Moon, and H. S. Sul. 2001. A cysteine-rich adipose tissue-specific secretory factor inhibits adipocyte differentiation. J. Biol. Chem. 276:11252-11256. [DOI] [PubMed] [Google Scholar]
- 16.Kim, K. H., L. Zhao, Y. Moon, C. Kang, and H. S. Sul. 2004. Dominant inhibitory adipocyte-specific secretory factor (ADSF)/resistin enhances adipogenesis and improves insulin sensitivity. Proc. Natl. Acad. Sci. USA 101:6780-6785. [DOI] [PMC free article] [PubMed] [Google Scholar]
- 17.Krebs, D. L., and D. J. Hilton. 11 February 2003, posting date. A new role for SOCS in insulin action. Suppressor of cytokine signaling. Sci. STKE 2003:PE6. [Online.] http://stke.sciencemag.org. [DOI] [PubMed]
- 18.Krebs, D. L., and D. J. Hilton. 2001. SOCS proteins: negative regulators of cytokine signaling. Stem Cells 19:378-387. [DOI] [PubMed] [Google Scholar]
- 19.Moon, B., J. J. Kwan, N. Duddy, G. Sweeney, and N. Begum. 2003. Resistin inhibits glucose uptake in L6 skeletal muscle cells independent of changes in insulin signaling components and Glut-4 translocation. Am. J. Physiol. Endocrinol. Metab. 285:E105-E115. [DOI] [PubMed] [Google Scholar]
- 20.Mooney, R. A., J. Senn, S. Cameron, N. Inamdar, L. M. Boivin, Y. Shang, and R. W. Furlanetto. 2001. Suppressors of cytokine signaling-1 and -6 associate with and inhibit the insulin receptor. A potential mechanism for cytokine-mediated insulin resistance. J. Biol. Chem. 276:25889-25893. [DOI] [PubMed] [Google Scholar]
- 21.Orlicky, D. J., and J. Schaack. 2001. Adenovirus transduction of 3T3-L1 cells. J. Lipid Res. 42:460-466. [PubMed] [Google Scholar]
- 22.Ozes, O. N., H. Akca, L. D. Mayo, J. A. Gustin, T. Maehama, J. E. Dixon, and D. B. Donner. 2001. A phosphatidylinositol 3-kinase/Akt/mTOR pathway mediates and PTEN antagonizes tumor necrosis factor inhibition of insulin signaling through insulin receptor substrate-1. Proc. Natl. Acad. Sci. USA 98:4640-4645. [DOI] [PMC free article] [PubMed] [Google Scholar]
- 23.Pirola, L., A. M. Johnston, and E. Van Obberghen. 2003. Modulators of insulin action and their role in insulin resistance. Int. J. Obes. Relat. Metab. Disord. 27(Suppl. 3):S61-S64. [DOI] [PubMed] [Google Scholar]
- 24.Rajala, M. W., S. Obici, P. E. Scherer, and L. Rossetti. 2003. Adipose-derived resistin and gut-derived resistin-like molecule-beta selectively impair insulin action on glucose production. J. Clin. Investig. 111:225-230. [DOI] [PMC free article] [PubMed] [Google Scholar]
- 25.Rajala, M. W., Y. Qi, H. R. Patel, N. Takahashi, R. R. Banerjee, U. B. Pajvani, M. K. Sinha, R. L. Gingerich, P. E. Scherer, and R. S. Ahima. 2004. Regulation of resistin expression and circulating levels in obesity, diabetes, and fasting. Diabetes 53:1671-1679. [DOI] [PubMed] [Google Scholar]
- 26.Roden, M., T. B. Price, G. Perseghin, K. F. Petersen, D. L. Rothman, G. W. Cline, and G. I. Shulman. 1996. Mechanism of free fatty acid-induced insulin resistance in humans. J. Clin. Investig. 97:2859-2865. [DOI] [PMC free article] [PubMed] [Google Scholar]
- 27.Rui, L., V. Aguirre, J. K. Kim, G. I. Shulman, A. Lee, A. Corbould, A. Dunaif, and M. F. White. 2001. Insulin/IGF-1 and TNF-alpha stimulate phosphorylation of IRS-1 at inhibitory Ser307 via distinct pathways. J. Clin. Investig. 107:181-189. [DOI] [PMC free article] [PubMed] [Google Scholar]
- 28.Rui, L., M. Yuan, D. Frantz, S. Shoelson, and M. F. White. 2002. SOCS-1 and SOCS-3 block insulin signaling by ubiquitin-mediated degradation of IRS1 and IRS2. J. Biol. Chem. 277:42394-42398. [DOI] [PubMed] [Google Scholar]
- 29.Saltiel, A. R., and C. R. Kahn. 2001. Insulin signalling and the regulation of glucose and lipid metabolism. Nature 414:799-806. [DOI] [PubMed] [Google Scholar]
- 30.Satoh, H., M. T. Audrey Nguyen, P. D. G. Miles, T. Imamura, I. Usui, and J. M. Olefsky. 2003. Am. Diabetes Assoc. 63rd Sci. Sessions, New Orleans, La.
- 31.Senn, J. J., P. J. Klover, I. A. Nowak, T. A. Zimmer, L. G. Koniaris, R. W. Furlanetto, and R. A. Mooney. 2003. Suppressor of cytokine signaling-3 (SOCS-3): a potential mediator of interleukin-6 dependent insulin resistance in hepatocytes. J. Biol. Chem. 278:13740-13746. (First published 30 January 2003; doi:10.1074/jbc.M210689200.) [DOI] [PubMed] [Google Scholar]
- 32.Shi, H., I. Tzameli, C. Bjorbaek, and J. S. Flier. 2004. Suppressor of cytokine signaling 3 is a physiological regulator of adipocyte insulin signaling. J. Biol. Chem. 279:34733-34740. [DOI] [PubMed] [Google Scholar]
- 33.Silha, J. V., and L. J. Murphy. 2004. Serum resistin (FIZZ3) protein is increased in obese humans. J. Clin. Endocrinol. Metab. 89:1977. (Author reply, 1977-1978.) [DOI] [PubMed] [Google Scholar]
- 34.Staubs, P. A., J. G. Nelson, D. R. Reichart, and J. M. Olefsky. 1998. Platelet-derived growth factor inhibits insulin stimulation of insulin receptor substrate-1-associated phosphatidylinositol 3-kinase in 3T3-L1 adipocytes without affecting glucose transport. J. Biol. Chem. 273:25139-25147. [DOI] [PubMed] [Google Scholar]
- 35.Steppan, C. M., S. T. Bailey, S. Bhat, E. J. Brown, R. R. Banerjee, C. M. Wright, H. R. Patel, R. S. Ahima, and M. A. Lazar. 2001. The hormone resistin links obesity to diabetes. Nature 409:307-312. [DOI] [PubMed] [Google Scholar]
- 36.Steppan, C. M., and M. A. Lazar. 2002. Resistin and obesity-associated insulin resistance. Trends Endocrinol. Metab. 13:18-23. [DOI] [PubMed] [Google Scholar]
- 37.Summers, S. A., E. L. Whiteman, and M. J. Birnbaum. 2000. Insulin signaling in the adipocyte. Int. J. Obes. Relat. Metab. Disord. 24(Suppl. 4):S67-S70. [DOI] [PubMed] [Google Scholar]
- 38.Suzuki, A., T. Hanada, K. Mitsuyama, T. Yoshida, S. Kamizono, T. Hoshino, M. Kubo, A. Yamashita, M. Okabe, K. Takeda, S. Akira, S. Matsumoto, A. Toyonaga, M. Sata, and A. Yoshimura. 2001. CIS3/SOCS3/SSI3 plays a negative regulatory role in STAT3 activation and intestinal inflammation. J. Exp Med. 193:471-481. [DOI] [PMC free article] [PubMed] [Google Scholar]
- 39.Ueki, K., T. Kondo, and C. R. Kahn. 2004. Suppressor of cytokine signaling 1 (SOCS-1) and SOCS-3 cause insulin resistance through inhibition of tyrosine phosphorylation of insulin receptor substrate proteins by discrete mechanisms. Mol. Cell. Biol. 24:5434-5446. [DOI] [PMC free article] [PubMed] [Google Scholar]
- 40.Wang, Z., Y. T. Zhou, T. Kakuma, Y. Lee, S. P. Kalra, P. S. Kalra, W. Pan, and R. H. Unger. 2000. Leptin resistance of adipocytes in obesity: role of suppressors of cytokine signaling. Biochem. Biophys. Res. Commun. 277:20-26. [DOI] [PubMed] [Google Scholar]
- 41.Whiteman, E. L., J. J. Chen, and M. J. Birnbaum. 2003. Platelet-derived growth factor (PDGF) stimulates glucose transport in 3T3-L1 adipocytes overexpressing PDGF receptor by a pathway independent of insulin receptor substrates. Endocrinology 144:3811-3820. [DOI] [PubMed] [Google Scholar]
- 42.Youn, B. S., K. Y. Yu, H. J. Park, N. S. Lee, S. S. Min, M. Y. Youn, Y. M. Cho, Y. J. Park, S. Y. Kim, H. K. Lee, and K. S. Park. 2004. Plasma resistin concentrations measured by enzyme-linked immunosorbent assay using a newly developed monoclonal antibody are elevated in individuals with type 2 diabetes mellitus. J. Clin. Endocrinol. Metab. 89:150-156. [DOI] [PubMed] [Google Scholar]
- 43.Yu, C., Y. Chen, G. W. Cline, D. Zhang, H. Zong, Y. Wang, R. Bergeron, J. K. Kim, S. W. Cushman, G. J. Cooney, B. Atcheson, M. F. White, E. W. Kraegen, and G. I. Shulman. 2002. Mechanism by which fatty acids inhibit insulin activation of insulin receptor substrate-1 (IRS-1)-associated phosphatidylinositol 3-kinase activity in muscle. J. Biol. Chem. 277:50230-50236. [DOI] [PubMed] [Google Scholar]
- 44.Zhang, J. L., Y. W. Qin, X. Zheng, J. L. Qiu, and D. J. Zou. 2003. Serum resistin level in essential hypertension patients with different glucose tolerance. Diabetic Med. 20:828-831. [DOI] [PubMed] [Google Scholar]
Associated Data
This section collects any data citations, data availability statements, or supplementary materials included in this article.


