Abstract
Background
The growing obesity pandemic is the leading cause for increasing prevalence of nonalcoholic fatty liver disease (NAFLD) in children. Histopathological evaluation of the liver remains the gold standard for NAFLD diagnosis, but it is an invasive procedure with a low but real risk of morbidity and mortality. The current study evaluated circulating chemerin and adiponectin as possible noninvasive diagnostic markers for NAFLD in obese non-diabetic children.
Methods
A prospective case-control study was conducted, which included 101 obese children with biopsy-proven NAFLD and 57 age- and sex-matched controls. The overall mean age of the children was 10.08±3.12 years. All underwent a full clinical assessment, routine laboratory investigation, and abdominal ultrasound. Homeostatic model assessment-insulin resistance was calculated and circulating chemerin and adiponectin were evaluated using ELISA.
Results
Elevated serum chemerin and decreased serum adiponectin were significantly associated with an increased likelihood of exhibiting NAFLD. Receiver operator characteristic curve analysis for differentiation of NAFLD patients from those in the control group demonstrated that chemerin, at a cutoff value of 186.7 ng/mL, yielded a sensitivity and specificity of 56.44% and 87.72% respectively (P<0.001), whereas adiponectin, at a cutoff value of 2.4 µg/mL, had a sensitivity and specificity of 74.26% and 3.51% respectively (P<0.001). Furthermore, body mass index, aspartate transaminase, alanine transaminase, triglycerides, and gamma-glutamyl transferase had significant positive correlations with chemerin and significant negative correlations with adiponectin (P≤0.001).
Conclusion
Circulating chemerin and adiponectin could serve as simple noninvasive diagnostic markers for NAFLD in non-diabetic obese children.
Keywords: Diagnosis, noninvasive, nonalcoholic fatty liver disease, obese children
Introduction
Nonalcoholic fatty liver disease (NAFLD) has become the most common cause of chronic hepatitis and liver-related morbidity and mortality worldwide. The histopathological features of NAFLD include steatohepatitis and fibrosis, with an increased risk of progression to end-stage liver disease, hepatocellular carcinoma (HCC), and indication for liver transplantation [1,2].
Childhood obesity is currently considered a global pandemic and represents one of the most serious public health problems of the 21st century [3]. The estimated prevalence of NAFLD in the child population is about 10%, reaching 40-70% among obese children [4]. Frequently associated with a low-grade systemic inflammatory status, obesity is the most common risk factor for pediatric NAFLD [5]. A low-grade systemic inflammatory status influences lipid metabolism, leading to changes in adipokine production by adipose tissue and subsequent interference with normal insulin function and development of insulin resistance [6,7], which represents the first “hit” in the NAFLD pathogenesis. The subsequent release of proinflammatory cytokines could cause a second hit, leading to nonalcoholic steatohepatitis (NASH) [8].
Early diagnosis and proper management of NAFLD may reduce its liver-related morbidities [9]. For the moment, histopathological evaluation of liver biopsy samples remains the gold standard for accurate diagnosis of NAFLD. However, being invasive, costly, and carrying a possible risk of sampling errors and serious complications [10], it would be desirable if biopsy could be replaced by noninvasive and affordable biomarkers for a precise diagnosis of NAFLD.
Serum concentrations of classic adipokines (e.g. adiponectin) are altered in NAFLD patients. Recently, the role of novel adipokines (e.g. chemerin) in the NAFLD pathogenesis has emerged. However, studies on serum concentrations of such adipokines in obese children with NAFLD are lacking [4].
The current study aimed to evaluate circulating adipokines (chemerin and adiponectin) as noninvasive biomarkers for NAFLD diagnosis in obese non-diabetic children and to explore their possible correlation with histopathological features of the disease.
Patients and methods
Research design and study population
This was a case-control study using prospectively collected data from 101 biopsy-proven NAFLD children below the age of 18, as well as 57 age- and gender-matched healthy volunteers, consecutively recruited from the outpatient clinic of pediatric department, Faculty of Medicine, Banha University, during the period from January to June 2016. Patients with chronic viral hepatitis due to virus C or B, chronic alcohol intake, autoimmune hepatitis, Wilson’s disease, α1 antitrypsin deficiency, significant endocrinal disease, drug toxicity and those on total parenteral nutrition were excluded. Additionally, diabetic children and those taking drugs affecting lipid or carbohydrate metabolism were not allowed to enroll.
The study was conducted according to the guidelines laid down in the Declaration of Helsinki 1975, after receiving approval from the clinical research ethics committee of Faculty of Medicine, Banha University. Written subject assent and parental consent were obtained for all patients prior to their enrollment into the study.
Outcomes
The primary outcomes of the current study were as follows: establishing the usefulness of serum chemerin and serum adiponectin as noninvasive diagnostic biomarkers for NAFLD in obese non-diabetic children, setting a cutoff value of those markers at which NAFLD diagnosis could be highly suspected, and exploring the potential correlation between serum concentrations of candidate biomarkers and histopathological changes of NAFLD.
Participants’ assessment
Children were defined as obese if their body mass index (BMI) was equal to or above the 95th percentile [11]. Patients suspected to have NAFLD on the basis of clinically evident hepatomegaly, elevated hepatic necro-inflammatory markers (aspartate transaminase [AST] and alanine transaminase [ALT]), or fatty liver changes on abdominal ultrasound, had their diagnosis of NAFLD confirmed by liver biopsy. An ultrasound-guided liver biopsy was performed by a single expert hepatologist in all patients, after they had provided informed consent and when platelet count and coagulation profile were within an acceptable range, using an automatic true-cut (18G) needle. To be satisfactory, a specimen had to be at least 10 mm in length and contain at least 5 complete portal tracts. Biopsy specimens were stained with hematoxylin-eosin and silver.
The histopathological interpretation of the liver biopsy was determined according to the NAFLD activity score (NAS) [12], which includes individual scores for grades of hepatic steatosis, lobular inflammation, and hepatocellular ballooning, as well as the staging of hepatic fibrosis. The fibrosis score ranges from 0 (absence of fibrosis) to 4 (probable or definite cirrhosis). In particular, stage 1 is further subdivided into stage 1a (delicate perisinusoidal zone 3 fibrosis), 1b (dense perisinusoidal zone 3 fibrosis), and 1c (portal fibrosis only), the latter referring to the pattern of fibrosis sometimes seen in severely obese and in pediatric NAFLD patients.
NAS score ranges from 0 to 8, with a score of 1 or 2 corresponding to definitely not NASH, while a NAS score 5-8 is suggestive of definite NASH. Scores of 3 and 4 are considered borderline for NASH.
All participants underwent a full clinical examination, abdominal ultrasound, BMI measurement (weight in kg/height in m2), routine laboratory investigations (AST, ALT, alkaline phosphatase, γ-glutamyl transferase [GGT], albumin, and bilirubin) using conventional automated analyzers in the biochemistry laboratory at NTMR reference lab. All biochemical analyses were performed in a “blinded” manner.
Blood samples and biomarker qualification
Venous blood samples were collected from all study participants after an overnight 12-h fast to measure fasting blood glucose, fasting insulin, total cholesterol, and triglycerides. Insulin resistance was determined by the homeostatic model assessment of insulin resistance (HOMA-IR) equation [13]:
Fasting insulin (μU/mL) × Fasting glucose (mg/dL)/405
Fasting serum chemerin was measured using commercial ELISA kits (BioVender). The intra- and inter-assay coefficients of variation of chemerin ranged from 5.1% to 7.0% and 6.9% to 8.3% respectively. All assays were conducted according to the manufacturer’s instructions.
Fasting serum adiponectin levels were measured in duplicate using an enzyme-linked immunosorbent assay (ELISA) kit (Quintikine) obtained from R&D Systems (Wiesbaden-Nordenstadt, Germany). Each serum sample was diluted 100-fold.
Statistical analysis
Data were entered, validated, and analyzed using STATA 14 software. Patients’ demographic and routine laboratory data were expressed as number (percent) for categorical variables and as mean (±standard deviation [SD]) for continuous variables. Continuous variables were tested for normality using histograms and sktest. Those variables with a P-value <0.05 on Skewness-Kurtosis test were considered not to be normally distributed. The Spearman correlation coefficient (r) was used for binary correlations. Comparisons between cases with NAFLD and controls were made using Student’s t-test or the Mann-Whitney test, as appropriate. The chi-square test was used for comparisons of categorical data. Associations between clinical characteristics, laboratory markers, and NAFLD diagnosis were investigated using univariate and multivariate logistic regression models. Data were reported as odds ratios (OR) with 95% confidence intervals (95%CI). The diagnostic performance of chemerin and adiponectin in the prediction of NAFLD was evaluated using receiver operator characteristic (ROC) curves. The area under the ROC curve, sensitivity, specificity, positive predictive value, negative predictive value and the 95%CI were used as indexes of accuracy. All statistical analyses were based on two-sided hypothesis tests with a significance level of P<0.05.
Results
Characteristics of the study population
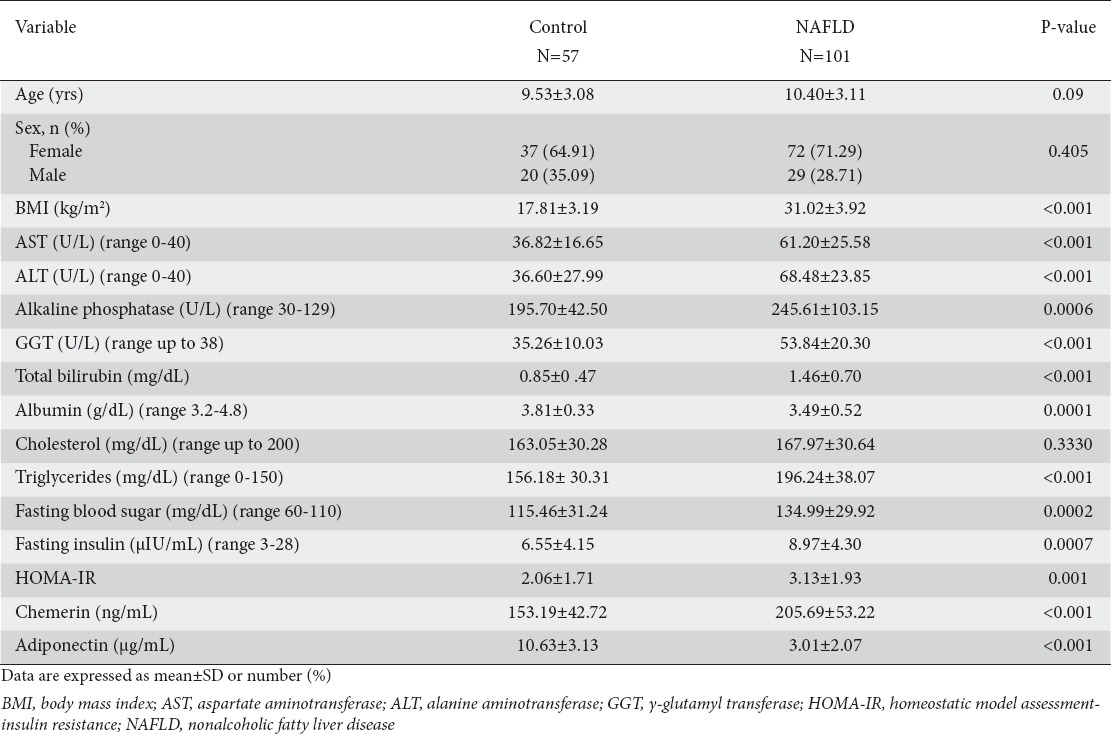
One hundred one children with biopsy-proven NAFLD were evaluated in the current study, as well as 57 normal age- and sex-matched controls. Circulating chemerin levels were significantly higher in NAFLD children compared with normal controls (205.69±53.22 vs. 153.19±42.72 ng/mL; P<0.001), whereas serum adiponectin levels were significantly lower in the NAFLD group (3.01±2.07 vs. 10.63±3.13 µg/mL; P<0.001). Comparisons of clinico-demographic and laboratory data between NAFLD patients and controls are presented in Table 1. As expected, significantly higher BMI, AST, ALT, alkaline phosphatase, GGT, triglycerides, glucose, and fasting insulin, indicative of a high metabolic burden, were observed in NAFLD children compared to controls.
Table 1.
Demographic and laboratory characteristics of the study participants (n=158)
Comparisons within different specific histopathological lesions
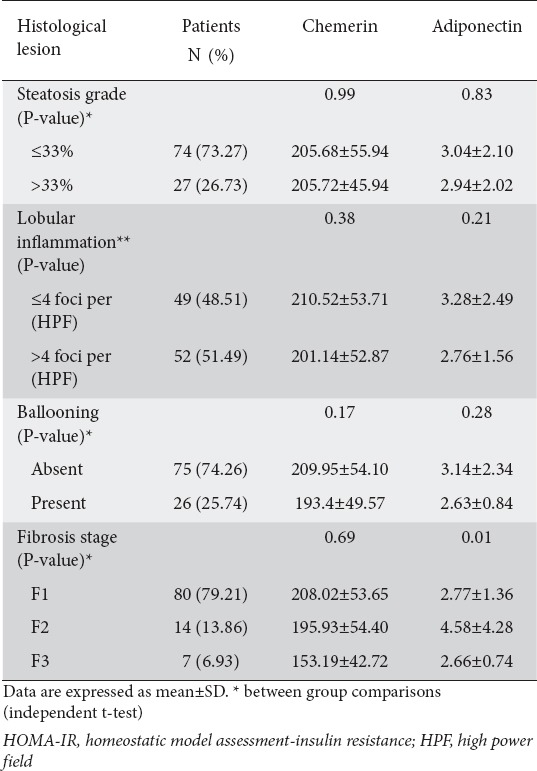
Overall, the mean±SD NAS score was 5.73±1.04 in the NAFLD obese children group. The percentage of patients with a NAS score of 5 or more (those with steatohepatitis) was 69.30%. The percentage of patients with a steatosis grade of less than 33% was 73.27%, while 26.73% had a steatosis grade of more than 33% (Fig. 1). The incidences of lobular inflammation with fewer than 4 foci and more than 4 foci per high power field (HPF) were 48.51% and 51.49% respectively (Fig. 1). The most common fibrosis grade in our NAFLD patients was F1 (80%) (Fig. 1). When circulating chemerin and adiponectin were compared across groups with specific histological changes in NAFLD patients (n=101), no statistically significant difference was observed in chemerin levels between groups of low vs. high steatosis, lobular inflammation, ballooning or fibrosis grades. Adiponectin differed significantly within different fibrosis groups (P<0.001) with its highest mean value in patients with F2, as shown in Table 2.
Figure 1.
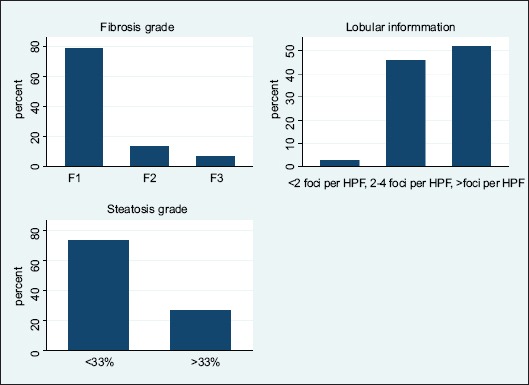
The frequency (percentage) of histologic findings in the nonalcoholic fatty liver disease group. The degree of steatosis (top), lobular inflammation degree based on foci of lobular inflammation in high power field of microscopic view (middle), and fibrosis degree (bottom)
Table 2.
Chemerin and adiponectin levels across groups with specific histologic lesions within nonalcoholic fatty liver disease patients (n=101)
Correlation between candidate adipokines and other study parameters
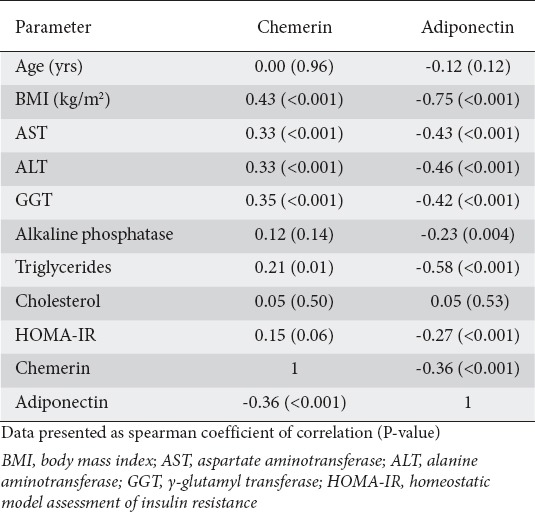
The correlations of circulating chemerin and adiponectin with other study parameters are shown in Table 3. Chemerin was significantly positively correlated with BMI (r=0.43, P<0.001), AST (r=0.33, P=0.001), ALT (r=0.33, P<0.001), GGT (r=0.35, P<0.001), and triglycerides (r=0.21, P=0.01), and significantly negatively correlated with adiponectin (r=-0.36, P≤0.001). Adiponectin had significant negative correlations with BMI (r=-0.75, P<0.001), AST (r=-0.43, P<0.001), ALT (r=-0.46, P<0.001), GGT (r=-0.42, P<0.001), alkaline phosphatase (r=-0.23, P=0.004), triglycerides (r=-0.58, P<0.001), HOMA-IR (r=-0.27, P<0.001), and chemerin (r=-0.36, P<0.001).
Table 3.
Correlation between chemerin and adiponectin and other study parameters
Predictors of NAFLD diagnosis
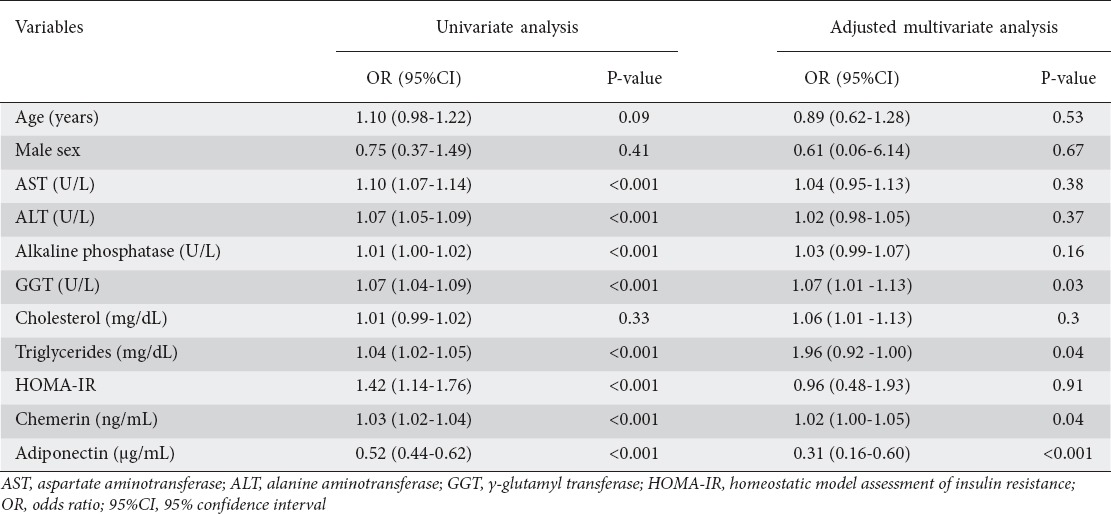
To identify parameters associated with a NAFLD diagnosis, univariate binary logistic regression analyses were performed, with “0” representing the control group and “1” representing the NAFLD group. Increased serum AST (OR 1.10, 95%CI 1.07-1.14, P<0.001), ALT (OR 1.07, 95%CI 1.05-1.09, P<0.001), alkaline phosphatase (OR 1.01, 95%CI 1.00-1.02, P<0.001), GGT (OR 1.07, 95%CI 1.04-1.09, P<0.001), triglycerides (OR 1.04, 95%CI 1.02-1.05, P<0.001), HOMA-IR (OR 1.42, 95%CI 1.14-1.76, P<0.001), and chemerin (OR 1.03, 95%CI 1.02-1.04, P<0.001) had a significant positive association with a NAFLD diagnosis. In contrast, increased serum adiponectin was significantly inversely associated with a NAFLD diagnosis (OR 0.52, 95%CI 0.44-0.62, P<0.001). After adjustment for patients’ baseline characteristics in the multivariate adjusted logistic regression model, only GGT (OR 1.07, 95%CI 1.01-1.13, P=0.03), triglycerides (OR 1.96, 95%CI 0.92-1.00, P=0.04), chemerin (OR 1.02, 95%CI 1.00-1.05, P=0.04) and adiponectin (OR 0.31, 95%CI 0.16-0.60, P<0.001) remained independent predictors for NAFLD, as shown in Table 4.
Table 4.
Predictors of nonalcoholic fatty liver disease among our cohort by univariate and multivariate logistic regression analyses
The best threshold values for the studied adipokines for differentiating NAFLD patients from healthy subjects according to ROC curve analysis are provided in Table 5. ROC analysis demonstrated that a cutoff value of 186.7 ng/mL for chemerin yielded a sensitivity and specificity of 56.44% and 87.72%, respectively (C statistics 0.78), while a cutoff value of 2.4 µg/mL for adiponectin yielded a sensitivity and specificity of 74.26% and 3.51%, respectively (C statistic=0.92, P<0.001; Fig. 2).
Table 5.
Diagnostic performance, optimal cutoffs, and validity of adiponectin for the diagnosis of nonalcoholic fatty liver disease in a pediatric population

Figure 2.
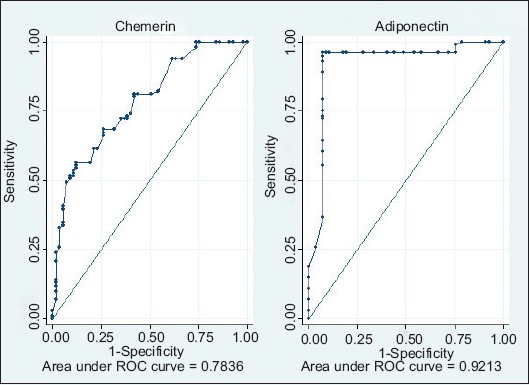
Receiver operator characteristic curves for the diagnostic power of chemerin and adiponectin at various cutoff points in differentiating between patients with nonalcoholic fatty liver disease and controls
Discussion
In the current case-control study, significantly higher levels of circulating chemerin and significantly lower levels of adiponectin were detected in obese children with biopsy-proven NAFLD compared to controls. Additionally, BMI, AST, ALT, triglycerides, and GGT showed significant positive correlations with chemerin and significant negative correlations with adiponectin.
NAFLD in children is becoming a major health concern, because of its high prevalence and its well-known serious complications, including liver failure and HCC. From 10-30% of NAFLD patients can progress to liver cirrhosis [14] and 70-90% of patients with chronic liver disease related to NAFLD develop HCC [15]. Insulin resistance appears to be the key underlying pathophysiological defect leading to NAFLD [16], with subsequent hyperinsulinemia that leads to changes in hepatocyte uptake, synthesis, degradation, and secretion of free fatty acids, and subsequently to the accumulation of triglycerides in the hepatocytes resulting in hepatic steatosis [17-19]. In the present study, we found that HOMA-IR as a surrogate marker for insulin resistance was significantly higher in NAFLD patients compared to controls (3.13±1.93 vs. 2.06±1.71). Consistent results have been reported by Kumar et al [20], as well as by Boga et al [21].
In the current investigation, we found that circulating adiponectin levels were significantly lower in NAFLD patients compared to controls (3.01±2.07 vs. 10.63±3.13 µg/mL respectively). This finding is in keeping with previous studies [22-26]. Hypoadiponectinemia might serve as a predictor of NAFLD in obese children [27]. Adiponectin is an abundant adipocyte-derived hormone with well-established anti-inflammatory and insulin-sensitizing properties [28]. There is a well-known link between hypoadiponectinemia and NASH, regardless of insulin resistance [29]. Furthermore, within the NAFLD group, a significantly higher level of adiponectin was observed in patients with F2 (4.58±4.28 µg/mL). This could be attributed to a possible imbalance between adiponectin production and hepatic excretion [30,31], following the increased adiponectin production from the hepatocytes or hepatic stellate cells [32,33].
The most interesting finding is the significantly higher serum chemerin concentration in NAFLD obese children compared to controls (205.69±53.22 vs. 153.19±42.72 ng/mL). To our best knowledge, such data for the pediatric population are scarce. Our results are in concordance with those reported by Kłusek-Oksiuta et al, who found that chemerin might be a good indicator of liver steatosis in obese children. Chemerin is an adipokine highly expressed in both the liver and adipose tissue [34]; its circulating levels are increased in human obesity [35-37]. It enhances insulin-stimulated glucose uptake and increases insulin sensitivity in adipose tissue [38]. The actual role of chemerin in NAFLD is still unknown.
In conclusion, onclusio circulating chemerin and adiponectin could serve as simple, reliable, noninvasive diagnostic markers for NAFLD in non-diabetic obese children.
Summary Box.
What is already known:
Nonalcoholic fatty liver disease (NAFLD) is the most common cause of chronic liver disease in children
Early diagnosis and proper management of NAFLD could significantly reduce its liver-related morbidity and mortality
Precise diagnosis of NAFLD is currently dependent on liver histopathology
What the new findings are:
Circulating adipokines could serve as noninvasive predictors of NAFLD diagnosis
Increased circulating chemerin and decreased adiponectin were significantly associated with NAFLD diagnosis in obese non-diabetic children
Circulating adiponectin differed significantly within different hepatic fibrosis grades
Acknowledgment
The authors wish to thank Ms. Sherif Okasha (Translator at United Nations) who assisted in the proof-reading of the manuscript.
Biography
National Hepatology and Tropical Medicine Institute, Egypt; Damanhur National Medical Institute, Egypt; King Abdul-Aziz University, Jeddah, Kingdom of Saudi Arabia; Beni Suef University; Benha University, Egypt; Cairo University; Ain Shams University, Egypt
Footnotes
Conflict of Interest: None
References
- 1.Yki-Järvinen H. Non-alcoholic fatty liver disease as a cause and a consequence of metabolic syndrome. Lancet Diabetes Endocrinol. 2014;2:901–910. doi: 10.1016/S2213-8587(14)70032-4. [DOI] [PubMed] [Google Scholar]
- 2.Bhala N, Jouness RI, Bugianesi E. Epidemiology and natural history of patients with NAFLD. Curr Pharm Des. 2013;19:5169–5176. doi: 10.2174/13816128113199990336. [DOI] [PubMed] [Google Scholar]
- 3.Güngör NK. Overweight and obesity in children and adolescents. J Clin Res Pediatr Endocrinol. 2014;6:129–143. doi: 10.4274/jcrpe.1471. [DOI] [PMC free article] [PubMed] [Google Scholar]
- 4.Clemente MG, Mandato C, Poeta M, Vajro P. Pediatric non-alcoholic fatty liver disease: Recent solutions, unresolved issues, and future research directions. World J Gastroenterol. 2016;22:8078–8093. doi: 10.3748/wjg.v22.i36.8078. [DOI] [PMC free article] [PubMed] [Google Scholar]
- 5.Anderson EL, Howe LD, Jones HE, Higgins JP, Lawlor DA, Fraser A. The prevalence of non-alcoholic fatty liver disease in children and adolescents: a systematic review and meta-analysis. PLoS One. 2015;10:e0140908.5. doi: 10.1371/journal.pone.0140908. [DOI] [PMC free article] [PubMed] [Google Scholar]
- 6.Almeda-Valdes P, Aguilar-Olivos N, Uribe M, Méndez-Sánchez N. Common features of the metabolic syndrome and nonalcoholic fatty liver disease. Rev Recent Clin Trials. 2014;9:148–158. doi: 10.2174/1574887109666141216103908. [DOI] [PubMed] [Google Scholar]
- 7.Machado MV, Cortez-Pinto H. Diet, microbiota, obesity, and NAFLD: a dangerous quartet. Int J Mol Sci. 2016;17:481. doi: 10.3390/ijms17040481. [DOI] [PMC free article] [PubMed] [Google Scholar]
- 8.Farrell GC, Larter CZ. Nonalcoholic fatty liver disease: from steatosis to cirrhosis. Hepatology. 2006;43:S99–S112. doi: 10.1002/hep.20973. [DOI] [PubMed] [Google Scholar]
- 9.Jamali R. Non-alcoholic fatty liver disease: diagnosis and evaluation of disease severity. Thrita. 2013;2:43–51. [Google Scholar]
- 10.Sumida Y, Nakajima A, Itoh Y. Limitations of liver biopsy and non-invasive diagnostic tests for the diagnosis of nonalcoholic fatty liver disease/nonalcoholic steatohepatitis. World J Gastroenterol. 2014;20:475–485. doi: 10.3748/wjg.v20.i2.475. [DOI] [PMC free article] [PubMed] [Google Scholar]
- 11.Nobili V, Manco M. Therapeutic strategies for pediatric non-alcoholic fatty liver disease: a challenge for health care providers. World J Gastroenterol. 2007;13:2639–2641. doi: 10.3748/wjg.v13.i18.2639. [DOI] [PMC free article] [PubMed] [Google Scholar]
- 12.Kleiner DE, Brunt EM, Van Natta M, et al. Nonalcoholic Steatohepatitis Clinical Research Network. Design and validation of a histological scoring system for nonalcoholic fatty liver disease. Hepatology. 2005;41:1313–1321. doi: 10.1002/hep.20701. [DOI] [PubMed] [Google Scholar]
- 13.Yokoyama H, Emoto M, Fujiwara S, et al. Quantitative insulin sensitivity check index and the reciprocal index of homeostasis model assessment in normal range weight and moderately obese type 2 diabetic patients. Diabetes Care. 2003;26:2426–2432. doi: 10.2337/diacare.26.8.2426. [DOI] [PubMed] [Google Scholar]
- 14.Dyson JK, Anstee QM, McPherson S. Non-alcoholic fatty liver disease: a practical approach to treatment. [Last accessed: April 2017]. Available from: http://fg.bmj.com/content/5/4/277 .
- 15.Patient Info. Primary Liver Cancer. [Last accessed: April 2017]. Available from: http://patient.info/doctor/primary-liver-cancer-pro .
- 16.Cohen DE Pathogenesis and management of non-alcoholic fatty liver disease. New Orleans: Presented at: National Lipid Association Scientific Sessions; May 19-22; 2016. [Google Scholar]
- 17.Kahn BB, Flier JS. Obesity and insulin resistance. J Clin Invest. 2000;106:473–481. doi: 10.1172/JCI10842. [DOI] [PMC free article] [PubMed] [Google Scholar]
- 18.Houmard JA. Intramuscular lipid oxidation and obesity. Am J Physiol Regul Integr Comp Physiol. 2008;294:R1111–R1116. doi: 10.1152/ajpregu.00396.2007. [DOI] [PMC free article] [PubMed] [Google Scholar]
- 19.Joseph AM, Joanisse DR, Baillot RG, Hood DA. Mitochondrial dysregulation in the pathogenesis of diabetes: potential for mitochondrial biogenesis-mediated interventions. Exp Diabetes Res. 2012;2012:642038. doi: 10.1155/2012/642038. [DOI] [PMC free article] [PubMed] [Google Scholar]
- 20.Kumar R, Prakash S, Chhabra S, et al. Association of pro-inflammatory cytokines, adipokines & oxidative stress with insulin resistance & non-alcoholic fatty liver disease. Indian J Med Res. 2012;136:229–236. [PMC free article] [PubMed] [Google Scholar]
- 21.Boga S, Alkim H, Koksal AR, et al. Increased plasma levels of asymmetric dimethylarginine in nonalcoholic fatty liver disease: relation with insulin resistance, inflammation, and liver histology. J Investig Med. 2015;63:871–877. doi: 10.1097/JIM.0000000000000230. [DOI] [PubMed] [Google Scholar]
- 22.Gaddipati R, Sasikala M, Padaki N, et al. Visceral adipose tissue visfatin in nonalcoholic fatty liver disease. Ann Hepatol. 2010;9:266–270. [PubMed] [Google Scholar]
- 23.Manco M, Marcellini M, Giannone G, Nobili V. Correlation of serum TNF-alpha levels and histologic liver injury scores in pediatric nonalcoholic fatty liver disease. Am J Clin Pathol. 2007;127:954–960. doi: 10.1309/6VJ4DWGYDU0XYJ8Q. [DOI] [PubMed] [Google Scholar]
- 24.Wieckowska A, Papouchado BG, Li Z, Lopez R, Zein NN, Feldstein AE. Increased hepatic and circulating interleukin-6 levels in human nonalcoholic steatohepatitis. Am J Gastroenterol. 2008;103:1372–1379. doi: 10.1111/j.1572-0241.2007.01774.x. [DOI] [PubMed] [Google Scholar]
- 25.Chu CJ, Lu RH, Wang SS, et al. Plasma levels of interleukin-6 and interleukin-8 in Chinese patients with non-alcoholic fatty liver disease. Hepatogastroenterology. 2007;54:2045–2048. [PubMed] [Google Scholar]
- 26.Senates E, Yilmaz Y, Colak Y, et al. Serum levels of hepcidin in patients with biopsy-proven nonalcoholic fatty liver disease. Metab Syndr Relat Disord. 2011;9:287–290. doi: 10.1089/met.2010.0121. [DOI] [PubMed] [Google Scholar]
- 27.Zou CC, Liang L, Hong F, Fu JF, Zhao ZY. Serum adiponectin, resistin levels and non-alcoholic fatty liver disease in obese children. Endocr J. 2005;52:519–524. doi: 10.1507/endocrj.52.519. [DOI] [PubMed] [Google Scholar]
- 28.Finelli C, Tarantino G. What is the role of adiponectin in obesity related non-alcoholic fatty liver disease? World J Gastroenterol. 2013;19:802–812. doi: 10.3748/wjg.v19.i6.802. [DOI] [PMC free article] [PubMed] [Google Scholar]
- 29.Lemoine M, Ratziu V, Kim M, et al. Serum adipokine levels predictive of liver injury in non-alcoholic fatty liver disease. Liver Int. 2009;29:1431–1438. doi: 10.1111/j.1478-3231.2009.02022.x. [DOI] [PubMed] [Google Scholar]
- 30.Tietge UJ, Böker KH, Manns MP, Bahr MJ. Elevated circulating adiponectin levels in liver cirrhosis are associated with reduced liver function and altered hepatic hemodynamics. Am J Physiol Endocrinol Metab. 2004;287:E82–E89. doi: 10.1152/ajpendo.00494.2003. [DOI] [PubMed] [Google Scholar]
- 31.Hui CK, Zhang HY, Lee NP, et al. Hong Kong Liver Fibrosis Study Group. Serum adiponectin is increased in advancing liver fibrosis and declines with reduction in fibrosis in chronic hepatitis B. J Hepatol. 2007;47:191–202. doi: 10.1016/j.jhep.2007.02.023. [DOI] [PubMed] [Google Scholar]
- 32.Brunt EM. Nonalcoholic steatohepatitis: definition and pathology. Semin Liver Dis. 2001;21:3–16. doi: 10.1055/s-2001-12925. [DOI] [PubMed] [Google Scholar]
- 33.Ding X, Saxena NK, Lin S, et al. The roles of leptin and adiponectin: a novel paradigm in adipocytokine regulation of liver fibrosis and stellate cell biology. Am J Pathol. 2005;166:1655–1669. doi: 10.1016/S0002-9440(10)62476-5. [DOI] [PMC free article] [PubMed] [Google Scholar]
- 34.Kłusek-Oksiuta M, Bialokoz-Kalinowska I, Tarasów E, Wojtkowska M, Werpachowska I, Lebensztejn DM. Chemerin as a novel non-invasive serum marker of intrahepatic lipid content in obese children. Ital J Pediatr. 2014;40:84. doi: 10.1186/s13052-014-0084-4. [DOI] [PMC free article] [PubMed] [Google Scholar]
- 35.Bozaoglu K, Bolton K, McMillan J, et al. Chemerin is a novel adipokine associated with obesity and metabolic syndrome. Endocrinology. 2007;148:4687–4694. doi: 10.1210/en.2007-0175. [DOI] [PubMed] [Google Scholar]
- 36.Parlee SD, Ernst MC, Muruganandan S, Sinal CJ, Goralski KB. Serum chemerin levels vary with time of day and are modified by obesity and tumor necrosis factor-{alpha} Endocrinology. 2010;151:2590–2602. doi: 10.1210/en.2009-0794. [DOI] [PubMed] [Google Scholar]
- 37.Stejskal D, Karpisek M, Hanulova Z, Svestak M. Chemerin is an independent marker of the metabolic syndrome in a Caucasian population—a pilot study. Biomed Pap Med Fac Univ Palacky Olomouc Czech Repub. 2008;152:217–221. doi: 10.5507/bp.2008.033. [DOI] [PubMed] [Google Scholar]
- 38.Takahashi M, Takahashi Y, Takahashi K, et al. Chemerin enhances insulin signaling and potentiates insulin-stimulated glucose uptake in 3T3-L1 adipocytes. FEBS Lett. 2008;582:573–578. doi: 10.1016/j.febslet.2008.01.023. [DOI] [PubMed] [Google Scholar]


