

Abstract
Epithelial–mesenchymal transition (EMT) and its reverse process, mesenchymal–epithelial transition MET, are crucial in several stages of cancer metastasis. Epithelial–mesenchymal transition allows cancer cells to move to proximal blood vessels for intravasation. However, because EMT and MET processes are dynamic, mesenchymal cancer cells are likely to undergo MET transiently and subsequently re‐undergo EMT to restart the metastatic process. Therefore, spatiotemporally coordinated mutual regulation between EMT and MET could occur during metastasis. To elucidate such regulation, we chose HCC38, a human triple‐negative breast cancer cell line, because HCC38 is composed of epithelial and mesenchymal populations at a fixed ratio even though mesenchymal cells proliferate significantly more slowly than epithelial cells. We purified epithelial and mesenchymal cells from Venus‐labeled and unlabeled HCC38 cells and mixed them at various ratios to follow EMT and MET. Using this system, we found that the efficiency of EMT is approximately an order of magnitude higher than that of MET and that the two populations significantly enhance the transition of cells from the other population to their own. In addition, knockdown of Zinc finger E‐box‐binding homeobox 1 (ZEB1) or Zinc finger protein SNAI2 (SLUG) significantly suppressed EMT but promoted partial MET, indicating that ZEB1 and SLUG are crucial to EMT and MET. We also show that primary breast cancer cells underwent EMT that correlated with changes in expression profiles of genes determining EMT status and breast cancer subtype. These changes were very similar to those observed in EMT in HCC38 cells. Consequently, we propose HCC38 as a suitable model to analyze EMT–MET dynamics that could affect the development of triple‐negative breast cancer.
Keywords: Breast cancer, cancer development, EMT, EMT‐inducing transcription factor, MET
Epithelial–mesenchymal transition, in which adherent epithelial cells differentiate into migratory mesenchymal cells, has been identified as an important step in the generation of tissues and organs.1 Epithelial–mesenchymal transition has received much attention because it is involved in tumor progression, especially in several stages of the metastatic cascade including the loss of cell–cell adhesion and enhancement of cell migration and intravasation.2, 3, 4 In addition, MET, the reverse process, is involved in another stage of metastasis, the stable integration of cancer cells into distant organs after extravasation.5 Interestingly, cancer cells that have undergone EMT could transiently display an epithelial phenotype through MET and subsequently reacquire a mesenchymal phenotype through EMT before extravasation.3 Therefore, both EMT and MET are dynamic processes, and such bidirectional transitions between epithelial and mesenchymal cells could be involved in cancer development. Notably, it was recently reported that EMT is crucial for the development of human TNBC in vivo.6 Therefore, the molecular mechanisms underlying regulation of the balance between EMT and MET urgently require elucidation. One of the molecular features of EMT is the functional loss of E‐cadherin, encoded by CDH1, which forms adherens junctions to maintain cell–cell adhesion. SNAIL (SNAI1) was the first‐identified transcription factor that represses CDH1 expression and induces EMT.7, 8, 9, 10 Since then, a number of EMT‐inducing transcription factors (EMT‐inducers) have been identified as transcriptional repressors of CDH1, such as SLUG (SNAI2),11 ZEB family factors (ZEB1 and ZEB2),12, 13 E47,14 Kruppel‐like factor 8,15 and Brachyury.16 These EMT‐inducers repress the expression of not only CDH1 but also other junctional proteins, including claudins and desmoglein‐2.17, 18 They can also trigger cellular reprogramming so that the cells display mesenchymal characteristics. While some EMT‐inducers are involved in maintaining stem cell plasticity in normal tissues, they are also involved in the generation and maintenance of cancer stem cells, which are highly resistant to chemotherapy and radiotherapy, thereby establishing cancer recurrence.19, 20 Therefore, it has been proposed that EMT is crucial for cancer stem cell generation. Expression levels of EMT‐inducers are regulated by various signal pathways, including the TGF‐β,4, 21, 22, 23 Wnt/β‐catenin,24, 25 and JAK/STAT26, 27 pathways. These pathways are likely involved in the dynamics of the EMT–MET balance.
Although EMT plays a critical role in TNBC development in vivo, the lack of a simple model for analyzing the intratumoral EMT–MET balance hampers clarification of the mechanisms underlying its regulation. While studying TNBC development, we found that two TNBC cell lines, HCC38 and HCC1143, contain both epithelial and mesenchymal populations in fixed ratios. This finding led us to determine whether intratumoral EMT and MET could occur in these cell lines and to investigate the molecular mechanisms for regulating the balance between EMT and MET.
Materials and Methods
Cell culture and transfection
Human breast cancer cell lines were purchased from ATCC (Manassas, VA, USA). All cell lines were cultured according to the recommendations of the supplier. Primary culture of the breast cancer cells was carried out as previously described28 (Doc. S1). For the inhibition of signaling pathways, cells were cultured with 1 μM LGK‐974, 1 μM Reparixin (Cayman Chemical Company. Ann Arbor, MI, USA), 10 μM AG‐490, 5 μM DAPT, 10 μM L685, 458, 1 μM TPCA1 (Sigma, St. Louis, MO, USA) or 1 μM SB203580 (LC Laboratories, Woburn, MA, USA). For the neutralization assay, cells were cultured with 2 μg/mL neutralizing antibody against pan‐TGF‐β or control mouse IgG. Cell lines expressing SNAIL, SLUG, and ZEB1 were generated by retroviral infection with pMXs‐SNAIL‐puro, pMXs‐SLUG‐puro, and pMXs‐ZEB1‐puro, followed by 1 μg/ml puromycin selection. The siRNA transfection was achieved by using Lipofectamine RNAiMAX (Thermo Fisher Scientific, San Jose, CA, USA) according to the manufacturer's protocol. See Document S1 for siRNAs.
Flow cytometric analysis
Cells were stained with anti‐human CD44‐FITC (1:100), anti‐human CD24‐PE (1:100), and anti‐human EpCAM‐PerCP/Cy5.5 antibodies (1:100) in the presence of 7AAD (1 μg/mL) for 30 min at 4°C. Cells were analyzed using a BD FACSVerse (BD Biosciences, San Jose, CA, USA) and sorted using a BD FACSAria. For HCC38‐Venus cell analysis, anti‐human CD44‐PE (1:100) was used. For analysis of primary breast cancer cells, cells were stained with anti‐human CD140b‐biotin (1:100) and a cocktail of biotin‐conjugated antibodies (anti‐CD2, anti‐CD3, anti‐CD11b, anti‐CD14, anti‐CD15, anti‐CD16, anti‐CD19, anti‐CD56, anti‐CD123, and anti‐CD235a) (1:5) for 15 min at 4°C to separate hematopoietic cells, red blood cells, endothelial cells, and fibroblasts. Cells were stained with anti‐human CD44‐FITC (1:100), anti‐human CD24‐PE (1:100), and anti‐human EpCAM‐PerCP/Cy5.5 antibodies (1:100) and streptavidin‐PE‐CF594 (1:100) in the presence of 7AAD (1 μg/mL) for 30 min at 4°C and analyzed using a BD FACSVerse.
Ethical considerations
The protocols for the experiments using primary tumor cells were approved by the Ethics Committee of the Institute of Medical Science, The University of Tokyo (Tokyo, Japan), and conformed to the provisions of the Declaration of Helsinki (as revised in Fortaleza, Brazil, October 2013). Written informed consent was obtained from each patient before any study procedure was carried out.
Statistical analysis
Statistically significant differences between the mean values were determined using two‐tailed Student's t‐tests. All data are representative of three independent experiments. The values represent the mean ± SD. P‐values less than 0.05 were considered statistically significant.
Results
HCC38 and HCC1143 cell lines maintain EpCAM+ epithelial and EpCAM− mesenchymal populations in fixed ratios
To search for human breast cancer cell lines in which EMT and MET occur, we first analyzed cell surface expression of EpCAM and CD44 in various breast cancer cell lines including luminal‐like subtype and TNBC, which consists of basal‐like and claudin‐low subtypes. Two luminal‐like cell lines, MCF7 and T47D, and one basal‐like cancer cell line, HCC1937, contain a single population of EpCAM+CD44low cells (blue dots); two claudin‐low cell lines, MDA‐MB231 and MDA‐MB436, contain a single population of EpCAM−CD44high cells (red dots) (Fig. 1a, upper panels). Interestingly, two basal‐like cell lines, HCC38 and HCC1143, consist of the two populations in fixed ratios; the ratios of EpCAM+CD44low (hereafter called EpCAM+) cells to EpCAM−CD44high (EpCAM−) cells were approximately 90:10 and 99:1 in HCC38 and HCC1143, respectively (Fig. 1a, upper panels). Note that EpCAM− populations in HCC38 and of HCC1143 cells were CD24−, similar to claudin‐low subtype cell lines (Fig. 1a, lower panels), suggesting that HCC38 and HCC1143 contain claudin‐low subtype cancer cells as a minor population. Western blot and immunofluorescence analyses also revealed that HCC38 was composed of both E‐cadherin+ basal‐like and vimentin+ claudin‐low subtype cancer cells (Fig. S1a,b). Therefore, a loss of EpCAM expression could lead to a subtype change, observed in some breast cancer patients.29, 30
Figure 1.
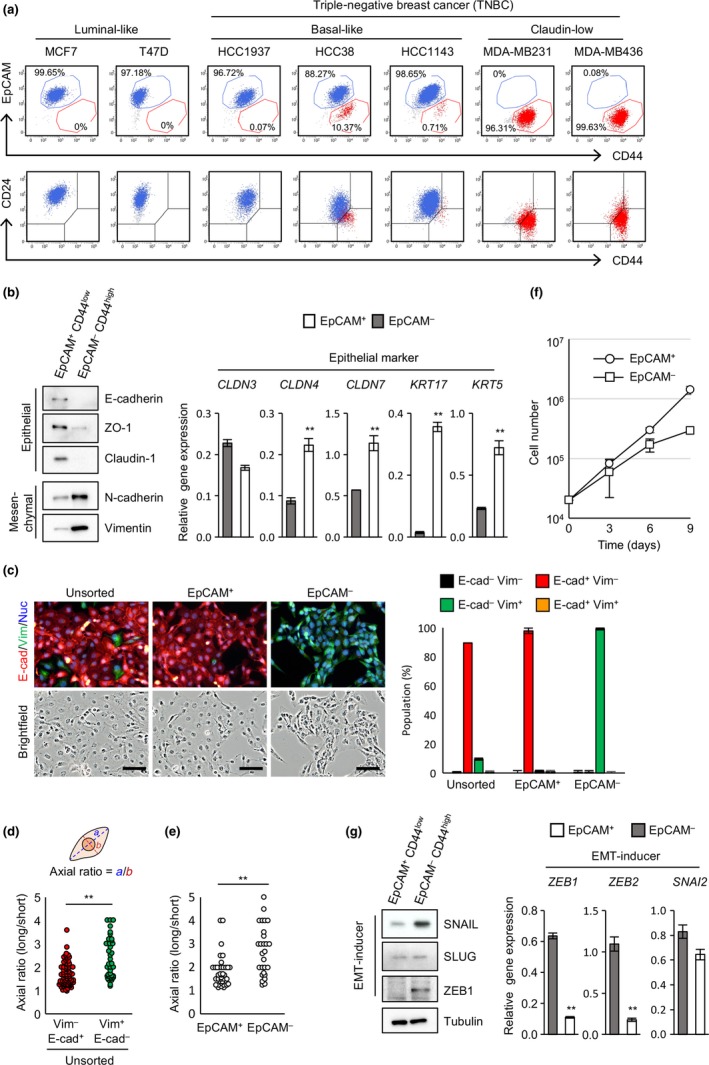
Breast cancer cell lines HCC38 and HCC1143 maintain epithelial cell adhesion molecule (EpCAM)+ epithelial and EpCAM − mesenchymal populations in fixed ratios. (a) Flow cytometric analysis of breast cancer cell lines. (b) Expression of epithelial and mesenchymal markers. (c) Immunofluorescence analysis of E‐cadherin (E‐cad) and vimentin (Vim) expression in unsorted HCC38 and sorted EpCAM + and EpCAM − cells. Scale bar = 100 μm. (d) Morphological differences between E‐cadherin+ and vimentin+ cells. (e) Morphological differences between sorted EpCAM + and EpCAM − cells. (f) Proliferation analysis of sorted EpCAM + and EpCAM − cells. (g) Expression of epithelial–mesenchymal transition (EMT)‐inducers. (b–g) Data represent the mean ± SD of three independent experiments. Nuc, Nuclei; SLUG, Zinc finger protein SNAI2; SNAIL, Zinc finger protein SNAI1; ZEB1, Zinc finger E‐box‐binding homeobox 1. **P < 0.01.
To further characterize EpCAM+ and EpCAM− populations, the two populations were sorted in HCC38 cells (Fig. S1c) and analyzed for expression of epithelial and mesenchymal markers by Western blot analysis and quantitative real‐time RT‐PCR. The EpCAM+ cells highly expressed epithelial markers including E‐cadherin, ZO‐1, and claudin‐1, as well as mRNAs for claudin‐4, claudin‐7, keratin‐5, and keratin‐17, while EpCAM− cells abundantly expressed mesenchymal markers including N‐cadherin and vimentin (Fig. 1b). Immunofluorescence analysis revealed that EpCAM+ cells express E‐cadherin, whereas EpCAM− cells express vimentin (Fig. 1c). Epithelial–mesenchymal transition induces changes in cell morphology.1, 31 Vimentin+ cells showed an elongated shape with a bigger axial ratio when compared with E‐cadherin+ cells in unsorted HCC38 (Fig. 1d). Moreover, sorted EpCAM− cells showed an elongated shape with bigger axial ratio than that of EpCAM+ cells (Fig. 1e). These results indicate that the EpCAM+ population is composed of epithelial cells whereas the EpCAM− population is composed of mesenchymal cells. It has been reported that mesenchymal cells divide much more slowly than epithelial cells.3, 22, 32 The doubling times of EpCAM+ cells and EpCAM− cells were approximately 35 and 54 h, respectively (Fig. 1f).
To determine the possible involvement of EMT and MET in the persistence of the two populations in HCC38 cells, expression levels of EMT‐inducers were first analyzed (Fig. 1g). High expression of SNAIL, ZEB1, and ZEB2 was evident in the EpCAM− population but barely expressed in the EpCAM+ population. However, SLUG was similarly expressed in the two populations at both the protein and mRNA levels.
Taken together, these results led us to hypothesize that the epithelial and mesenchymal populations do not proliferate independently, and that bidirectional transitions between the two populations, which are partly regulated by EMT‐inducers, could occur such that the ratio of the two populations is fixed.
Enhanced expression of EMT‐inducers led to the generation of an EpCAM− population
To ask whether EMT is involved in the generation of the two populations, we examined the effect of enforced EMT induced by overexpression of EMT‐inducers on the generation of an EpCAM− population. In HCC38 cells, overexpression of EMT‐inducers dramatically expanded the EpCAM− population from 10% to 87% (Fig. 2a,b). Even in the other cell lines, lacking an EpCAM− population, overexpression of EMT‐inducers efficiently generated an EpCAM− population (Fig. 2b). Immunofluorescence analysis revealed that SLUG overexpression induced E‐cadherin downregulation in luminal‐like cells and reduction of the E‐cadherin+ population and expansion of the Vimentin+ population in basal‐like cells (Fig. 2c). These results suggest that EMT of the epithelial population in HCC38 is involved in generating the mesenchymal population. Proliferation analysis of sorted EpCAM+ and EpCAM− cells from SLUG‐overexpressing cells revealed that SLUG‐induced EpCAM− cells divided much more slowly than EpCAM+ cells in all cell lines tested (Fig. S2a). One may wonder at the existence of an EpCAM+ population in cells that are stably overexpressing SLUG. This could be due to variation in the expression levels of SLUG among cells, as SLUG expression was much lower in the EpCAM+ than EpCAM− population (Fig. S2b).
Figure 2.
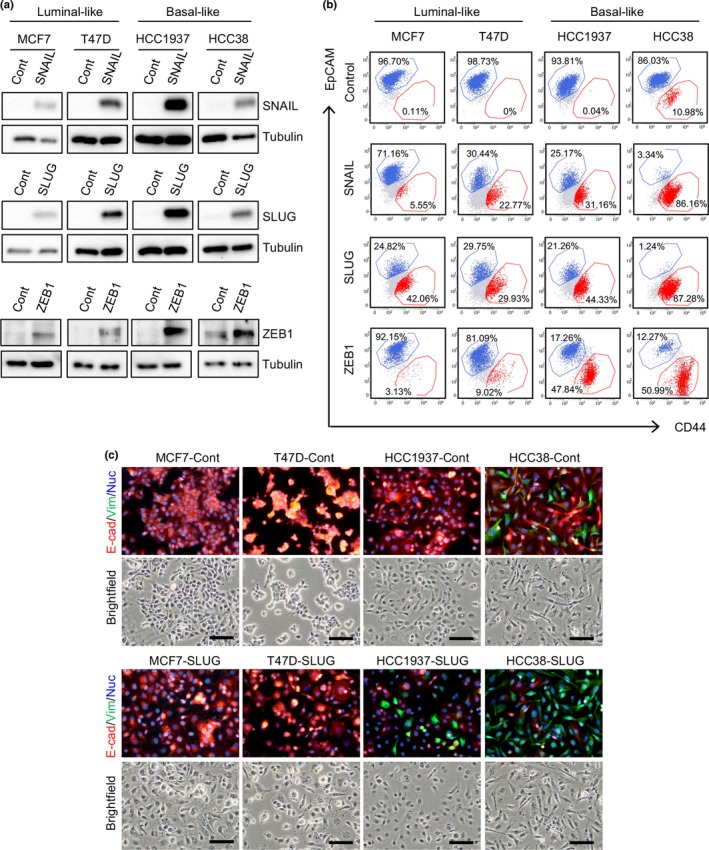
Overexpression of epithelial–mesenchymal transition‐inducers generates an epithelial cell adhesion molecule (EpCAM)− CD44high population in breast cancer cells. (a) Western blot analyses of Zinc finger protein SNAI2 (SLUG), Zinc finger protein SNAI1 (SNAIL), and Zinc finger E‐box‐binding homeobox 1 (ZEB1) expression. (b) Flow cytometric analysis of epithelial–mesenchymal transition‐inducer overexpressing cells. (c) Immunofluorescence analysis of E‐cadherin (E‐cad) and vimentin (Vim) expression in SLUG‐overexpressing cells. Scale bar = 100 μm. Cont, control; Nuc, Nuclei.
Epithelial and mesenchymal populations mutually enhance transition of the other population to their own
To examine bidirectional transitions between EpCAM+ and EpCAM− populations, single cell sorting of the two populations in the HCC38 cell line was carried out. Two cell clones per population (EpCAM+‐derived E10 and E14, and EpCAM−‐derived M1 and M7) were allowed to grow for 1 month and then analyzed for EpCAM and CD44 expression. The EpCAM+‐derived E10 and E14 clonal populations contained 0.2–1.4% EpCAM− cells; EpCAM−‐derived M1 and M7 clonal populations contained 0.1–0.2% EpCAM+ cells (Fig. 3a). These results indicate that bidirectional transitions (EMT and MET) can potentially occur in at least the single cell culture experiments. However, such low transition efficiencies cannot account for the fixed ratio of the two populations in HCC38 cells after factoring in the significant difference in their doubling times (Fig. 1c). These results led us to analyze the bidirectional transitions occurring in HCC38 cells under regular culture conditions.
Figure 3.
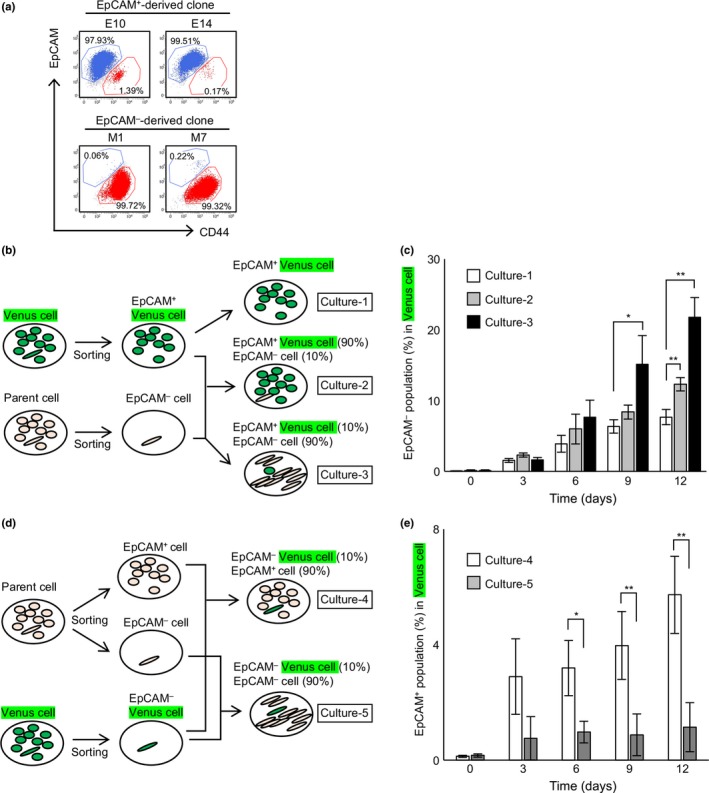
Involvement of reciprocal enhancement of bidirectional transition between epithelial cell adhesion molecule (EpCAM)+ and EpCAM − populations of breast cancer cells. (a) EpCAM + or EpCAM − single cells were sorted by flow cytometry and seeded into a 96‐well plate (1 cell/well). (b) Protocol for the coculture assay in (c). (c) Effect of unlabeled EpCAM − cells on the Venus‐expressing EpCAM + population. (d) Protocol for the coculture assay in (e). (e) Effect of unlabeled EpCAM + cells on the Venus‐expressing EpCAM − population. (c, e) Data represent the mean ± SD of three independent experiments. *P < 0.05; **P < 0.01.
To this end, HCC38 cells were first labeled with Venus, a derivative of GFP. The EpCAM+ and EpCAM− populations were then purified from both Venus‐labeled and non‐labeled cells by FACS‐mediated cell sorting (Fig. S1c). To analyze EMT, the EpCAM+‐Venus population was first cultured alone (Fig. 3b, Culture‐1) to determine whether the proliferation of the contaminated EpCAM−‐Venus cells (0.08% of the EpCAM+‐Venus population; Fig. S1c) needs to be taken into account when evaluating EMT. Cell counts of EpCAM−‐Venus cells at day 0 and day 3 revealed that the cell number increased 56‐ to 860‐fold, which corresponded to a doubling time of 7.4–12 h (Fig. S3a). Given that the doubling time of purified EpCAM− cells is approximately 54 h (Fig. 1c), the simplest interpretation is that most of the cells represented by the open columns in Figure 3(c) arise from EMT. When EpCAM+‐Venus cells were cocultured with EpCAM−‐unlabeled cells at their normal ratio of 90:10 (Fig. 3b, Culture‐2), the expansion of EpCAM−‐Venus cells was slightly enhanced (Figs 3c, S4a). Because the EpCAM+/EpCAM− ratio was normal, the total EpCAM− population was constant even though the EpCAM−‐Venus population was expanded (Fig. S4b). This expansion was significantly enhanced when EpCAM+‐Venus cells were cocultured with a 9‐fold excess of EpCAM−‐unlabeled cells (Fig. 3b, Culture‐3; Figs 3c, S4a). To analyze MET, the EpCAM−‐Venus population was first cocultured with EpCAM+‐unlabeled cells at the normal ratio of 10:90 (Fig. 3d, Culture‐4). To check whether the proliferation of the contaminated EpCAM+‐Venus cells (0.13% of the EpCAM−‐Venus population; Fig. S1c) needs to be taken into account when evaluating MET, EpCAM+‐Venus cells at day 0 and day 3 were counted. The experiment revealed that the cell number increased 50‐ to 100‐fold, which corresponded to a doubling time of 10–12 h (Fig. S3b). Given that the doubling time of purified EpCAM− cells is approximately 35 h (Fig. 1c), most of the cells represented by the open columns in Figure 3(e) must arise from MET. When EpCAM−‐Venus cells were cocultured with a 9‐fold excess of EpCAM−‐unlabeled cells (Fig. 3d, Culture‐5), the expansion of the EpCAM+‐Venus cell population was significantly inhibited in comparison with Culture‐4 (Figs 3e, S4c). Immunofluorescence analysis also revealed that EMT of EpCAM+‐Venus cells was significantly enhanced in Culture‐3 and MET of EpCAM−‐Venus cells was inhibited in Culture‐5 (Fig. S4d). Taken together, these results indicate that bidirectional transitions between epithelial and mesenchymal populations occur, and strongly suggest that the epithelial and mesenchymal populations each enhance the transition of cells from the other population to their own.
Both ZEB1 and SLUG are crucial for EMT and MET
To further explore the mechanisms regulating the bidirectional transitions between epithelial and mesenchymal populations in HCC38 cells, the roles of EMT‐inducers including ZEB1, ZEB2, SLUG, and SNAIL were analyzed. The EpCAM+ population was purified and siRNA‐mediated knockdown of EMT‐inducers was carried out. EpCAM− populations were then measured at the indicated number of days after transfection. Knockdown efficiencies were confirmed (Fig. 4a,b). Knockdown of ZEB1 and SLUG significantly suppressed the appearance of the EpCAM− population, whereas knockdown of ZEB2 and SNAIL barely affected it (Figs 4c, S5a). Immunofluorescence analysis also revealed that knockdown of ZEB1 and SLUG significantly suppressed the appearance of the vimentin+ cells (Fig. S5b). These results indicate that ZEB1 and SLUG, but not ZEB2 and SNAIL, are crucial in EMT. It was noted that ZEB1 is highly expressed in mesenchymal cells whereas SLUG expression is similar in epithelial and mesenchymal cells (Fig. 1b), suggesting that ZEB1 becomes activated mostly by induction, and that SLUG may be activated by post‐translational modifications, as reported previously.33, 34
Figure 4.
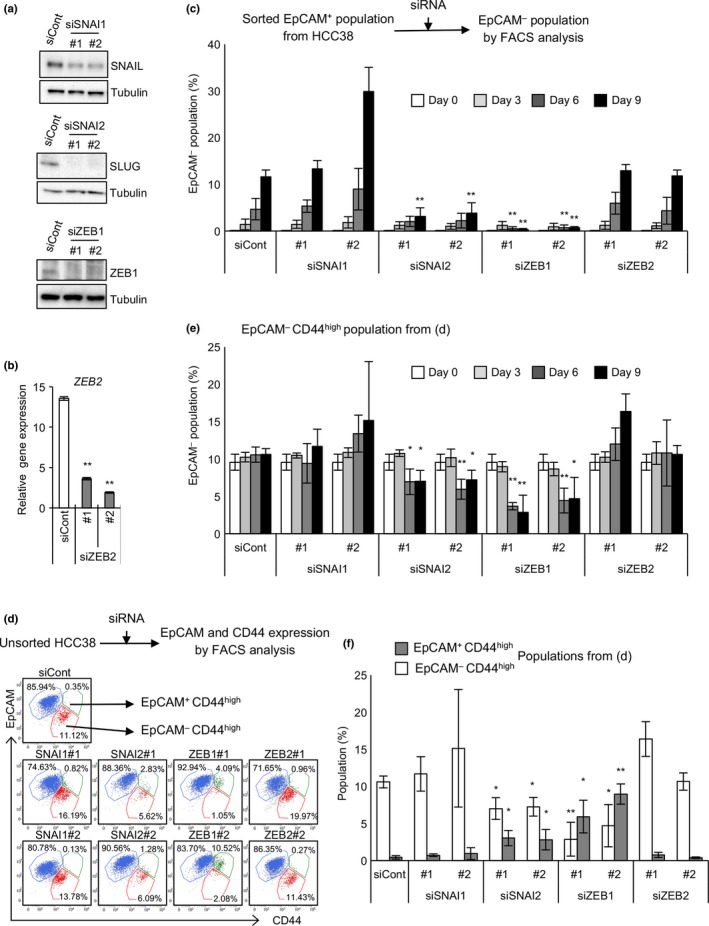
Zinc finger E‐box‐binding homeobox 1 (ZEB1) and Zinc finger protein SNAI2 (SLUG) are crucial for epithelial–mesenchymal transition (EMT) and mesenchymal–epithelial transition (MET). (a) Knockdown of Zinc finger protein SNAI1 (SNAIL), SLUG, and ZEB1. (b) Knockdown of ZEB2. (c) Effect of knockdown of various EMT‐inducers on EMT. Sorted epithelial cell adhesion molecule (EpCAM)+ cells were cultured in the presence of each siRNA. Cells were stained with CD44 and EpCAM. (d–f) Effect of knockdown of various EMT‐inducers on MET. Parental HCC38 cells were cultured in the presence of each siRNA. Cells were stained with CD44 and EpCAM. (d) Representative flow cytometric results on day 9. (e) EpCAM − populations were quantified. (f) EpCAM − CD44high and EpCAM + CD44high populations on day 9 were quantified. (b, c, e, f) Data represent the mean ± SD of three independent experiments. *P < 0.05; **P < 0.01. siCont, control siRNA.
To elucidate the role of EMT‐inducers in MET, siRNA‐mediated knockdown was carried out in unsorted HCC38 cells. When ZEB1 or SLUG was downregulated, the EpCAM− population (EpCAM−CD44high; Fig. 4d, red dots) decreased significantly. Concomitantly, an EpCAM+CD44high population appeared (Fig. 4d, green dots). The reduction in the EpCAM− population and increase in the EpCAM+CD44high population were most prominent in ZEB1‐knockdown cells, rather weak in SLUG‐knockdown cells, and not observed in SNAIL‐ and ZEB2‐knockdown cells (Fig. 4e,f). Given that complete MET results in the generation of an EpCAM+CD44low population, appearance of the EpCAM+CD44high population may be regarded as partial MET. Consistent with this, knockdown of ZEB1 or SLUG significantly generated E‐cadherin+vimentin+ cells from E‐cadherin−vimentin+ cells (Fig. S6). Therefore, one may propose that ZEB1 and SLUG, but neither ZEB2 nor SNAIL, are crucial for MET because expression levels of EpCAM and E‐cadherin in the EpCAM+CD44high population are almost equal to those in the EpCAM+CD44low population (Fig. 4d).
Involvement of the TGF‐β pathway in EMT
To elucidate the interactions between epithelial and mesenchymal populations, involvement of the signal pathways that regulate EMT were addressed. Treatment of the sorted EpCAM+ population with LGK‐974 (WNT inhibitor), reparixin (IL‐8 inhibitor), DAPT, L685,458 (NOTCH inhibitor), SB203580 (p38 inhibitor), and TPCA1 (IKKβ inhibitor) barely affected EMT (Fig. 5a,b). Interestingly, treatment with AG‐490, a JAK2/3 inhibitor, significantly suppressed EMT (Figs 5a, S7a), whereas treatment with CHIR‐98014, a GSK3β inhibitor, dramatically enhanced EMT (Figs 5c, S7a). Moreover, the addition of anti‐TGF‐β1, 2, 3 neutralizing antibody significantly suppressed EMT (Figs 5d, S7a). Inhibition of EMT by AG‐490 and anti‐TGF‐β antibody was also observed when EpCAM+‐Venus cells were cocultured with a 9‐fold excess of EpCAM−‐unlabeled cells (Figs 5e, 3b, Culture‐3; Fig. S7b). Neither AG‐490 nor anti‐TGF‐β antibody affected the proliferation of EpCAM+ and EpCAM− cells (Fig. S8), suggesting that the TGF‐β pathway and some JAK/STAT pathways could promote EMT, whereas some GSK3β‐mediated pathways are likely to inhibit EMT. Expression levels of TGF‐β and IL‐6, known to promote EMT through JAK/STAT pathway activation,26, 35 were analyzed in the two populations. Interestingly, TGF‐β1, but not TGF‐β2, TGF‐β3, or IL‐6, was highly expressed in the mesenchymal population (Fig. 5f). These results strongly suggest that TGF‐β1 could be involved in the mesenchymal cell‐mediated enhancement of EMT.
Figure 5.
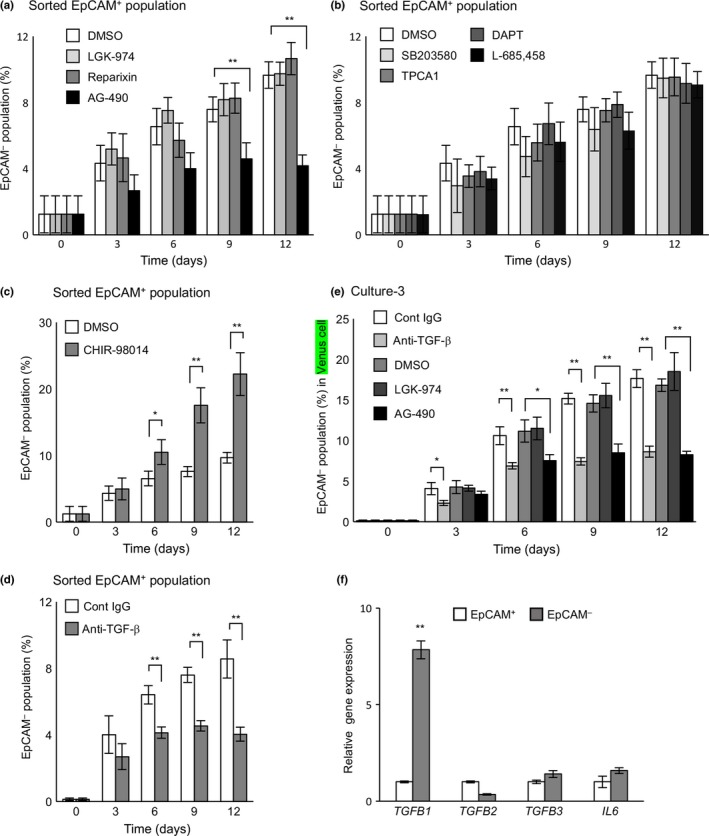
Effects of various inhibitors and an anti‐transforming growth factor‐β (TGF‐β) neutralizing antibody on epithelial–mesenchymal transition in breast cancer cells. Sorted epithelial cell adhesion molecule (EpCAM)+ cells were cultured in the presence or absence of various inhibitors (a–c) and an anti‐TGF‐β antibody (d). (e) Effect of various inhibitors and an anti‐TGF‐β neutralizing antibody on EpCAM − cell‐mediated enhancement of epithelial–mesenchymal transition. Sorted EpCAM +‐Venus‐expressing cells were cocultured with a 9‐fold excess of unlabeled EpCAM − cells in the presence or absence of various inhibitors and an anti‐TGF‐β antibody. (f) Expression levels of TGFB1,TGFB2,TGFB3, and IL6 were analyzed by quantitative real‐time RT‐PCR. (a–f) Data represent the mean ± SD of three independent experiments. *P < 0.05; **P < 0.01. Cont, control; DAPT, N‐[N‐(3,5‐difluorophenacetyl)‐l‐alanyl]‐S‐phenylglycine t‐butyl ester; TPCA1, 2‐[(aminocarbonyl)amino]‐5‐(4‐fluorophenyl)‐3‐thiophenecarboxamide.
Primary breast cancer cells undergo EMT
The dynamics of EMT or MET in primary breast tumors were then examined. Out of 70 specimens, cancer cells from five patients proliferated for several passages. Cell surface markers including EpCAM, CD24, and CD44 and gene expression profiles were analyzed immediately before the first passage (P0) as well as each subsequent passage (P1–4). Interestingly, cancer cells from one of the five patients showed changes in surface markers as follows (Fig. 6a); although most of the population was EpCAM+ at P0 and P1, approximately half became EpCAM− at P2 and 90% became EpCAM− at P3. Moreover, although most of the population was CD24+ at P0 and P1, a portion became CD24− as it became EpCAM− at P2, and most of the population became EpCAM−CD24−CD44high at P3. Given that EpCAM−CD24−CD44high is characteristic of claudin‐low subtype breast cancer (Fig. 1a), the primary breast cancer cells not only underwent EMT but also changed breast cancer subtype. To explore the details, expression levels of 17 genes whose expression profiles are used to score EMT status and subtype classification were analyzed36, 37 (Fig. 6b–d). In addition, as standards for EMT and cancer subtypes, RNAs from luminal‐like cell lines (epithelial: MCF7, T47D, and SKBR3), basal‐like cell lines (epithelial: MB468 and HCC1937), and claudin‐low cell lines (mesenchymal: MB231 and BT549) were analyzed (Fig. 6b). As the passage time increased from P0 to P4, expression levels of E‐cadherin (CDH1) and claudins (CLDN) decreased significantly, whereas that of N‐cadherin (CDH2) rapidly increased (Fig. 6b,c). Expression levels of EMT‐inducers aside from SNAIL were significantly increased (Fig. 6b,d). Interestingly, specific induction of TGF‐β1 was also observed (Fig. 6e). Moreover, clustering analysis revealed that the primary breast cancer changed from either the luminal‐like or basal‐like subtype at P0 to the claudin‐low subtype at P1–4 (Fig. 6b). Given that the EMT in HCC38 associated with both a similar subtype change (Fig. 1a) and specific expression of TGF‐β1 (Fig. 5f), cellular reprograming similar to that observed in HCC38 cells may promote EMT in primary breast cancer.
Figure 6.
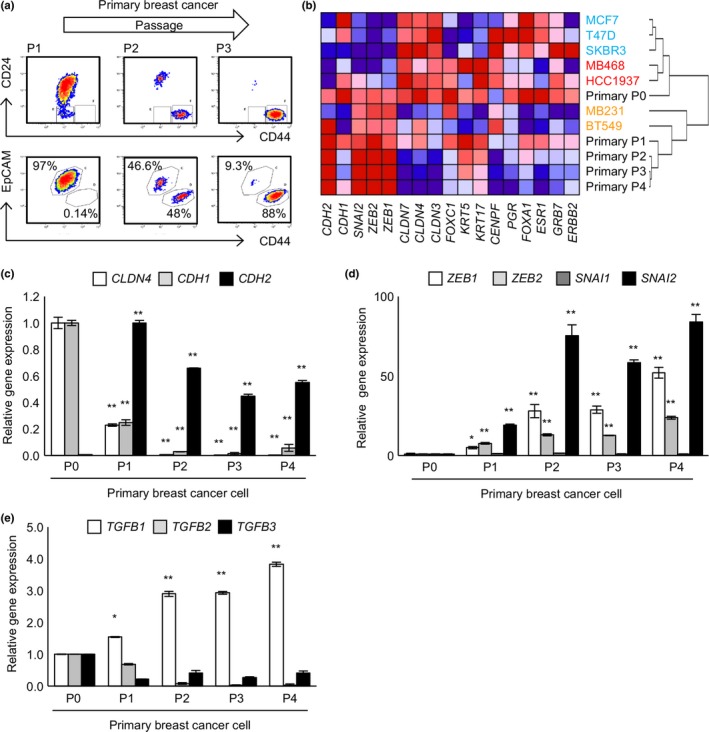
Primary breast cancer cells undergo epithelial–mesenchymal transition. Primary breast cancer cells were analyzed for surface markers (a) and gene expression profiles (b) immediately before the first passage (P0) and following each subsequent passage (P1–4). (a) Cultured primary cells were stained for CD24, CD44, and epithelial cell adhesion molecule (EpCAM). (b) Total RNA was extracted at P0–P4. Gene expression profiles were analyzed by quantitative real‐time RT‐PCR and hierarchical clustering analysis was carried out. (c–e) Quantitative real‐time RT‐PCR analyses of epithelial and mesenchymal markers (c), epithelial–mesenchymal transition‐inducers (d), and transforming growth factor‐β (TGF‐β) (e). (c–e) Data represent the mean ± SD of three independent experiments. *P < 0.05; **P < 0.01.
Discussion
Epithelial–mesenchymal transition and its reverse process, MET, are crucial in metastasis.5, 6 Epithelial–mesenchymal transition allows cancer cells to move from the primary lesion to proximal blood vessels by reducing cell–cell contact and enhancing cell migration. Given that EMT and MET are dynamic processes, mesenchymal cancer cells are likely to undergo MET transiently by interacting with other cancer cells or normal cells. Subsequently, such epithelial cancer cells could reacquire a mesenchymal phenotype through EMT before intravasation. Therefore, spatiotemporally coordinated relationships between EMT and MET could exist for the metastasis process up to intravasation and probably also the process after extravasation. It has been reported that TGF‐β and canonical and non‐canonical Wnt pathways collaborate to induce EMT in immortalized mammary epithelial cells.38 However, the molecular mechanisms for regulating bidirectional EMT–MET in breast cancer cells remain unclear. Here we identified TNBC cell line HCC38 as a simple model system, in which EMT and MET are mutually regulated, leading to an intratumoral equilibrium between epithelial and mesenchymal populations.
We would like to propose a novel model for the intratumoral regulation of the bidirectional transitions between epithelial and mesenchymal populations in HCC38 cells, in which ZEB1 and SLUG are crucial for both EMT and MET, and both epithelial and mesenchymal populations each enhance the transition of cells from the other population to their own ranks (Fig. 7). Several lines of evidence provided here support our model: (i) HCC38 maintains EpCAM+ epithelial and EpCAM− mesenchymal populations in a fixed ratio of 90/10 (Figs 1, 2); (ii) EMT occurs and this process is enhanced by mesenchymal cells (Fig. 3b,c); (iii) MET occurs and this process is enhanced by epithelial cells (Fig. 3d,e); (iv) knockdown of ZEB1 or SLUG, but not ZEB2 or SNAIL, significantly suppressed EMT (Fig. 4c); and (v) knockdown of ZEB1 or SLUG, but not ZEB2 or SNAIL, induced partial MET (Fig. 4d–f). Moreover, our results suggest involvement of critical ligand/receptor combinations in the epithelial–mesenchymal interaction. The TGF‐β signal pathway and an unidentified pathway mediated by JAK2/3 in epithelial cells could positively regulate ZEB1 expression or activate SLUG to promote EMT. In contrast, a GSK3β‐dependent pathway could negatively regulate EMT. Interestingly, inhibition of Wnt signaling did not affect EMT in HCC38 cells as distinct from immortalized mammary epithelial cells,38 suggesting that molecular mechanisms to promote EMT depend on cell characteristics such as breast cancer subtype. In HCC38 cells, various ligands expressed in mesenchymal cells could enhance EMT‐promoting pathways or inhibit EMT‐suppressing pathways. Transforming growth factor‐β1 is a strong candidate for such a ligand, because TGF‐β1, but not other TGF‐β family members, is highly expressed in mesenchymal populations of HCC38 (Fig. 5f) and specifically induced during EMT of primary breast cancer (Fig. 6e). Signal pathways that block expression of ZEB1 and SLUG need to be identified. Because ZEB1 and CD44 expression is suppressed by various microRNAs, including the miR‐200 family for ZEB139 and miR‐373 and miR‐520c for CD44,40 the signals that induce these microRNAs could be involved in promoting MET.
Figure 7.
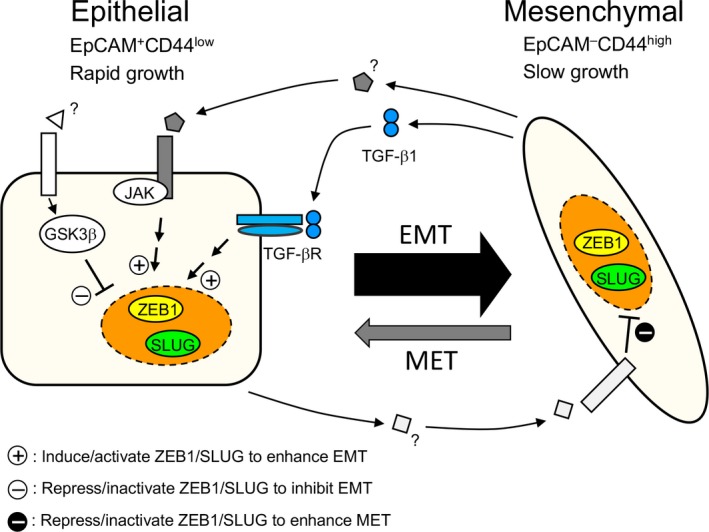
Model illustrating the intratumoral epithelial–mesenchymal transition (EMT)–mesenchymal–epithelial transition (MET) equilibrium in HCC38 breast cancer cells. EpCAM, epithelial cell adhesion molecule; GSK3β, glycogen synthase kinase 3β; SLUG, Zinc finger protein SNAI2; TGF‐β1, transforming growth factor‐β1; TGF‐βR, transforming growth factor‐β receptor; ZEB1, Zinc finger E‐box‐binding homeobox 1.
Although much more precise quantification of transition and proliferation rates are required for full explanation of the intratumoral EMT–MET equilibrium in the HCC38 cell line, it could be explained as follows (Fig. 7): the efficiency of EMT is approximately an order of magnitude higher than that of MET (Fig. 3c,e) while the proliferation of mesenchymal cells is significantly slower than that of epithelial cells (Fig. 1f). The transition rates for EMT and MET and the proliferation rates of the two populations, both of which could be affected by the sizes of the two populations, may work together to maintain the fixed ratio of the two populations.
One instance of primary breast tumors that could grow in vitro underwent EMT that was associated with a subtype change. In terms of expression profiles of surface markers and other genes related to EMT and subtype change, the EMT‐associated changes in this primary breast cancer were very similar to those observed in the HCC38 cell line (Fig. 6). These results strongly suggest that HCC38 is a suitable model to analyze the dynamics of EMT and MET that are involved in the development of TNBC. Further studies to elucidate the molecular mechanisms governing the dynamic EMT and MET observed in HCC38 must be pursued to develop effective therapeutic strategies against TNBC.
Disclosure Statement
The authors have no conflict of interest.
Abbreviations
- 7AAD
7‐amino‐actinomycin D
- DAPT
N‐[N‐(3,5‐difluorophenacetyl)‐l‐alanyl]‐S‐phenylglycine t‐butyl ester
- EMT
epithelial–mesenchymal transition
- EpCAM
epithelial cell adhesion molecule
- GSK3β
glycogen synthase kinase 3β
- IL
interleukin
- MET
mesenchymal–epithelial transition
- miR
microRNA
- PE
Phycoerythrin
- SLUG
Zinc finger protein SNAI2
- SNAIL
Zinc finger protein SNAI1
- STAT
signal transducers and activators of transcription
- TGF‐β
transforming growth factor‐β
- TNBC
triple‐negative breast cancer
- TPCA1
2‐[(aminocarbonyl)amino]‐5 ‐(4‐fluorophenyl)‐3‐thiophenecarboxamide
- ZEB1
Zinc finger E‐box‐binding homeobox 1
Supporting information
Fig. S1. Expression of epithelial and mesenchymal markers in various breast cancer cell lines.
Fig. S2. Proliferation analysis of sorted epithelial cell adhesion molecule (EpCAM)+ and EpCAM− cells.
Fig. S3. Numbers of epithelial cell adhesion molecule (EpCAM) −‐Venus cells in Culture‐1 and of EpCAM+‐Venus cells in Culture‐4.
Fig. S4. Involvement of reciprocal enhancement of bidirectional transitions between epithelial cell adhesion molecule (EpCAM)+ and EpCAM− populations.
Fig. S5. Effect of knockdown of various epithelial–mesenchymal transition‐inducers on epithelial–mesenchymal transition in HCC38 breast cancer cells.
Fig. S6. Effect of knockdown of various epithelial–mesenchymal transition‐inducers on mesenchymal–epithelial transition in unsorted HCC38 breast cancer cells.
Fig. S7. Effect of various inhibitors and an anti‐transforming growth factor‐β (TGF‐β) neutralizing antibody on epithelial–mesenchymal transition in HCC38 breast cancer cells.
Fig. S8. Neither AG‐490 nor anti‐transforming growth factor‐β (TGF‐β) antibody affected epithelial cell adhesion molecule (EpCAM)+ or EpCAM− cell proliferation.
Doc. S1. Supplementary materials and methods.
Acknowledgments
We thank A. Miyawaki for the Venus cDNA, T. Kitamura for the pMXs and Plat‐E cells, and K. Miyazaki for secretarial assistance. This work was supported in part by grants‐in‐aid from the Ministry of Education, Culture, Sports, Science, and Technology, Japan (Grant Nos. 22117002, 15H01176, and 16H06575 to J.I.) from the Japan Society for the Promotion of Science (26290036 to J.I. and 15K21438 to M.Y.), and the Extramural Collaborative Research Grant of Cancer Research Institute, Kanazawa University (28‐04 to J.I.).
Cancer Sci 108 (2017) 1210–1222
Funding Information
Ministry of Education, Culture, Sports, Science, and Technology, Japan (Grant/Award Number: 15H01176, 16H06575, 22117002); Japan Society for the Promotion of Science (Grant/Award Number: 15K21438, 26290036); Cancer Research Institute, Kanazawa University (28‐04).
References
- 1. Lamouille S, Xu J, Derynck R. Molecular mechanisms of epithelial‐mesenchymal transition. Nat Rev Mol Cell Biol 2014; 15: 178–96. [DOI] [PMC free article] [PubMed] [Google Scholar]
- 2. De Craene B, Berx G. Regulatory networks defining EMT during cancer initiation and progression. Nat Rev Cancer 2013; 13: 97–110. [DOI] [PubMed] [Google Scholar]
- 3. Peinado H, Olmeda D, Cano A. Snail, Zeb and bHLH factors in tumour progression: An alliance against the epithelial phenotype? Nat Rev Cancer 2007; 7: 415–28. [DOI] [PubMed] [Google Scholar]
- 4. Miyazono K. Transforming growth factor‐beta signaling in epithelial‐mesenchymal transition and progression of cancer. Proc Jpn Acad Ser B Phys Biol Sci 2009; 85: 314–23. [DOI] [PMC free article] [PubMed] [Google Scholar]
- 5. Heerboth S, Housman G, Leary M et al EMT and tumor metastasis. Clin Transl Med 2015; 4: 6. [DOI] [PMC free article] [PubMed] [Google Scholar]
- 6. Yu M, Bardia A, Wittner BS et al Circulating breast tumor cells exhibit dynamic changes in epithelial and mesenchymal composition. Science 2013; 339: 580–4. [DOI] [PMC free article] [PubMed] [Google Scholar]
- 7. Nieto MA, Bennett MF, Sargent MG, Wilkinson DG. Cloning and developmental expression of Sna, a murine homologue of the Drosophila snail gene. Development 1992; 116: 227–37. [DOI] [PubMed] [Google Scholar]
- 8. Smith DE, Franco del Amo F, Gridley T. Isolation of Sna, a mouse gene homologous to the Drosophila genes snail and escargot: Its expression pattern suggests multiple roles during postimplantation development. Development 1992; 116: 1033–9. [DOI] [PubMed] [Google Scholar]
- 9. Batlle E, Sancho E, Francí C et al The transcription factor snail is a repressor of E‐cadherin gene expression in epithelial tumour cells. Nat Cell Biol 2000; 2: 84–9. [DOI] [PubMed] [Google Scholar]
- 10. Cano A, Pérez‐Moreno MA, Rodrigo I et al The transcription factor snail controls epithelial‐mesenchymal transitions by repressing E‐cadherin expression. Nat Cell Biol 2000; 2: 76–83. [DOI] [PubMed] [Google Scholar]
- 11. Savagner P, Yamada KM, Thiery JP. The zinc‐finger protein slug causes desmosome dissociation, an initial and necessary step for growth factor‐induced epithelial‐mesenchymal transition. J Cell Biol 1997; 137: 1403–19. [DOI] [PMC free article] [PubMed] [Google Scholar]
- 12. Eger A, Aigner K, Sonderegger S et al DeltaEF1 is a transcriptional repressor of E‐cadherin and regulates epithelial plasticity in breast cancer cells. Oncogene 2005; 24: 2375–85. [DOI] [PubMed] [Google Scholar]
- 13. Comijn J, Berx G, Vermassen P et al The two‐handed E box binding zinc finger protein SIP1 downregulates E‐cadherin and induces invasion. Mol Cell 2001; 7: 1267–78. [DOI] [PubMed] [Google Scholar]
- 14. Perez‐Moreno MA, Locascio A, Rodrigo I et al A new role for E12/E47 in the repression of E‐cadherin expression and epithelial‐mesenchymal transitions. J Biol Chem 2001; 276: 27424–31. [DOI] [PubMed] [Google Scholar]
- 15. Wang X, Zheng M, Liu G et al Krüppel‐like factor 8 induces epithelial to mesenchymal transition and epithelial cell invasion. Cancer Res 2007; 67: 7184–93. [DOI] [PubMed] [Google Scholar]
- 16. Fernando RI, Litzinger M, Trono P, Hamilton DH, Schlom J, Palena C. The T‐box transcription factor Brachyury promotes epithelial‐mesenchymal transition in human tumor cells. J Clin Invest 2010; 120: 533–44. [DOI] [PMC free article] [PubMed] [Google Scholar]
- 17. De Craene B, Gilbert B, Stove C, Bruyneel E, van Roy F, Berx G. The transcription factor snail induces tumor cell invasion through modulation of the epithelial cell differentiation program. Cancer Res 2005; 65: 6237–44. [DOI] [PubMed] [Google Scholar]
- 18. Kume K, Haraguchi M, Hijioka H et al The transcription factor Snail enhanced the degradation of E‐cadherin and desmoglein 2 in oral squamous cell carcinoma cells. Biochem Biophys Res Commun 2013; 430: 889–94. [DOI] [PubMed] [Google Scholar]
- 19. Scheel C, Weinberg RA. Cancer stem cells and epithelial‐mesenchymal transition: Concepts and molecular links. Semin Cancer Biol 2012; 22: 396–403. [DOI] [PMC free article] [PubMed] [Google Scholar]
- 20. Mani SA, Guo W, Liao MJ et al The epithelial‐mesenchymal transition generates cells with properties of stem cells. Cell 2008; 133: 704–15. [DOI] [PMC free article] [PubMed] [Google Scholar]
- 21. Shirakihara T, Saitoh M, Miyazono K. Differential regulation of epithelial and mesenchymal markers by deltaEF1 proteins in epithelial mesenchymal transition induced by TGF‐beta. Mol Biol Cell 2007; 18: 3533–44. [DOI] [PMC free article] [PubMed] [Google Scholar]
- 22. Peinado H, Quintanilla M, Cano A. Transforming growth factor beta‐1 induces snail transcription factor in epithelial cell lines: Mechanisms for epithelial mesenchymal transitions. J Biol Chem 2003; 278: 21113–23. [DOI] [PubMed] [Google Scholar]
- 23. Miyazono K, Ehata S, Koinuma D. Tumor‐promoting functions of transforming growth factor‐β in progression of cancer. Ups J Med Sci 2012; 117: 143–52. [DOI] [PMC free article] [PubMed] [Google Scholar]
- 24. Wu ZQ, Li XY, Hu CY, Ford M, Kleer CG, Weiss SJ. Canonical Wnt signaling regulates Slug activity and links epithelial‐mesenchymal transition with epigenetic Breast Cancer 1, Early Onset (BRCA1) repression. Proc Natl Acad Sci USA 2012; 109: 16654–9. [DOI] [PMC free article] [PubMed] [Google Scholar]
- 25. Bachelder RE, Yoon SO, Franci C, de Herreros AG, Mercurio AM. Glycogen synthase kinase‐3 is an endogenous inhibitor of Snail transcription: Implications for the epithelial‐mesenchymal transition. J Cell Biol 2005; 168: 29–33. [DOI] [PMC free article] [PubMed] [Google Scholar]
- 26. Sullivan NJ, Sasser AK, Axel AE et al Interleukin‐6 induces an epithelial‐mesenchymal transition phenotype in human breast cancer cells. Oncogene 2009; 28: 2940–7. [DOI] [PMC free article] [PubMed] [Google Scholar]
- 27. Kang FB, Wang L, Jia HC et al B7‐H3 promotes aggression and invasion of hepatocellular carcinoma by targeting epithelial‐to‐mesenchymal transition via JAK2/STAT3/Slug signaling pathway. Cancer Cell Int 2015; 15: 45. [DOI] [PMC free article] [PubMed] [Google Scholar]
- 28. Hinohara K, Kobayashi S, Kanauchi H et al ErbB receptor tyrosine kinase/NF‐κB signaling controls mammosphere formation in human breast cancer. Proc Natl Acad Sci USA 2012; 109: 6584–9. [DOI] [PMC free article] [PubMed] [Google Scholar]
- 29. Kim C, Lee J, Lee W, Kim A. Changes in intrinsic subtype of breast cancer during tumor progression in the same patient. Int J Clin Exp Pathol 2015; 8: 15184–90. [PMC free article] [PubMed] [Google Scholar]
- 30. Nakamura J, Okuyama K, Sato H, Yoda Y, Kai K, Noshiro H. Repeated changes of the molecular subtype in gastric metastasis from breast cancer: A case report. Mol Clin Oncol 2016; 4: 695–8. [DOI] [PMC free article] [PubMed] [Google Scholar]
- 31. Zhao Z, Zhu X, Cui K et al In vivo visualization and characterization of epithelial‐mesenchymal transition in breast tumors. Cancer Res 2016; 76: 2094–104. [DOI] [PMC free article] [PubMed] [Google Scholar]
- 32. Barrallo‐Gimeno A, Nieto MA. The Snail genes as inducers of cell movement and survival: Implications in development and cancer. Development 2005; 132: 3151–61. [DOI] [PubMed] [Google Scholar]
- 33. Molina‐Ortiz P, Villarejo A, MacPherson M et al Characterization of the SNAG and SLUG domains of Snail2 in the repression of E‐cadherin and EMT induction: Modulation by serine 4 phosphorylation. PLoS ONE 2012; 7: e36132. [DOI] [PMC free article] [PubMed] [Google Scholar]
- 34. Virtakoivu R, Mai A, Mattila E et al Vimentin‐ERK Signaling Uncouples Slug Gene Regulatory Function. Cancer Res 2015; 75: 2349–62. [DOI] [PubMed] [Google Scholar]
- 35. Yadav A, Kumar B, Datta J, Teknos TN, Kumar P. IL‐6 promotes head and neck tumor metastasis by inducing epithelial‐mesenchymal transition via the JAK‐STAT3‐SNAIL signaling pathway. Mol Cancer Res 2011; 9: 1658–67. [DOI] [PMC free article] [PubMed] [Google Scholar]
- 36. Prat A, Parker JS, Karginova O et al Phenotypic and molecular characterization of the claudin‐low intrinsic subtype of breast cancer. Breast Cancer Res 2010; 12: R68. [DOI] [PMC free article] [PubMed] [Google Scholar]
- 37. Parker JS, Mullins M, Cheang MC et al Supervised risk predictor of breast cancer based on intrinsic subtypes. J Clin Oncol 2009; 27: 1160–7. [DOI] [PMC free article] [PubMed] [Google Scholar]
- 38. Scheel C, Eaton EN, Li SH et al Paracrine and autocrine signals induce and maintain mesenchymal and stem cell states in the breast. Cell 2011; 145: 926–40. [DOI] [PMC free article] [PubMed] [Google Scholar]
- 39. Wellner U, Schubert J, Burk UC et al The EMT‐activator ZEB1 promotes tumorigenicity by repressing stemness‐inhibiting microRNAs. Nat Cell Biol 2009; 11: 1487–95. [DOI] [PubMed] [Google Scholar]
- 40. Huang Q, Gumireddy K, Schrier M et al The microRNAs miR‐373 and miR‐520c promote tumour invasion and metastasis. Nat Cell Biol 2008; 10: 202–10. [DOI] [PubMed] [Google Scholar]
Associated Data
This section collects any data citations, data availability statements, or supplementary materials included in this article.
Supplementary Materials
Fig. S1. Expression of epithelial and mesenchymal markers in various breast cancer cell lines.
Fig. S2. Proliferation analysis of sorted epithelial cell adhesion molecule (EpCAM)+ and EpCAM− cells.
Fig. S3. Numbers of epithelial cell adhesion molecule (EpCAM) −‐Venus cells in Culture‐1 and of EpCAM+‐Venus cells in Culture‐4.
Fig. S4. Involvement of reciprocal enhancement of bidirectional transitions between epithelial cell adhesion molecule (EpCAM)+ and EpCAM− populations.
Fig. S5. Effect of knockdown of various epithelial–mesenchymal transition‐inducers on epithelial–mesenchymal transition in HCC38 breast cancer cells.
Fig. S6. Effect of knockdown of various epithelial–mesenchymal transition‐inducers on mesenchymal–epithelial transition in unsorted HCC38 breast cancer cells.
Fig. S7. Effect of various inhibitors and an anti‐transforming growth factor‐β (TGF‐β) neutralizing antibody on epithelial–mesenchymal transition in HCC38 breast cancer cells.
Fig. S8. Neither AG‐490 nor anti‐transforming growth factor‐β (TGF‐β) antibody affected epithelial cell adhesion molecule (EpCAM)+ or EpCAM− cell proliferation.
Doc. S1. Supplementary materials and methods.