

Abstract
A role for iron in carcinogenesis is supported by evidence that iron metabolism proteins are modulated in cancer progression. To date, however, the expression of iron regulatory protein‐2 (IRP2), which is known to regulate several iron metabolism proteins, has not been assessed in colorectal cancer. Expression of IRP2 was assessed by quantitative RT‐PCR and immunohistochemistry in human colorectal cancer tissue. By interrogating The Cancer Genome Atlas (TCGA) database, expression of IRP2 and transferrin receptor‐1 (TfR1) was assessed relative to common mutations that are known to occur in cancer. The impact of suppressing IRP2 on cellular iron metabolism was also determined by using siRNA and by using the MEK inhibitor trametinib. IRP2 was overexpressed in colorectal cancer compared to normal colonic mucosa and its expression was positively correlated with TfR1 expression. In addition, IRP2 expression was associated with mutations in BRAF. The MEK inhibitor trametinib suppressed IRP2 and this was associated with a suppression in TfR1 and the labile iron pool (LIP). Moreover, epidermal growth factor stimulation resulted in decreased ferritin expression and an increase in the LIP which were independent of IRP2. Results presented here suggest that ablating IRP2 provides a therapeutic platform for intervening in colorectal tumorigenesis.
Keywords: BRAF, colorectal cancer, iron, iron regulatory protein‐2, trametinib
There is an emerging body of evidence suggesting that iron is integral to tumorigenesis as exemplified by many studies demonstrating that proteins responsible for cellular iron acquisition become dysregulated in the progression of epithelial cancers.1, 2, 3, 4, 5, 6 This is best demonstrated in breast cancer, where decreased ferroportin expression is associated with a significant reduction in metastasis‐free and disease‐specific survival.3 Similarly, previous studies have highlighted changes in transferrin receptor‐1 (TfR1), ferroportin and hepcidin expression in colorectal cancer specimens.1, 5 More recently, studies have implicated iron in cancer stem cell biology. Specifically, Schonberg et al. demonstrate that iron uptake and dependence are enriched in cancer stem‐like cells and that transferrin TfR1 and ferritin are necessary for tumorigenesis.7 In the context of the colon, previous reports demonstrate that iron modulates the oncogenic Wnt signaling pathway, which is also likely to increase the number of cancer stem cells, thus accelerating tumorigenesis.8, 9 This is supported by studies demonstrating that iron chelators are inhibitors of Wnt signaling and possess anti‐neoplastic properties.10, 11
The expression of iron transport proteins is normally regulated by the iron regulatory proteins 1 and 2 (IRP 1/2), and in the context of the intestine the predominant IRP is IRP2.12, 13 Under conditions of iron excess, IRP2 is degraded and results in suppression of TfR1 and increased expression of the iron storage protein ferritin. However, such profiles are not observed in iron‐rich tumors, suggesting that the expression of these proteins may be impacted upon by other competing signaling pathways.1 Indeed, Wu et al. have reported that c‐myc can suppress ferritin as well as induce IRP2 expression.14 Similarly others have shown that c‐myc is able to directly induce TfR1 expression.15
In support of a role for IRP2 in tumorigenesis, previous studies have shown that IRP2 expression is positively associated with high grade breast cancer4 and IRP2 overexpression in vivo results in a stimulation of tumor xenografts.16 Suppression of IRP2 in a breast cancer cell line (MDA‐MB‐231) increased ferritin expression and decreased TfR1 expression and this was associated with reduced growth of MDA‐MB‐231 cells in the mouse mammary fat pad.4
In summary, cellular iron‐transport proteins are commonly dysregulated in cancer, and in the context of colorectal cancer the driver for this modification remains unclear. Thus, the aims of this study were to address whether IRP2 expression, which is central to the regulation of several of these proteins, is similarly altered in cancer and, if so, what underpins this altered expression. Understanding IRP2 regulation in colorectal cancer may facilitate the development of novel therapeutic options for patients with iron‐driven tumors.
Materials and Methods
Cell culture
RKO, SW480, HCT116 and CACO‐2 cells (ACTT) were grown in DMEM with 10% (v/v) FCS, 50 U/mL penicillin and 50 μg/mL streptomycin. HT29 cells were cultured in McCoy's 5A medium. Cell authentication was performed in October 2016 by PCR‐single‐locus‐technology (eurofins, Germany) and cells were routinely tested for mycoplasma infection (MycoAlert PLUS, Lonza, Rockland, ME, USA). Prior to experimentation, cells were seeded into 6‐well plates at a concentration of 1 × 10⁵ cells/mL and incubated for 24 h. The MEK inhibitor, trametinib (Santa‐Cruz Biotechnology, Dallas, TX, USA), was supplemented into media at concentrations of 10 nM and 1 μM. Iron (FeSO4∙7H2O) (Sigma Aldrich, Dorset, England) was supplemented at a concentration of 100 μM with sodium ascorbate (500 μM). Epidermal growth factor (EGF) was utilized at 25 ng/mL.
Western blotting
Western blotting was performed as previously described,17 with monoclonal antibodies to ferritin (1:5000; Abcam, Rabbit AB69090), β‐actin (1:5000; Abcam, Mouse AB8226) and TfR1 (1:1000; Invitrogen, Carlsbad, CA, USA H68.4). All blots were subject to densitometry analysis using ImageJ analyzing software.
Ferritin ELISA
A spectro ferritin (FTN) MT ELISA kit (Ramco Laboratories, Stafford, TX, USA) was used to determine the ferritin concentrations in cell lysates according to the manufacturer's protocol.
Patient samples
Patient tumor specimens were collected from the University of Birmingham Human Biomaterials Resource Centre (HBRC) (HBRC approval number 12‐083). The HBRC has received Research Tissue Bank ethical approval from the North West 5 Research Ethics Committee, Haydock Park (Reference number 09/H1010/75). All patients provided written consent for their tissues to be used in medical research, and for their tissues to be linked to their health records, while maintaining confidentially.
Tissue RNA extraction and cDNA generation
Matched tumor and normal tissue obtained from 41 patients with colorectal adenocarcinoma undergoing resection were homogenized in TRIzol Reagent (750 μL) using a PolyTurrax homogenizer and RNA extracted following the manufacturer's protocol. Optical density of the re‐suspended RNA was measured at 260 nm on a spectrophotometer and the concentration of RNA was calculated.
RNA extraction from cells
Cells were cultured in 6‐well plates as per experimental conditions. Following removal of media, cells homogenized in TRIzol (500 μL) and RNA extracted as above.
cDNA generation
cDNA was synthesized from RNA using a reverse transcription system (Eurogentec, Southampton, UK). RNA (1 μg) was dissolved in a total volume of 14 μL nuclease free water and of SuperScript VILO Master Mix (6 μL) (4 μL 10× SuperScript Enzyme mixed with 2 μL of 5× VILOTM Reaction Mix) (Invitrogen TM) was added. Samples were run on a thermal cycler (MyCycler; Bio‐rad, Hercules, CA, USA) at 25°C for 10 min, 42°C for 60 min and 85°C for 5 min before storage at −20°C.
Quantitative RT‐PCR
TaqMan Gene Expression Assays (Applied Biosystems, Foster City, CA, USA) were used to detect IRP2 and TfR1 mRNA expression. Master Mixes (14 μL) (ROX solution 25 μM, 0.04 μL (Bioline Reagents, London, UK), SensiMix II Probe, 7.5 μL (SensiMix II Probe Kit; Bioline Reagents) of TaqMan probe 1 μL, 18s yy probe 6.5 μM, 0.075 μL (Eurogentec), 18s primer mix 10 μM, 0.15 μL (Eurogentec) and 5.235 μL nuclease‐free water per reaction) was added to template (1 μL) in separate wells of a 96‐well plate. PCR was carried out using ABI FAST Realtime PCR and 7500 RT PCR Systems (both from Applied Biosystems) using the following cycle: 50°C for 2 min, 95°C for 10 min, 40 repeats of 95°C for 15 sec and 60°C for 1 min. Cycle threshold (ct) values were normalized relative to 18s control to give dCt. Fold changes relative to control were calculated based on 2−ddCt (where ddCt is dCT of cancer minus dCT of normal for each pair).
Immunohistochemistry
Immunohistochemistry was performed as previously reported using a modified scoring technique.18 IRP2 antibody (1:500, LS‐B675; LifeSpan BioScience, Seattle, WA, USA) was used to stain slides using automated Ventana platforms. Slides were independently scored by a consultant histopathologist based on intensity of staining (0, none; 1, mild; 2, moderate; 3, strong staining) and percentage of cells stained (0 = 0–24%, 1 = 25–49%, 2 = 50–74% and 3 = 75–100%). The assigned values were then multiplied to give a total score out of nine for each section.
IRP2 siRNA “knockdown”
IRP2 Silencer siRNA (Life Technologies, sequence: (5′–3′) GGAACAUUUUCUUCGCAGAtt; antisense UCUGCGAAGAAAAUGUUCCtg) was re‐suspended in nuclease‐free water to create a 100‐μM stock solution. A 10‐μM working stock was made using nuclease‐free water immediately prior to use. siRNA and lipofectamine 2000 were diluted in Opti‐MEM Medium (Gibco, Life Technologies, Grand Island, NY, USA) before being combined to give a final concentration of 20 pM SiRNA to lipofectamine (6 μL per 100 μL) and incubated for 5–10 mins. The working solution (250 μL) was then added and cells were harvested at 24 h. 84 Silencer Select Negative Control siRNA #1 was prepared similarly as a control. All ddCt values were calculated relative to negative control siRNA.
The Cancer Genome Atlas
The Cancer Genome Atlas (TGCA) was accessed via cbioportal.org.19, 20 Mutation and expression data were extracted for all complete colorectal tumors. Mutation status was obtained for APC, KRAS, BRAF, CMYC, PIK3CA and TP53 genes. Multivariate linear regression analyses were conducted between mutation status and mRNA expression z scores (microarray or RNAseq) using Stata 12.1.
The Cancer Genome Atlas values for a CRC‐optimized MEK activation signature (comprising DUSP6, PHLDA1, SPRY2, DUSP4 and ETV4) were employed (Dry et al., 2010). Normality of distributions was confirmed with the Anderson–Darling test in Minitab (Minitab, Coventry, UK). Pearson (R) correlations were calculated for the MEK signature against key iron‐related genes (CYBRD1, HAMP, SLC11A2, SLC40A1, TFRC and IRP2 gene) in Excel (Microsoft) for all CRC patients (n = 195) and MSS patients only (n = 134).21
Measurement of the labile iron pool
To measure the concentration of LIP, Calcein‐AM (Corning) was utilized as a fluorescent probe. Prior to experimentation, cell media was removed from the wells, and cells were washed briefly with PBS and subsequently co‐cultured with Calcein‐AM (0.0625 μM) in PBS for 15 min at 37°C. Calcein‐AM was removed from the cells, washed two times with PBS and subsequently co‐cultured with either trametinib (TB) conditioned media (10 nM), FeSO4∙7H2O supplemented media (100 μM), deferasirox (50 μM) or EGF (25 ng/mL). Cells were co‐cultured for 24 h before being trypsinized, harvested and re‐suspended in PBS (200 μL) and analyzed for mean fluorescence intensity in FL‐1 on an Accuri‐C6 flow cytometer (BD, Oxford, UK).
Results
Iron regulatory protein‐2 gene and TfRC was significantly overexpressed in colorectal adenocarcinoma
The expression levels of IRP2 and TfRC mRNA was assessed in 41 samples of colorectal adenocarcinoma using quantitative RT‐PCR (qRT‐PCR; Fig. 1). IRP2 mRNA expression was significantly elevated (mean fold change of 200) in adenocarcinoma specimens compared to matched normal mucosa (P < 0.001) (Fig. 1a). Similarly, significant TfRC overexpression (mean fold change of 314) was observed in colorectal adenocarcinoma compared to matched normal mucosa (P < 0.001) (Fig. 1b). IRP2 gene expression was positively correlated with TfRC expression (Pearson's correlation coefficient = 0.908, P < 0.001) (Fig. 1c). This data was mirrored by interrogating TGCA, where a larger number of colorectal cancer specimens (n = 195) also revealed a positive correlation between IRP2 and TfRC (Pearson's correlation coefficient = 0.523, P = 0.0001). Furthermore, interrogating this larger dataset, it was found that IRP2 expression was significantly higher in right‐sided tumors than left‐sided tumors (P < 0.05). All clinicopathological data associated with the 41 colorectal adenocarcinoma sections are detailed in Table S1.
Figure 1.
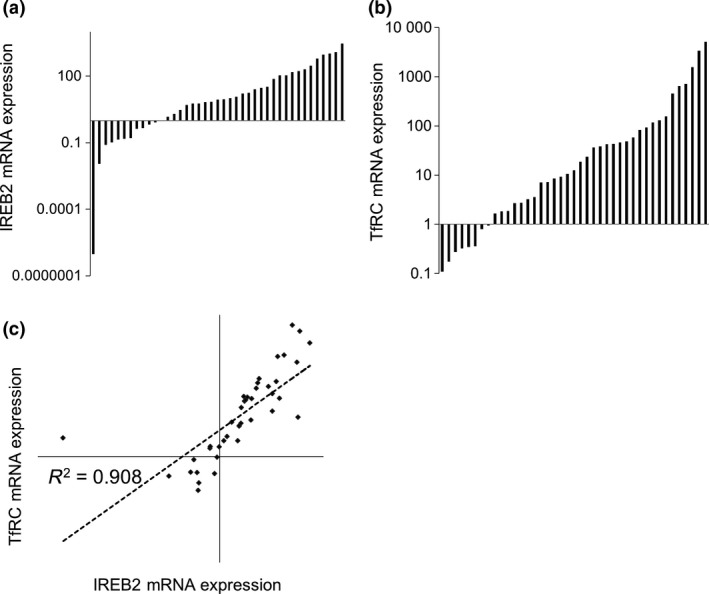
Iron regulatory protein‐2 (IRP2) and TfRC are both overexpressed in colorectal cancer compared to matched normal tissue. (a) Normalized quantitative quantitative RT‐PCR expression fold changes in colorectal adenocarcinoma IRP2 mRNA expression relative to matched normal mucosa. Mean fold change = 200.19 (P < 0.001) compared to normal mucosa, n = 41. (b) Normalized quantitative RT‐PCR expression fold changes in colorectal adenocarcinoma TfRC mRNA expression relative to matched normal mucosa. Mean fold change = 314.11 (P < 0.001) compared to normal mucosa, n = 41. (c) Spearman's rank IRP2 and TfRC mRNA expression correlation. ρ = 0.908 (P < 0.001).
To assess IRP2 localization and to semi‐quantitate IRP2 protein expression, immunohistochemistry was performed (Fig. 2). Positive immunoreactivity was observed for IRP2 in both normal (Fig. 2a–d) and cancer specimens (Fig. 2e–p), and this was largely epithelial reactivity with evidence of both nuclear and cytoplasmic reactivity. Semi‐quantitative analysis revealed greater immunoreactivity in colorectal cancer specimens compared to normal controls (median score in colorectal cancer specimens = 5 compared to median score in normal specimens = 3 (P < 0.01)). Of particular note, IRP2 immunoreactivity was greatest in tumors of a mucinous phenotype (median score in mucinous tumors = 7.5 compared to median score in other tumor types = 3.5 (P < 0.05)) (Fig. 2k,l).
Figure 2.
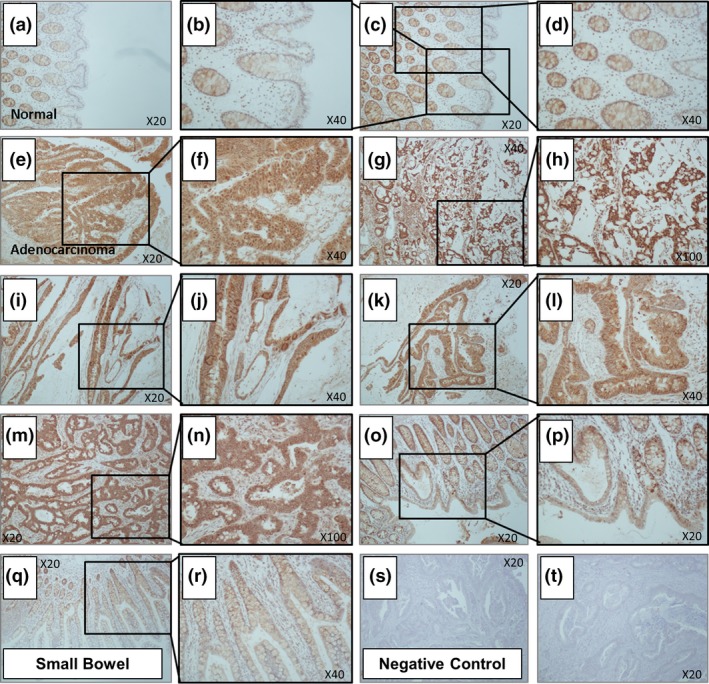
Iron regulatory protein‐2 (IRP2) protein expression is significantly increased in colorectal cancer. IRP2 immunoreactivity in (a–d) normal mucosa, (e–p) adjacent colorectal adenocarcinoma and (q, r) small bowel specimens. (s, t) Negative control sections represent no primary IRP2 antibody treated colorectal cancer sections. Tumor median score 5; normal median score 3 (χ2 = 0.004). Expression was particularly high in tumors of a mucinous phenotype (k,l) relative to all other tumors (median score 7.5; P = 0.049) and normal tissue (P = 0.0027).
Iron regulatory protein‐2 knockdown significantly reduced both transferrin receptor‐1 expression and intracellular iron concentrations while significantly increasing ferritin expression
To confirm knockdown of IRP2, expression was assessed by qRT‐PCR. IRP2 mRNA was significantly repressed after 24 h of co‐culture with siRNA (45% repression, P < 0.03) compared to control siRNA (Fig. 3a). IRP2 knockdown cells similarly showed reduced TfR1 expression at the mRNA (33.7%, P < 0.026) and protein level (60.0%, P < 0.05) compared to control (Fig. 3b,c). Of note, ferritin expression in IRP2 knockdown cells was significantly increased (98% P < 0.05) (Fig. 3d) and this was associated with decreased total cellular iron levels compared to control (97% P < 0.05) (Fig. 3e). To validate that IRP2 knockdown was responsible for these phenotype changes, and that they were not due to “off‐target” effects, alternative IRP2 siRNA were used, which also demonstrated significant inductions in ferritin protein expression and suppression in TfR1 protein expression (Fig. S1).
Figure 3.
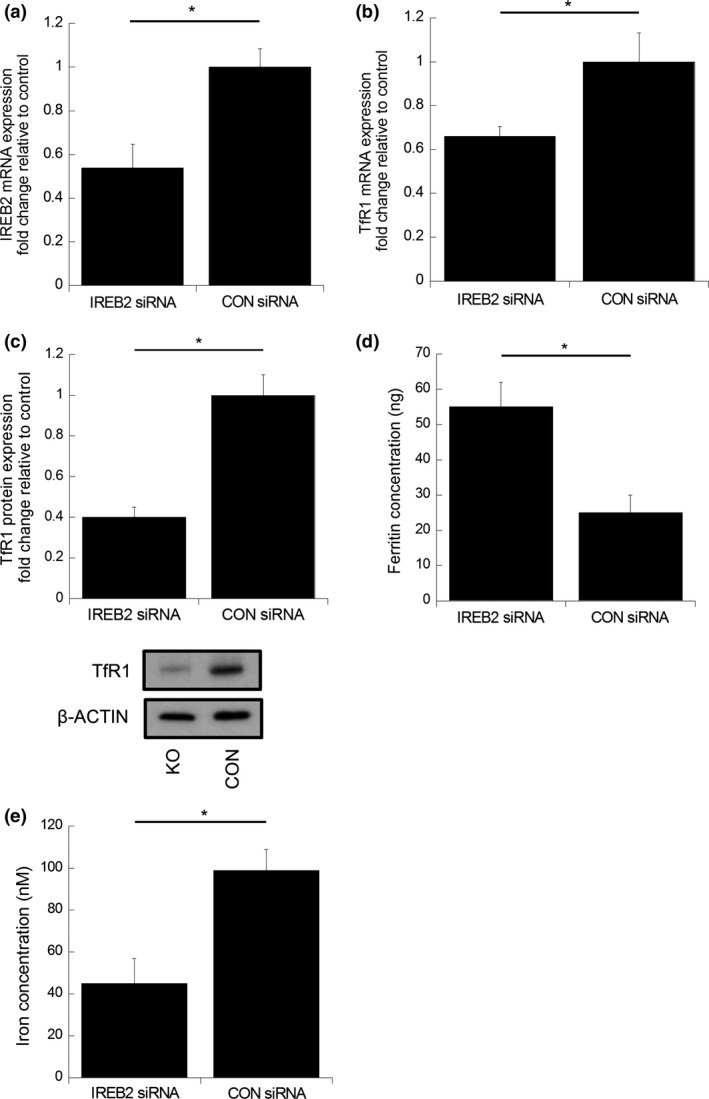
Iron regulatory protein‐2 (IRP2) silencing in a colorectal cancer cell line suppresses TfR1 expression and total cellular‐iron concentration while augmenting ferritin concentration. Normalized quantitative RT‐PCR (a) IRP2 and (b) TfRC mRNA expression in RKO cells co‐cultured with IRP2 siRNA for 24 h compared to control siRNA. Data expressed as mean fold change in mRNA expression, normalized to control siRNA cells. Error bars denote ± SEM with * representing statistical significance when P < 0.05 and n = 3. (c) TfR1 protein expression changes in RKO cells co‐cultured with IRP2 siRNA or control siRNA for 24 h. Data expressed as mean fold change in protein expression, normalized to non‐treated control cells and β‐actin loading control. Error bars denote ± SEM with P‐values representing statistical significance when P < 0.05 and n = 3. (d) Ferritin concentration determined by ELISA in RKO cells co‐cultured with IRP2 siRNA or control siRNA for 24 h. Error bars denote ± SEM with P‐values representing statistical significance when P < 0.05 and n = 6. (e) Total cellular iron concentrations in cells co‐cultured with IRP2 siRNA or control siRNA. Error bars denote ± SEM with P‐values representing statistical significance when P < 0.05 and n = 6.
BRAF mutation status in colorectal cancer is associated with increased iron regulatory protein‐2 and HEP mRNA expression
To determine whether IRP2 expression was associated with mutations known to occur in colorectal cancer, once more TCGA database was interrogated. This revealed a significant association of IRP2 with mutations in BRAF (odds ratio = 1.668 on multivariate analysis [P < 0.05]) and BRAF mutations were associated with increased HAMP expression (odds ratio = 2.54 on multivariate analysis [P < 0.05]). Because IRP2 was upregulated in BRAF mutant tumors, and BRAF is a strong driver of MEK activation, we next determined whether IRP2 upregulation was MEK‐driven. To do this, the 5‐gene CRC‐optimized MEK activation signature created by Dry and colleagues was employed; indeed, IRP2 was positively correlated with an MEK activation signature (Pearson = 0.18, P < 0.05).22 Furthermore, as expected, the MEK activation signature was significantly higher in BRAF mutant tumors compared to BRAF wild‐type tumors (P = 0.0016). This suggests that the association of IRP2 with BRAF mutation is likely due to MEK activation. Of note, HAMP expression did not reach significance when assessing its correlation with the MEK signature (Pearson = 0.140173, P = 0.05516). In addition, IRP2 remained significantly associated with the MEK signature in the microsatellite stable (MSS) subgroup (Pearson = 0.26, P < 0.01).
Inhibition of MAPK signaling in BRAF wild‐type and mutant colorectal cell lines influences TfR1 and ferritin expression
To further investigate the association between MEK activation and its impact on expression of the iron‐transport proteins, a MEK inhibitor (trametinib, TB) was utilized. Treatment of two colorectal cancer BRAF WT cell lines (HCT116 and SW480) with TB resulted in significantly decreased expression levels of p‐ERK (58% [P < 0.0001] and 66% [P < 0.005], respectively), confirming inhibition of MEK (Fig. 4a,b). In both HCT116 and SW480 cell lines, TB treatment resulted in significantly decreased IRP2 expression (48% [P < 0.0001] and 43% [P < 0.044], respectively), TfR1 expression (30% [P < 0.0007] and 35% [P < 0.0004], respectively) and significantly increased ferritin expression (250% [P < 0.003] and 130% [P < 0.0001], respectively) compared to non‐treated cells (Fig. 4a,b). Repeating these studies in the BRAF mutant cell lines (RKO and HT29), TB still significantly inhibited the expression of p‐ERK (62% [P < 0.006] and 68% [P < 0.011], respectively), IRP2 (25% [P < 0.006] and 50% [P < 0.024], respectively) and TfR1 (60% [P < 0.0001] and 45% [P < 0.0011], respectively) expression compared to non‐treated cells. In addition, ferritin expression was significantly enhanced in both cell lines following exposure to TB (310% [P < 0.0001] and 440% [P < 0.0002], respectively).
Figure 4.
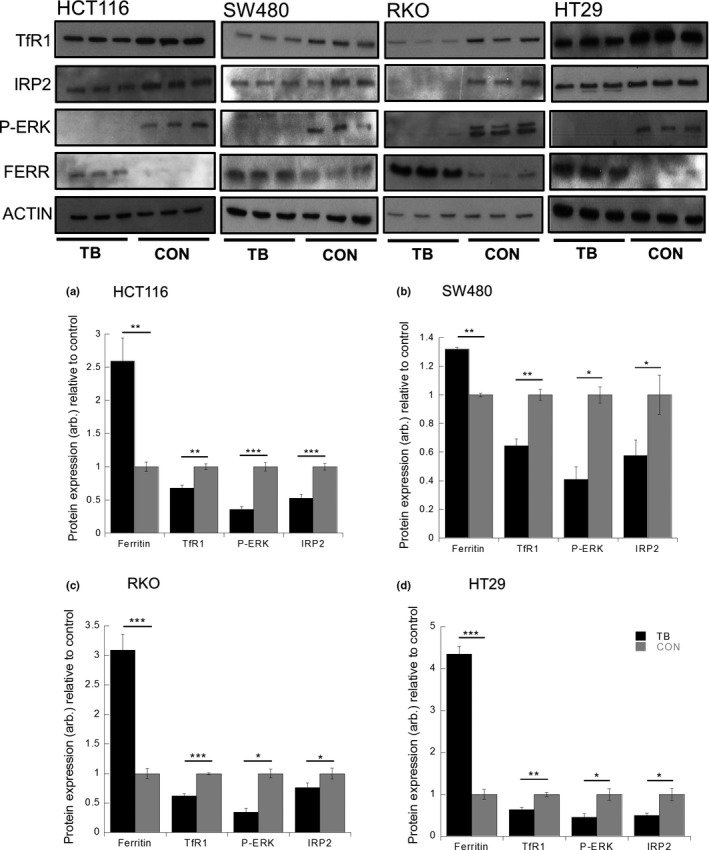
Trametinib (TB) induces ferritin expression and represses TfR1 and iron regulatory protein‐2 (IRP2) expression in colorectal cancer cell lines. Ferritin, TfR1, p‐ERK and IRP2 protein expression changes in (a) HCT116, (b) SW480, (c) RKO and (d) HT29 cells co‐cultured with or without TB (10 nM). Data expressed as mean fold change in protein expression, normalized to non‐treated control cells and β‐actin loading control. Error bars denote ± SEM with * representing statistical significance when P < 0.05 and n = 6. Arbitrary (arb.).
Inhibition of MAPK signaling with trametinib decreases the labile iron pool
Because TB impacted on the expression of the iron transport proteins (presumably through the inhibition of IRP2) we next assessed whether these changes related to a modulation in the LIP because it is this pool of iron that can be considered available and metabolically active. To determine this, we used a well‐characterized fluorescent probe that is normally quenched in the presence of iron (Fig. 5a–d). As an internal control, cells were treated with an iron chelator (Exjade, EX). An iron chelator was used to increase the observed fluorescence of the CA‐AM, with the LIP becoming diminished; such observations would act as a control, confirming the reliability of the assay. As expected, culture with deferasirox resulted in a significant diminishment in the LIP in all lines (P < 0.00001, for all lines). In addition, culture of all four cell lines (HCT116, SW480, RKO and HT29) with TB also resulted in significant suppression in the LIP, as indicated by increased fluorescence (P < 0.00001 for all lines; Fig. 5a–d).
Figure 5.
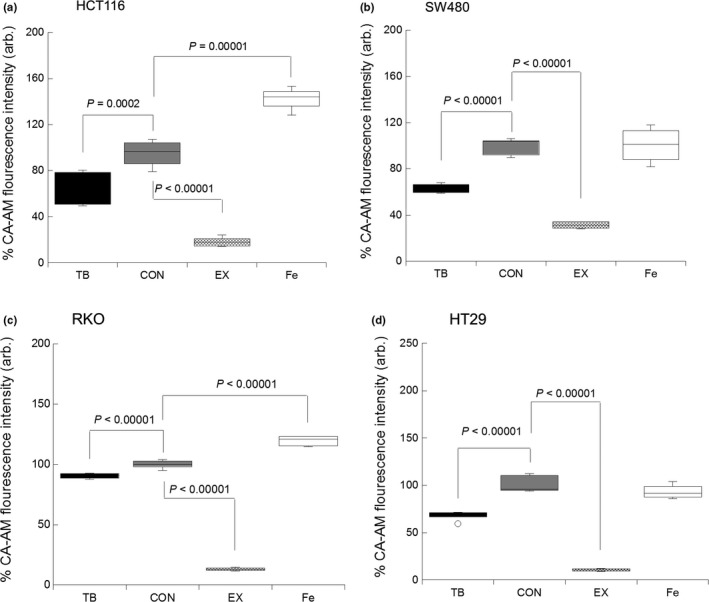
Trametinib (TB) induces a suppression in the labile iron pool (LIP) in colorectal cancer cell lines. Changes in the LIP in (a) HCT116, (b) SW480, (c) RKO and (d) HT29 cells co‐cultured with or without TB (10 nM), EX (50 μM) or iron (FeSO4·7H2O, 100 μM). Data expressed as % change in fluorescence compared to non‐treated control cells. Error bars denote ± STD with P‐values representing statistical significance when P < 0.05 and n = 6. Arbitrary (arb.).
Stimulating the MAPK/ERK pathway with EGF modulates iron metabolism independent of iron regulatory protein‐2
Because the MEK inhibitor TB impacted on the levels of total cellular iron as well as the LIP, presumably through the modulation of the expression of the various cellular iron‐metabolism proteins, we next sought to determine whether activation of the MAPK/ERK pathway would similarly modulate cellular iron metabolism (Fig. 6). These experiments were performed with CACO‐2 cells (previously described as wild type for BRAF, KRAS, PIK3CA and PTEN), which are an ideal model for assessing the effect of stimulating MAPK/ERK on iron metabolism.23 EGF stimulation resulted in ERK phosphorylation (7.5‐fold increase P < 0.05). There was no significant change in either TfR1 or IRP2 protein expression compared to control cells following EGF stimulation. Ferritin protein expression was undetectable by western blotting and, thus, a Ferritin ELISA was used, which demonstrated that EGF stimulation resulted in significant repression in ferritin expression (23%, P < 0.0008) compared to control cells (Fig. 6a). Because ferritin expression was altered we next determined the effect of EGF on the LIP (Fig. 6d). EGF stimulation resulted in a significant increase in the LIP (15%, P < 0.01) compared to control cells.
Figure 6.
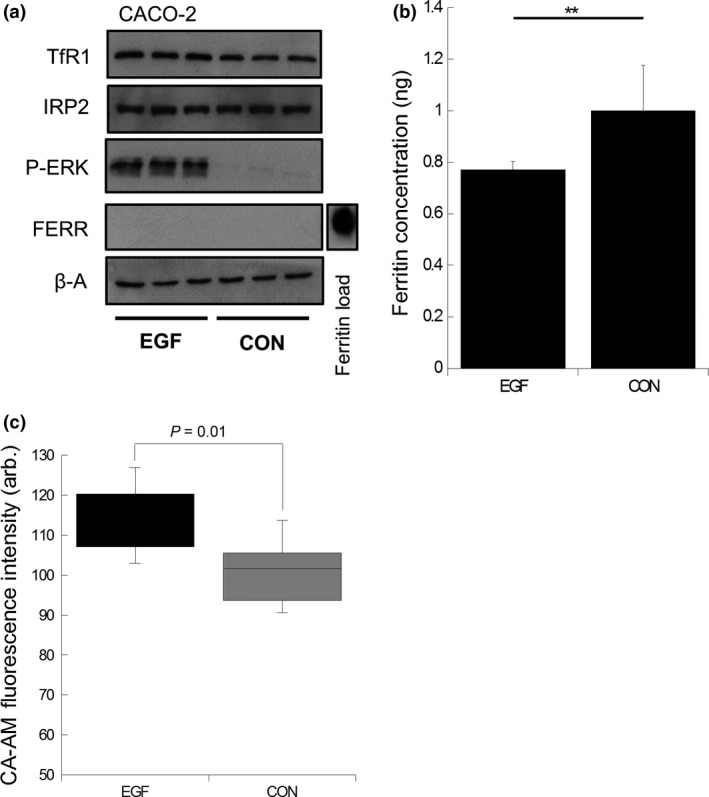
Epidermal growth factor (EGF) suppresses ferritin expression and increases labile iron pool (LIP) in CACO‐2 cells. (a) Ferritin, TfR1, p‐ERK and IRP2 expression in CACO‐2 cells co‐cultured with or without EGF (25 ng/mL). Recombinant ferritin protein used as a positive loading control to confirm antibody immunoreactivity (b). Ferritin concentration determined by ELISA in CACO‐2 cells co‐cultured with or without EGF (25 ng/mL). Data expressed as mean fold change in protein expression normalized to non‐treated control cells. Error bars denote ± SEM with * representing statistical significance when P < 0.05 and n = 6. (c) LIP changes in CACO‐2 cells co‐cultured with or without EGF (25 ng/mL). Data expressed as % change in fluorescence compared to non‐treated control cells. Error bars denote ± STD with P‐values representing statistical significance when P < 0.05 and n = 3. Arbitrary (arb.).
Discussion
In this study we show for the first time that IRP2 expression is elevated in colorectal cancers relative to normal mucosa and that its expression is tightly correlated with that of TfR1 expression. This overexpression of IRP2 and its correlation with TfR1 expression has previously been described in breast cancer.4 Most notably, Wang et al. demonstrate that increased IRP2 expression is associated with high‐grade breast cancer patients and that knockdown of IRP2 in a human breast cancer cell line increases ferritin expression and decreases TfR1 expression, resulting in a decrease in the LIP, consistent with our own observations. These observations are further supported by Maffettone et al., who elegantly show that IRP2 profoundly stimulates the growth of tumor xenografts, and these tumors exhibited high levels of TfR1, c‐myc and ERK1/2 phosphorylation.16
The mechanism behind increased IRP2 expression remains unclear. Notable candidates that have previously been reported to increase IRP2 expression are: (i) c‐myc, known to be upregulated in colorectal cancers and a target of Wnt signaling;14, 24 and (ii) hypoxia, with evidence of low intra‐tumoral oxygen tensions in colorectal cancers.25, 26 Results generated in the present study have highlighted the importance of the MAPK/ERK pathway in IRP2 regulation. In surveying the TCGA database, there was no association found between IRP2 mRNA expression and c‐myc mRNA expression but there was a strong correlation with mutations in BRAF. Moreover, by using a MEK activation signature we demonstrate that IRP2 expression was positively correlated with MEK activation, suggesting that the association of IRP2 with BRAF mutation is likely due to MEK activation. This is consistent with the observation that BRAF mutant tumors are predominantly localized on the right side of the colon and this coincides with our observation that IRP2 expression was more strongly elevated in right‐sided tumors.27
To examine this association of IRP2 with MEK activation we next sought to define whether blocking MEK with the use of the MEK inhibitor (TB) would impact on cellular iron levels and the expression of IRP2, TfR1 and ferritin (the latter two both regulated by IRP2). Trametinib consistently repressed IRP2 expression across four colorectal cell lines (two wild type and two mutant for BRaf [V600E]). IRP2 repression was accompanied by suppression of TfR1 and induction of ferritin expression. These changes resulted in a decrease in the level of the LIP. This dynamic pool of iron is considered freely exchangeable (unlike the other 95% of iron in the cell which is protein bound).28 Thus, TB treatment leads to suppression of IRP2, resulting in decreased TfR1 expression and increased ferritin expression. The net result is that there is less labile iron, which is consistent with a cell that is less metabolically active or a cell about to undergo cell death. Of particular relevance to this finding is a previous study showing that, in the context of a hepatocellular carcinoma, the MEK inhibitor sorafenib mediates cell death through the process of ferroptosis: a novel form of programmed iron mediated cell death that is distinct from apoptosis.29
Because TB modulated the expression of the iron‐metabolism machinery and, ultimately, the LIP, we next addressed the effect of stimulation of the MAPK pathway with EGF. Stimulation of CACO‐2 cells with EGF resulted in expected phosphorylation of ERK but there was no change in IRP2 or TfR1 expression. However, EGF stimulation did significantly suppress ferritin expression and this was associated with an increase in the LIP. Presumably, this decrease in ferritin is liberating iron into the LIP and the resulting increase in iron is being utilized to drive mitogenesis. It would be interesting to determine if these mitogenic effects of EGF could be negated by counteracting the ferritin suppression and or by decreasing the labile iron pool in these cell models. The latter clearly has been demonstrated by the use of iron chelators and several iron chelators have demonstrated potent anti‐neoplastic potential in other cell models.30 Interestingly, iron chelators do regulate the MAPK cascade by decreasing phosphorylation and activity of ERK1/2.31, 32 Why IRP2 and TfR1 remain unresponsive to EGF and what is causing the suppression in ferritin is unclear, although previous studies have shown that c‐myc, a target of MAPK/ERK, can negatively regulate ferritin expression.14
In summary, we have demonstrated that, in addition to the already well‐documented changes in iron transport proteins, IRP2 is also overexpressed in colorectal cancer specimens and that its overexpression is likely to explain the high levels of TfR1 observed in these samples. This is supported by our knockdown and inhibition studies, which demonstrate that when IRP2 is repressed TfR1 is similarly repressed. In the context of tumorigenesis it is clear that there will be a selective advantage in expressing high levels of IRP2 as this allows cells to behave as if they are iron deficient (high TfR1 and low ferritin expression) and, thus, only further ensures an adequate supply of iron to drive the many cellular processes which require iron and which are crucial to tumorigenesis. What underpins the upregulation of IRP2 in colorectal cancer is unclear but the strong association with BRAF mutation suggests a possible link with the MAPK/ERK pathway and that MEK inhibition results in suppression of IRP2 and its downstream effects (e.g. decreased TfR1, increased ferritin and decreased labile iron). Therapeutically, iron chelation does represent a strategy for diminishing any iron‐mediated cancer effects. However, a mechanism of ablating IRP2 may provide a platform for intervening in tumorigenesis and this may be through the use of a combination of inhibitors, including those of the MAPK/ERK pathway.
Finally, it is of note that many patients with colorectal cancer present with a systemic iron deficiency and are supplemented with oral iron, much of which remains unabsorbed and is deposited in the colon. This excess unabsorbed iron could be acting to exacerbate the disease through previously described mechanisms.7, 9 This study, however, in conjunction with previously published data, suggests that iron, in addition to mutations in BRAF, could result in the activation of the MAPK/ERK pathway and this would serve, ultimately, to increase the LIP, further fueling tumorigenesis.33
Disclosure Statement
The authors have no conflict of interest to declare.
Supporting information
Fig. S1. Verification of IRP2 silencing using pooled siRNA suppresses TfR1 protein expression and augments ferritin protein concentration.
Table S1. Clinicopathological data of the 41 tumors.
Acknowledgments
We gratefully acknowledge the contribution to this study made by the University of Birmingham's Human Biomaterials Resource Centre, which has been supported through the Birmingham Science City Experimental Medicine Network of Excellence Project.
Cancer Sci 108 (2017) 1135–1143
Funding Information
Sandwell and West Birmingham NHS Trust and the Experimental Cancer Medicine Centre Birmingham.
References
- 1. Brookes MJ, Hughes S, Turner FE et al Modulation of iron transport proteins in human colorectal carcinogenesis. Gut 2006; 55: 1449–60. [DOI] [PMC free article] [PubMed] [Google Scholar]
- 2. Miller LD, Coffman LG, Chou JW et al An iron regulatory gene signature predicts outcome in breast cancer. Cancer Res 2011; 71: 6728–37. [DOI] [PMC free article] [PubMed] [Google Scholar]
- 3. Pinnix ZK, Miller LD, Wang W et al Ferroportin and iron regulation in breast cancer progression and prognosis. Sci Transl Med 2010; 2: 43–56. [DOI] [PMC free article] [PubMed] [Google Scholar]
- 4. Wang W, Deng Z, Hatcher H et al IRP2 regulates breast tumor growth. Cancer Res 2014; 74: 497–507. [DOI] [PMC free article] [PubMed] [Google Scholar]
- 5. Ward DG, Roberts K, Brookes MJ et al Increased hepcidin expression in colorectal carcinogenesis. World J Gastroenterol 2008; 14: 1339–45. [DOI] [PMC free article] [PubMed] [Google Scholar]
- 6. Torti SV, Torti FM. Iron and cancer: More ore to be mined. Nat Rev Cancer 2013; 13: 342–55. [DOI] [PMC free article] [PubMed] [Google Scholar]
- 7. Schonberg DL, Miller TE, Wu Q et al Preferential iron trafficking characterizes glioblastoma stem‐like cells. Cancer Cell 2015; 28: 441–55. [DOI] [PMC free article] [PubMed] [Google Scholar]
- 8. Brookes M, Boult J, Roberts K et al A role for iron in Wnt signalling. Oncogene 2008; 27: 966–75. [DOI] [PubMed] [Google Scholar]
- 9. Radulescu S, Brookes MJ, Salgueiro P et al Luminal iron levels govern intestinal tumorigenesis after Apc loss in vivo. Cell Rep 2012; 2: 270–82. [DOI] [PubMed] [Google Scholar]
- 10. Song S, Christova T, Perusini S et al Wnt inhibitor screen reveals iron dependence of beta‐catenin signaling in cancers. Cancer Res 2011; 71: 7628–39. [DOI] [PubMed] [Google Scholar]
- 11. Yu Y, Gutierrez E, Kovacevic Z et al Iron chelators for the treatment of cancer. Curr Med Chem 2012; 19: 2689–702. [DOI] [PubMed] [Google Scholar]
- 12. Muckenthaler MU, Galy B, Hentze MW. Systemic iron homeostasis and the iron‐responsive element/iron‐regulatory protein (IRE/IRP) regulatory network. Annu Rev Nutr 2008; 28: 197–213. [DOI] [PubMed] [Google Scholar]
- 13. Rouault TA. The role of iron regulatory proteins in mammalian iron homeostasis and disease. Nat Chem Biol 2006; 2: 406–14. [DOI] [PubMed] [Google Scholar]
- 14. Wu K‐J, Polack A, Dalla‐Favera R. Coordinated regulation of iron‐controlling genes, H‐ferritin and IRP2, by c‐MYC. Science 1999; 283: 676–9. [DOI] [PubMed] [Google Scholar]
- 15. O'Donnell KA, Yu D, Zeller KI et al Activation of transferrin receptor 1 by c‐Myc enhances cellular proliferation and tumorigenesis. Mol Cell Biol 2006; 26: 2373–86. [DOI] [PMC free article] [PubMed] [Google Scholar]
- 16. Maffettone C, Chen G, Drozdov I et al Tumorigenic properties of iron regulatory protein 2 (IRP2) mediated by its specific 73‐amino acids insert. PLoS ONE 2010; 5: e10163. [DOI] [PMC free article] [PubMed] [Google Scholar]
- 17. Horniblow RD, Dowle M, Iqbal TH et al Alginate‐iron speciation and its effect on in vitro cellular iron metabolism. PLoS ONE 2015; 10: e0138240. [DOI] [PMC free article] [PubMed] [Google Scholar]
- 18. Boult JKR, Tanière P, Hallissey MT et al Oesophageal adenocarcinoma is associated with a deregulation in the MYC/MAX/MAD network. Br J Cancer 2008; 98: 1985–92. [DOI] [PMC free article] [PubMed] [Google Scholar]
- 19. Cerami E, Gao J, Dogrusoz U et al The cBio cancer genomics portal: An open platform for exploring multidimensional cancer genomics data. Cancer Discov 2012; 2: 401–4. [DOI] [PMC free article] [PubMed] [Google Scholar]
- 20. Gao J, Aksoy BA, Dogrusoz U et al Integrative analysis of complex cancer genomics and clinical profiles using the cBioPortal. Sci Signal 2013; 6: 11. [DOI] [PMC free article] [PubMed] [Google Scholar]
- 21. Cancer Genome Atlas Network . Comprehensive molecular characterization of human colon and rectal cancer. Nature 2012; 487: 330–7. [DOI] [PMC free article] [PubMed] [Google Scholar]
- 22. Dry JR, Pavey S, Pratilas CA et al Transcriptional pathway signatures predict MEK addiction and response to selumetinib (AZD6244). Cancer Res 2010; 70: 2264–73. [DOI] [PMC free article] [PubMed] [Google Scholar]
- 23. Ahmed D, Eide P, Eilertsen I et al Epigenetic and genetic features of 24 colon cancer cell lines. Oncogenesis 2013; 2: e71. [DOI] [PMC free article] [PubMed] [Google Scholar]
- 24. He T‐C, Sparks AB, Rago C et al Identification of c‐MYC as a target of the APC pathway. Science 1998; 281: 1509–12. [DOI] [PubMed] [Google Scholar]
- 25. Hanson ES, Foot LM, Leibold EA. Hypoxia post‐translationally activates iron‐regulatory protein 2. J Biol Chem 1999; 274: 5047–52. [DOI] [PubMed] [Google Scholar]
- 26. Goethals L, Debucquoy A, Perneel C et al Hypoxia in human colorectal adenocarcinoma: Comparison between extrinsic and potential intrinsic hypoxia markers. Int J Radiat Oncol Biol Phys 2006; 65: 246–54. [DOI] [PubMed] [Google Scholar]
- 27. Sideris M, Adams K, Moorhead J et al BRAF V600E mutation in colorectal cancer is associated with right‐sided tumours and iron deficiency anaemia. Anticancer Res 2015; 35: 2345–50. [PubMed] [Google Scholar]
- 28. Cabantchik ZI. Labile iron in cells and body fluids: Physiology, pathology, and pharmacology. Front Pharmacol 2014; 5: 45. [DOI] [PMC free article] [PubMed] [Google Scholar]
- 29. Louandre C, Ezzoukhry Z, Godin C et al Iron‐dependent cell death of hepatocellular carcinoma cells exposed to sorafenib. Int J Cancer 2013; 133: 1732–42. [DOI] [PubMed] [Google Scholar]
- 30. Lui GY, Kovacevic Z, Richardson V et al Targeting cancer by binding iron: Dissecting cellular signaling pathways. Oncotarget 2015; 6: 18748. [DOI] [PMC free article] [PubMed] [Google Scholar]
- 31. Wang J, Yin D, Xie C, et al The iron chelator Dp44mT inhibits hepatocellular carcinoma metastasis via N‐Myc downstream‐regulated gene 2 (NDRG2)/gp130/STAT3 pathway. Oncotarget 2014; 5: 8478. [DOI] [PMC free article] [PubMed] [Google Scholar]
- 32. Dixon K, Lui G, Kovacevic Z et al Dp44mT targets the AKT, TGF‐β and ERK pathways via the metastasis suppressor NDRG1 in normal prostate epithelial cells and prostate cancer cells. Br J Cancer 2013; 108: 409–19. [DOI] [PMC free article] [PubMed] [Google Scholar]
- 33. Munoz P, Zavala G, Castillo K et al Effect of iron on the activation of the MAPK/ERK pathway in PC12 neuroblastoma cells. Biol Res 2006; 39: 189–90. [DOI] [PubMed] [Google Scholar]
Associated Data
This section collects any data citations, data availability statements, or supplementary materials included in this article.
Supplementary Materials
Fig. S1. Verification of IRP2 silencing using pooled siRNA suppresses TfR1 protein expression and augments ferritin protein concentration.
Table S1. Clinicopathological data of the 41 tumors.