

Abstract
Vacuolar (H+)‐ATPases (V‐ATPases) have important roles in the supply of nutrients to tumors by mediating autophagy and the endocytic uptake of extracellular fluids. Accordingly, V‐ATPases are attractive therapeutic targets for cancer. However, the clinical use of V‐ATPase inhibitors as anticancer drugs has not been realized, possibly owing to their high toxicity in humans. Inhibition of V‐ATPase may be an appropriate strategy in highly susceptible cancers. In this study, we explored markers of V‐ATPase inhibitor sensitivity. V‐ATPase inhibitors led to pH impairment in acidic intracellular compartments, suppression of macropinocytosis, and decreased intracellular amino acid levels. The sensitivity of cells to V‐ATPase inhibitors was correlated with low cathepsin D expression, and cancer cells showed increased sensitivity to V‐ATPase inhibitors after pretreatment with a cathepsin D inhibitor and siRNA targeting the cathepsin D gene (CTSD). In addition, V‐ATPase inhibitor treatment led to the induction of the amino acid starvation response, upregulation of endoplasmic reticulum stress markers, and suppression of mammalian target of rapamycin (mTOR) signaling in cells expressing low levels of cathepsin D. Some colorectal cancer patients showed the downregulation of cathepsin D in tumor tissues compared with matched normal tissues. These findings indicate that V‐ATPase inhibitors are promising therapeutic options for cancers with downregulated cathepsin D.
Keywords: Cathepsin D, colorectal cancer, patient selection marker, V‐ATPase, vulnerability
Vacuolar (H+)‐ATPases are ATP‐dependent proton pumps with multiple subunits composed of a cytosolic V1 domain that hydrolyzes ATP and a transmembrane V0 domain that translocates protons from the cytoplasm to the lumen.1, 2 Using energy from the hydrolysis of ATP, V‐ATPases transport protons into the lumen and maintain an acidic luminal pH.3 V‐ATPases reside within various intracellular compartments, such as lysosomes, endosomes, and secretory vesicles, and function in membrane trafficking, protein processing, and protein degradation.4, 5
V‐ATPases play an important role in maintenance of the tumor acidic microenvironment and are overexpressed in a number of types of metastatic cancers.6 They are involved in autophagy7 and the endocytic uptake of extracellular fluid, which are important routes for nutrient supply to tumors.8, 9 V‐ATPase inhibitors directly inhibit macropinocytosis‐mediated FITC‐albumin uptake in lung cancer cells8 and the degradation of macropinocytosed albumin in pancreatic cancer cells.9 V‐ATPase inhibitors also reduce intracellular amino acid levels derived from serum protein catabolism10 and inhibit mTOR activation induced by amino acids.11, 12 In addition, V‐ATPase expression is induced by chemotherapeutic agents and is increased in chemoresistant cancer cells.13, 14
These previous findings indicate that V‐ATPases are attractive therapeutic targets for cancer. Indeed, several studies have shown antitumor effects of V‐ATPase inhibitors in preclinical tests.15, 16, 17, 18 However, their clinical use as anticancer drugs has not been realized, possibly owing to the high toxicity of these inhibitors in humans, as discussed by Koltai et al.19 Therefore, in cancers that are highly susceptible to V‐ATPase inhibition, this may be a useful new cancer therapeutic option. We considered that V‐ATPase inhibitors may be beneficial in certain patients, and the identification of markers for patient selection may increase the probability of clinical success. In this study, we investigated the sensitivities of various cancer cell lines to V‐ATPase inhibitors and explored markers of V‐ATPase inhibitor sensitivity.
Materials and Methods
Cell lines
Cell lines were purchased from ATCC (Manassas, VA, USA) or DS Pharma Biomedical (Osaka, Japan). Cells were maintained at 37°C in a 5% CO2 atmosphere in RPMI‐1640 (Wako, Osaka, Japan) with 10% FBS (SH30071.03; Hyclone, Logan, UT, USA).
Acridine Orange and AcidiFluor assay
The human bladder carcinoma cell line T‐24 was plated at 5000 cells/50 μL/well on collagen‐coated 384‐well plates (Corning, Corning, NY, USA) in McCoy's 5A (Gibco, Waltham, MA, USA) with 10% FBS and cultured overnight. The V‐ATPase inhibitor bafilomycin A1 (LC Laboratories, Woburn, MA, USA) was added at various concentrations ranging from 0.01 nM to 10 μM, and then 1 μM AcidiFluor ORANGE (Wako) or 0.0003% Acridine Orange (Wako) was added to the wells. Cells were incubated for 2 h, and culture medium was removed and replaced with PBS (Wako). Fluorescence (544/640 nm and 514/563 nm for the Acridine Orange and AcidiFluor assays, respectively) was detected using the SpectraMax Paradigm (Molecular Devices, Sunnyvale, CA, USA).
Macropinosome visualization and macropinocytosis assay
T‐24 cells were plated at 2500 cells/100 μL/well on collagen‐coated 96‐well plates (Corning) for macropinosome visualization and 2500 cells/25 μL/well on collagen‐coated 384‐well plates (Corning) for the macropinocytosis assay in RPMI‐1640 (Wako) with 10% FBS (35‐076‐CVR; Corning) and cultured overnight. Culture media were removed and replaced with serum‐free RPMI‐1640 (Wako) 24 h post‐seeding. After 16 h, indicated concentrations of bafilomycin A1 (Calbiochem, Darmstadt, Germany) and EIPA (Toronto Research Chemicals, Toronto, Canada) were added to the wells. After 1 h, 0.4 mg/mL TMR‐BSA (Life Technologies, Carlsbad, CA, USA) was added to the wells, and cells were incubated for 30 min. Cells were fixed with 4% paraformaldehyde (Wako). DNA in cell nuclei was stained with DAPI (Thermo Fisher Scientific, Waltham, MA, USA) for macropinosome visualization and Hoechst 33258 (Life Technologies) for the macropinocytosis assay, and cells were counted. Fluorescence was detected using the IN Cell Analyzer 6000 (GE Healthcare Life Sciences, Chicago, IL, USA). The TMR dots were counted and normalized in each well using the cell number.
Amino acid measurement by capillary electrophoresis time‐of‐flight mass spectrometry
HCT116 human colon cancer cells were plated at 7.5 × 10⁵ cells/10 mL in 10‐cm dishes (Corning). Then 3 nM bafilomycin A1 was added 24 h post‐seeding. After 8 h, the cells were washed with 5% d‐mannitol (Wako). Samples were extracted with methanol and purified with chloroform (Wako). The concentrations of amino acids were analyzed by capillary electrophoresis time‐of‐flight mass spectrometry in the laboratory of Dr. Soga (Institute for Advanced Biosciences, Keio University, Tsuruoka, Japan), as previously described.20
Cell growth assay
To test the effect of bafilomycin A1 on growth, cells were plated at either 2500 or 3000 cells/100 μL/well on 96‐well plates (Corning) in RPMI‐1640 (Wako) with 10% FBS and cultured overnight. Various concentrations of bafilomycin A1, concanamycin A (Santa Cruz Biotechnology, Santa Cruz, CA, USA), and dyphylline (synthesized as described by Zhao et al.)21 were added 24 h post‐seeding, and after 3 days, cell viability was assessed by a Cell Titer‐Glo Luminescent Cell Viability Assay (Promega, Madison, WI, USA). For the growth tests using a combination of cathepsin inhibitors and bafilomycin A1, cells were plated at either 1500 or 2000 cells/100 μL/well on 96‐well plates (Corning) in RPMI‐1640 (Wako) with 10% FBS and cultured overnight. Either 30 μM or 100 μM pepstatin A (LKT Laboratories, St. Paul, MN, USA), 10 μM E‐64‐d (Peptide Institute, Osaka, Japan), 10 μM CA‐074 (Peptide Institute), 10 μM cathepsin K inhibitor II (Merck Millipore, Darmstadt, Germany), 30 μM CAA0225 (Merck Millipore), or 10 μM cathepsin L inhibitor III (Merck Millipore) was added 24 h post‐seeding, and indicated concentrations of bafilomycin A1 were added after 24 h. After 3 days, cell viability was assessed by a Cell Titer‐Glo Luminescent Cell Viability Assay (Promega). Growth inhibition curves were plotted as percentages of control cells and GI50 values were determined using GraphPad Prism version 6 (GraphPad Software, San Diego, CA, USA) by fitting a sigmoidal curve with a variable slope.
RNA interference
For drug sensitivity experiments, cells were plated at 2000 cells/100 μL/well on 96‐well plates and transfected with 10 nM Silencer Select Predesigned siRNA targeting CTSD #1 and #2 (siCTSD s135 and s137; Thermo Fisher Scientific) or Silencer Select Negative Control siRNA #1 (Thermo Fisher Scientific) using DharmaFECT 1 Transfection Reagent (GE Dharmacon, Lafayette, CO, USA) following the manufacturer's instructions. The indicated concentrations of bafilomycin A1 were added 54 h post‐transfection, and after 3 days, cell viability was assessed with a Cell Titer‐Glo Luminescent Cell Viability Assay (Promega). For confirmation of knockdown efficiency of siCTSD, cells were plated at 6 × 10⁴ cells/2 mL/well on 6‐well plates and transfected with 10 nM siCTSD #1 and #2 or negative control siRNA in the same manner. After 48 and 72 h, cells were harvested for Western blotting.
Generation of the anti‐phospho‐Thr899‐GCN2 rabbit mAb
The antibody was generated in collaboration with Epitomics (Cambridge, MA, USA). Rabbits were immunized by repeated injections of a phospho‐GCN2 peptide (SDPSGHLpTGMVGTAC, where pT represents phosphorylated Thr) cross‐linked to keyhole limpet hemocyanin. B cells were taken from the immunized rabbits and fused with a rabbit plasmacytoma cell line. The resulting hybridomas were selected and subcloned. Antibody screening was carried out by ELISA, Western blotting, and an immunofluorescence analysis.
Western blot analysis
Cells were washed with PBS at 4°C and lysed with cell lysis buffer containing 62.5 mM Tris‐HCl (Wako), 10% glycerol (Wako), and 1% SDS (Wako). After heating at 100°C for 5 min, the protein concentration was measured using the BCA Protein Assay Kit (Thermo Fisher Scientific). Lysates were prepared with 3‐mercapto‐1,2‐propanediol (Wako) and separated by SDS‐PAGE using 7.5–15% or 5–20% SDS‐PAGE gels (Perfect NT Gel W; DRC, Tokyo, Japan). Proteins were electroblotted onto a PVDF membrane (Wako) at 75 V for 120 min and blocked with Block Ace (DS Pharma Biomedical) in PBS containing 0.2% Tween‐20 (PBS‐T) or Starting Block T20 (PBS) Blocking Buffer (Thermo Fisher Scientific). Membranes were incubated with the specific primary antibody overnight at 4°C and washed three times with PBS‐T. Membranes were incubated with an HRP‐conjugated secondary antibody (eBioscience, San Diego, CA, USA) for 1 h at room temperature, and then washed three times with PBS‐T. The immunoblots were visualized using ImmunoStar Zeta (Wako) or ImmunoStar LD (Wako). Signals were visualized using the LAS‐3000 Image Analyzer (Fujifilm, Tokyo, Japan) and quantified using Multi Gauge version 3.1 (Fujifilm). The following antibodies were used: anti‐phospho‐Thr899‐GCN2 (1:1000), anti‐β‐actin (conjugated with HRP, rabbit monoclonal, #5125, 1:5000), anti‐GCN2 (rabbit polyclonal, #3302, 1:2000), anti‐phospho‐Ser51‐eIF2α (119A11, rabbit monoclonal, #3597, 1:5000), anti‐eIF2α (D7D3 XP, rabbit monoclonal, #5324, 1:5000), anti‐phospho‐Thr389‐p70 S6K (108D2, rabbit monoclonal, #9234, 1:5000), anti‐p70 S6K (rabbit polyclonal, #9202, 1:5000), anti‐phospho‐Ser235/236‐S6 ribosomal protein (2F9, rabbit monoclonal, #4856, 1:5000), anti‐S6 ribosomal protein (54D2, mouse monoclonal, #2317, 1:5000), anti‐PERK (C33E10, rabbit monoclonal, #3192, 1:5000), anti‐ATF4 (D4B8, rabbit monoclonal, #11815, 1:5000), anti‐LC3B (D11 XP, rabbit monoclonal, #3868, 1:5000), anti‐cathepsin D (rabbit polyclonal, #2284, 1:5000), and anti‐cleaved PARP (rabbit monoclonal, #9541, 1:5000), all supplied by Cell Signaling Technology (Danvers, MA, USA).
Analysis of gene expression levels in cancer cell lines
Log2‐transformed gene expression levels of cathepsins in cancer cell lines were obtained from the Cancer Cell Line Encyclopedia (https://portals.broadinstitute.org/ccle/search/geneInfoPage).
Transcriptome analysis of colorectal tumors
Gene expression levels of CTSD in clinical colorectal tumors and their matched normal tissues were measured by the following transcriptome analysis. All samples were collected from patients with informed consent and ethics approval. Total RNA was purified from tissue derived from 39 colorectal cancer patients (41 tumor tissue and 39 normal tissue samples) using an RNeasy Mini Kit (Qiagen, Venlo, Netherlands). RNA samples were subjected to DNA microarray analysis according to a standard protocol. In brief, 100‐ng aliquots of total RNA were used for the generation of Cy3‐labeled complementary RNA, and the resulting probes were hybridized to the SurePrint G3 Human GE 8 × 60 K v2 microarray (Agilent Technologies, Santa Clara, CA, USA). The signal values were determined using Feature Extraction software (Agilent Technologies), and normalized by dividing by the trimmed mean calculated by excluding 2% of the highest and the lowest outliers of all signal values of each sample.
Statistical analyses
Statistical analyses were carried out using Student's t‐test or Williams’ test. A P‐value of less than 0.05 for the Student's t‐test and 0.025 for Williams’ test was considered statistically significant. To analyze synergistic effects, the combination index, which indicates synergy for values lower than 1.0, was determined using the Bliss Independence model as described previously by Foucquier et al.22
Results
Vacuolar (H+)‐ATPase inhibitor treatment led to pH impairment of acidic intracellular compartments, suppression of macropinocytosis, and decreased intracellular amino acid levels
Acridine Orange and AcidiFluor staining, which were observed in untreated cells, disappeared in T‐24 cells after treatment with bafilomycin A1 (Fig. 1a,b). Bafilomycin A1 also inhibited TMR‐BSA uptake in T‐24 cells as well as the macropinocytosis inhibitor EIPA (Fig. 1c). Bafilomycin A1 at concentrations greater than 10 nM suppressed Acridine Orange, AcidiFluor staining, and TMR‐BSA uptake in T‐24 cells. Bafilomycin A1 also completely blocked the growth of T‐24 cells at a concentration greater than 10 nM (Fig. 1d), suggesting that the V‐ATPase inhibitor impairs the acidic compartment, which leads to the inhibition of T‐24 cell growth. In addition, bafilomycin A1 strongly suppressed HCT116 cell growth at a concentration greater than 3 nM (Fig. 1e) and decreased amino acid levels in HCT116 cells with 3 nM bafilomycin A1 (Fig. 1f). These data suggest that the V‐ATPase inhibitor suppressed macropinocytosis as well as the associated amino acid supply and pH maintenance in acidic intracellular compartments, and hence inhibited cancer cell growth.
Figure 1.
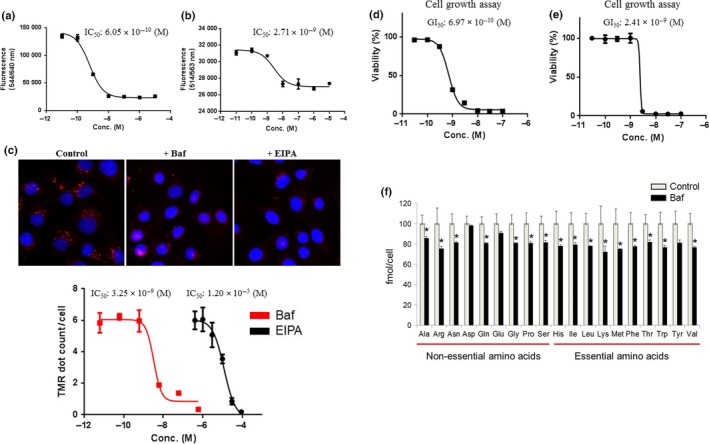
Inhibition of intracellular pH regulation, macropinocytosis, intracellular amino acid levels, and cell growth by a vacuolar (H+)‐ATPase (V‐ATPase) inhibitor. (a,b) Acridine Orange and AcidiFluor assays were undertaken in T‐24 bladder cancer cells 2 h after treatment with the indicated concentrations (Conc.) of bafilomycin A1 (n = 4). Fluorescence (544/640 nm and 514/563 nm) was designated as the Y‐axis. Data are presented as mean ± SD. (c) Macropinosome visualization was carried out with tetramethylrhodamine‐conjugated BSA (TMR‐BSA) for 30 min in T‐24 cells after 1 h pretreatment with 100 nM bafilomycin A1 (Baf) and 30 μM 5‐(N‐ethyl‐N‐isopropyl) amiloride (EIPA). TMR dots (red) show levels of macropinocytosis. The macropinocytosis assay using TMR‐BSA was carried out in the same manner with the indicated concentrations of bafilomycin A1 or EIPA (n = 4). TMR dots/cell are designated as the Y‐axis. Data are presented as the mean ± SD. (d,e) T‐24 cells and HCT116 colon cancer cells were treated with the indicated concentrations of bafilomycin A1. After 3 days, cell viability was assessed. Ordinate values were obtained by setting the control group value as 100%. Data are presented as mean ± SD (n = 3). (f) Amino acid levels were analyzed in HCT116 cells 8 h after treatment with 3 nM bafilomycin A1 using capillary electrophoresis time‐of‐flight mass spectrometry (n = 3). Ordinate values were obtained by setting the control group value as 100% and designated as the Y‐axis. Data are presented as mean ± SD. *P < 0.05, Student's t‐test.
Sensitivity to V‐ATPase inhibitors is correlated with low cathepsin D expression
We next investigated sensitive and insensitive cancer cell lines to explore markers for patient selection for treatment with V‐ATPase inhibitors. We examined whether lysosomal protease cathepsins are involved in sensitivity to lysosomal inhibitors. Most cathepsins are activated in low pH conditions in lysosomes and hence are known as lysosomal markers.23 Cathepsins participate in endolysosomal proteolysis as proteases involved in the degradation of protein waste and the recycling of proteins into amino acids;24, 25 accordingly, these proteases may be affected by the inhibition of macropinocytosis and the maintenance of intracellular amino acids in response to V‐ATPase inhibitors. We examined the gene expression levels of cathepsins in cancer cell lines from the public database Cancer Cell Line Encyclopedia (Table 1). We also tested the effects of several V‐ATPase inhibitors (bafilomycin A1, concanamycin A, and dyphylline) on the growth of various cancer cell lines and calculated the 50% growth inhibition values (GI50) of these compounds (Table 1). We examined the correlations between the expression levels of cathepsin genes and the GI50 of V‐ATPase inhibitors (Table 2). We found the highest correlation between the expression level of CTSD, which encodes cathepsin D, and the GI50 of V‐ATPase inhibitors. For example, RKO human colon cancer cells and HCT116 cells, which express CTSD at low levels, were more susceptible to bafilomycin A1, concanamycin A, and dyphylline than RCC4‐vec and RCC4‐VHL cells, which show high CTSD expression levels (Fig. 2a–c).
Table 1.
Log2‐transformed gene expression levels (Cancer Cell Line Encyclopedia; CCLE) and log2 50% growth inhibition values of vacuolar (H+)‐ATPase (V‐ATPase) inhibitors in various cell lines
| Cell lines | Tissue | Log2‐transformed gene expression levels (CCLE) | Log2‐GI50 of V‐ATPase inhibitors | ||||||||||||||||
|---|---|---|---|---|---|---|---|---|---|---|---|---|---|---|---|---|---|---|---|
| CTSA | CTSB | CTSC | CTSD | CTSE | CTSF | CTSG | CTSH | CTSK | CTSL | CTSO | CTSS | CTSV | CTSW | CTSZ | Baf | Con | Dyp | ||
| RKO | Colon | 10.30 | 8.30 | 11.03 | 6.04 | 4.77 | 5.05 | 5.07 | 9.18 | 5.60 | 11.27 | 4.59 | 4.35 | 8.39 | 5.32 | 7.83 | −9.20 | −9.88 | −6.46 |
| HCT116 | Colon | 10.33 | 9.29 | 9.42 | 6.89 | 4.32 | 4.78 | 4.25 | 8.13 | 5.18 | 9.71 | 4.43 | 4.27 | 9.18 | 4.98 | 7.85 | −8.83 | −9.61 | −6.19 |
| HCT15 | Colon | 10.33 | 9.14 | 9.08 | 7.34 | 4.54 | 5.18 | 4.49 | 10.68 | 5.98 | 9.19 | 4.59 | 4.27 | 8.80 | 5.42 | 8.11 | −8.79 | −9.20 | −5.65 |
| ACHN | Kidney | 10.79 | 9.04 | 11.61 | 7.51 | 4.63 | 5.01 | 4.43 | 8.84 | 6.30 | 9.76 | 7.25 | 5.72 | 7.89 | 5.04 | 6.47 | −8.72 | −9.63 | −5.70 |
| PATU8988T | Pancreas | 10.51 | 9.27 | 10.23 | 9.03 | 11.21 | 6.81 | 4.66 | 7.59 | 5.65 | 10.43 | 6.39 | 4.43 | 9.79 | 5.26 | 9.10 | −8.92 | −9.87 | −5.13 |
| PATU8902 | Pancreas | 10.16 | 9.36 | 10.42 | 9.98 | 4.76 | 5.08 | 4.49 | 8.00 | 5.30 | 9.36 | 5.77 | 3.81 | 8.64 | 5.02 | 8.54 | −9.13 | −9.69 | −6.43 |
| MIAPACA2 | Pancreas | 11.08 | 9.79 | 11.82 | 8.92 | 4.28 | 5.05 | 4.60 | 10.22 | 7.39 | 10.26 | 4.82 | 4.22 | 9.08 | 5.03 | 7.12 | −8.10 | −8.51 | −5.93 |
| NCI‐H661 | Lung | 11.08 | 10.82 | 7.75 | 6.71 | 4.66 | 5.93 | 4.59 | 8.73 | 5.56 | 9.82 | 5.60 | 5.25 | 10.84 | 4.84 | 6.00 | −8.85 | −9.68 | −6.29 |
| A498 | Kidney | 12.53 | 10.48 | 10.89 | 10.21 | 4.49 | 6.56 | 4.42 | 11.36 | 5.62 | 12.24 | 8.49 | 7.01 | 8.92 | 5.44 | 8.27 | −8.90 | −9.56 | −6.33 |
| 786O | Kidney | 11.21 | 9.12 | 9.71 | 8.38 | 4.43 | 4.92 | 4.29 | 7.16 | 5.84 | 10.70 | 5.52 | 7.30 | 9.15 | 5.40 | 10.38 | −8.96 | −9.96 | −5.53 |
| A549 | Lung | 10.12 | 9.97 | 9.59 | 7.62 | 4.56 | 6.67 | 4.64 | 8.96 | 5.50 | 11.34 | 4.73 | 6.40 | 8.55 | 5.16 | 6.28 | −8.96 | −9.60 | −5.50 |
| NCI‐H1734 | Lung | 10.41 | 10.42 | 10.66 | 7.35 | 4.28 | 6.12 | 3.87 | 9.60 | 6.60 | 10.11 | 7.39 | 10.04 | 9.31 | 4.92 | 7.37 | −8.83 | −9.72 | −5.78 |
| NCI‐H226 | Lung | 10.13 | 10.10 | 9.70 | 7.10 | 4.54 | 5.30 | 4.53 | 9.47 | 5.88 | 10.49 | 6.87 | 4.14 | 6.67 | 5.19 | 8.36 | −8.68 | −9.70 | −5.91 |
| NCI‐H1703 | Lung | 10.50 | 8.78 | 8.81 | 6.83 | 4.19 | 5.66 | 4.57 | 5.92 | 7.13 | 10.45 | 6.54 | 4.14 | 9.51 | 4.87 | 4.28 | −8.88 | −9.52 | −5.59 |
| BXPC3 | Pancreas | 10.88 | 10.48 | 10.68 | 8.43 | 8.67 | 5.40 | 4.36 | 12.64 | 5.14 | 10.01 | 4.62 | 8.77 | 9.02 | 5.22 | 8.52 | −8.93 | −9.49 | >−5.00 |
| NCI‐H2228 | Lung | 10.82 | 10.20 | 11.51 | 9.54 | 4.61 | 6.41 | 4.36 | 10.41 | 5.64 | 11.55 | 8.87 | 9.08 | 7.76 | 4.73 | 7.74 | −8.80 | −9.57 | −5.92 |
| HCC4006 | Lung | 9.33 | 8.65 | 9.16 | 7.64 | 4.46 | 6.21 | 4.10 | 12.31 | 5.31 | 8.73 | 7.65 | 6.18 | 9.32 | 4.94 | 10.56 | −9.13 | −9.76 | −6.37 |
| CAKI2 | Kidney | 11.72 | 9.57 | 11.90 | 10.63 | 4.51 | 4.91 | 4.45 | 9.76 | 5.26 | 10.58 | 8.87 | 4.24 | 7.55 | 5.22 | 10.40 | −8.73 | −9.21 | >−5.00 |
| PANC1 | Pancreas | 10.77 | 9.40 | 10.16 | 9.58 | 4.78 | 6.52 | 4.41 | 10.11 | 5.70 | 9.36 | 5.63 | 5.05 | 9.27 | 5.22 | 7.20 | −8.01 | −8.17 | −5.82 |
| RCC4 | Kidney | 11.66 | 11.01 | 10.51 | 11.13 | 4.53 | 7.60 | 4.56 | 9.00 | 5.57 | 10.68 | 7.58 | 4.63 | 9.33 | 5.41 | 8.82 | −8.15 | −8.95 | −5.06 |
Baf, bafilomycin A1; Con, concanamycin A; Dyp, dyphylline.
Table 2.
Correlation coefficient of cathepsin gene expression levels and log2 50% growth inhibition values of vacuolar (H+)‐ATPase inhibitors
| Baf | Con | Dyp | |
|---|---|---|---|
| CTSD | 0.42 | 0.43 | 0.35 |
| CTSA | 0.36 | 0.28 | 0.28 |
| CTSB | 0.34 | 0.17 | 0.22 |
| CTSC | 0.25 | 0.24 | 0.23 |
| CTSK | 0.36 | 0.27 | 0.02 |
| CTSF | 0.26 | 0.17 | 0.19 |
| CTSW | 0.12 | 0.13 | 0.32 |
| CTSH | 0.08 | 0.25 | −0.08 |
| CTSE | −0.16 | −0.18 | 0.45 |
| CTSS | 0.04 | −0.08 | 0.11 |
| CTSG | 0.00 | 0.05 | −0.02 |
| CTSZ | −0.16 | −0.15 | 0.14 |
| CTSO | 0.02 | 0.05 | −0.08 |
| CTSL | −0.09 | −0.19 | 0.08 |
| CTSV | −0.19 | −0.25 | 0.10 |
Baf, bafilomycin A1; Con, concanamycin A; Dyp, dyphylline.
Figure 2.
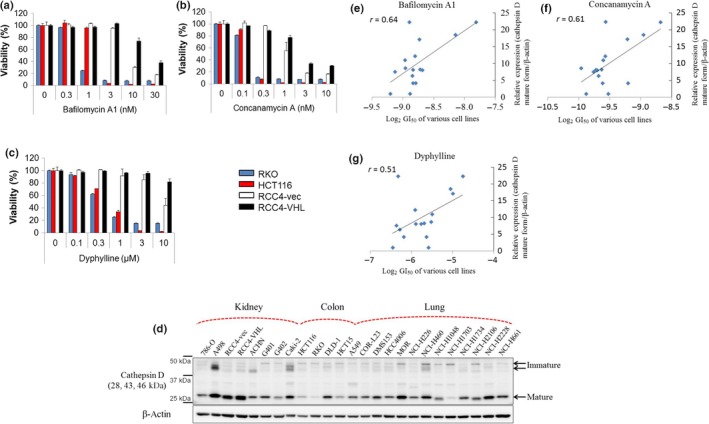
Correlation between gene expression levels of cathepsin D and sensitivities to vacuolar (H+)‐ATPase inhibitors. (a–c) Cells expressing low levels of cathepsin D (RKO and HCT116 human colon cancer cells) and high levels of cathepsin D (RCC4 renal cell carcinoma cells plus vector alone [RCC4‐vec] and RCC4 plus Von Hippel–Lindau [RCC4‐VHL] cells) were treated with the indicated concentrations of bafilomycin A1, concanamycin A, and dyphylline. After 3 days, cell viability was assessed. Ordinate values were obtained by setting the control group value as 100%. Data are presented as mean ± SD. (d) Protein expression levels of cathepsin D and β‐actin in various cancer cell lines were determined by Western blot analysis. (e–g) Correlation between relative cathepsin D expression levels (cathepsin D mature form/β‐actin) and sensitivities of various cell lines to the vacuolar (H+)‐ATPase inhibitors bafilomycin A1, concanamycin A, and dyphylline (log2 50% growth inhibition values).
We next examined the correlations between cathepsin D protein expression in various cell lines and the sensitivity of these cells to V‐ATPase inhibitors (Fig. 2d). Cathepsin D protein expression levels were strongly negatively correlated with sensitivities to bafilomycin A1, concanamycin A, and dyphylline, with correlation coefficients of 0.64, 0.61, and 0.51, respectively (Fig. 2e–g). These results suggest that a low level of cathepsin D expression is a marker of V‐ATPase inhibitor sensitivity.
Pretreatment with cathepsin D inhibitors or CTSD knockdown sensitized cancer cells to the V‐ATPase inhibitor
Based on the observed correlation between lower cathepsin D expression and the sensitivity to V‐ATPase inhibitors, we examined whether cathepsin D inhibitors affect cancer cell growth. We pretreated V‐ATPase inhibitor‐insensitive RCC4‐vec cells with pepstatin A, an inhibitor of cathepsin D,26 followed by treatment with bafilomycin A1. Growth inhibition of RCC4‐vec cells by bafilomycin A1 was significantly greater for cells pretreated with pepstatin A than for cells that were not pretreated (Fig. 3a). Based on analyses of bafilomycin A1 and pepstatin A at various concentrations, they had synergistic effects, as evidenced by the combination index <1.0 (Fig. 3a). Pretreatment with pepstatin A also slightly enhanced the sensitivity of V‐ATPase inhibitor‐sensitive RKO cells to bafilomycin A1 (Fig. 3b). Furthermore, its effect was confirmed by the synergistic cytotoxicity of CTSD knockdown and bafilomycin A1 in RCC4‐vec cells as evidenced by the combination index <1.0 (Fig. 3c,d). These results suggest that low cathepsin D activity is a marker for V‐ATPase inhibitor sensitivity.
Figure 3.
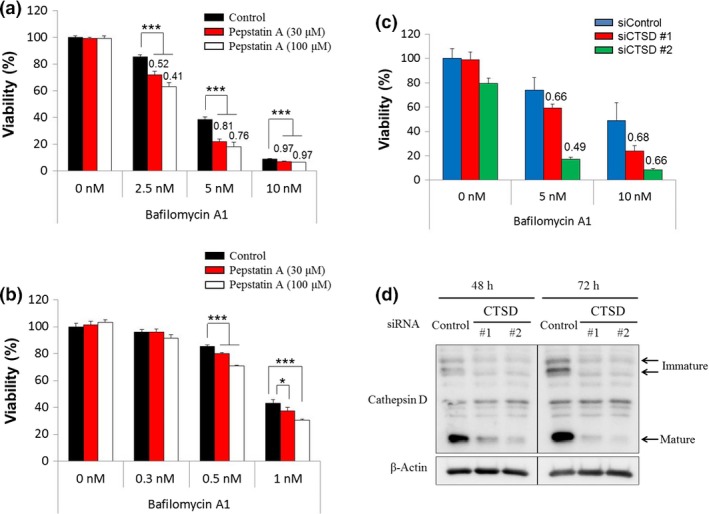
Enhanced growth inhibition effect of the vacuolar (H+)‐ATPase inhibitor by pretreatment with a cathepsin D inhibitor or CTSD knockdown. (a,b) RCC4 renal cell carcinoma cells plus vector alone (RCC4‐vec) and RKO colon cancer cells were treated with the indicated concentrations of pepstatin A. After 1 day, these cells were treated with the indicated concentrations of bafilomycin A1. After 3 days, cell viability was assessed. Ordinate values were obtained by setting the control group value as 100%. Data are presented as mean ± SD (n = 3). *P < 0.025; **P < 0.005; ***P < 0.0005, Williams’ test. Each number indicates the combination index; synergistic effects of pepstatin A and bafilomycin A1 are indicated for values <1.0. (c) RCC4‐vec cells were treated with siRNA targeting CTSD #1 and #2 or negative control siRNA (siControl). After 54 h, cells were treated with the indicated concentrations of bafilomycin A1. After 3 days, cell viability was assessed. Ordinate values were obtained by setting the control group value as 100%. Data are presented as mean ± SD (n = 3) (d) RCC4‐vec cells transfected with siRNA targeting CTSD #1 and #2 or control siRNA were lysed after 48 and 72 h, and expression levels of CTSD and β‐actin were determined by Western blot analysis.
Vacuolar (H+)‐ATPase inhibitors induce AAR, upregulate ER stress markers, and suppress mTOR signaling in cancer cells with low cathepsin D levels
Our data suggested that cancer cell sensitivity to V‐ATPase inhibitors is dependent on the cathepsin D expression level. We next investigated the intracellular amino acid and protein degradation responses to V‐ATPase inhibitors in sensitive and insensitive cancer cell lines. Several studies have reported that GCN2 and eIF2α are phosphorylated by the binding of uncharged tRNAs to GCN2 and stimulate its dimerization, referred to as the AAR.27, 28, 29 We found increased phosphorylation of GCN2 (T899) and eIF2α (S51) in response to bafilomycin A1 in V‐ATPase inhibitor‐sensitive RKO cells than in V‐ATPase inhibitor‐insensitive RCC4‐vec cells (Fig. 4). It is also well known that insufficient protein degradation leads to the accumulation of misfolded proteins at the ER, and this is called ER stress.30 We detected a gel mobility shift of PERK, an ER stress marker, suggesting the activation of PERK due to the autophosphorylation and induction of the downstream factor ATF4 in response to bafilomycin A1 treatment in V‐ATPase inhibitor‐sensitive RKO cells (Fig. 4). These results suggest that ER stress was induced by bafilomycin A1 in RKO cells.
Figure 4.
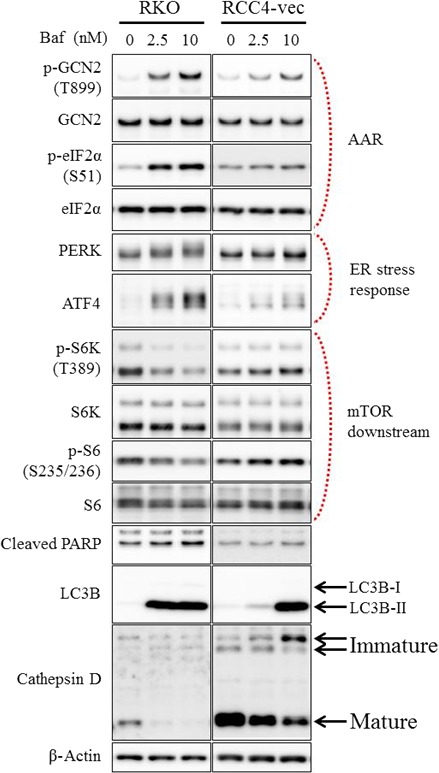
Induced amino acid starvation response (AAR), upregulated endoplasmic reticulum (ER) stress, and suppressed mammalian target of rapamycin (mTOR) signaling in cells expressing low levels of cathepsin D in response to a vacuolar (H+)‐ATPase inhibitor. Expression levels of various proteins were determined by Western blot analysis in RKO colon cancer cells and RCC4 renal cell carcinoma cells plus vector alone (RCC4‐vec) after treatment with the indicated concentrations of bafilomycin A1 for 24 h. ATF4, activating transcription factor 4; eIF2α, eukaryotic initiation factor 2α; GCN2, general control nonderepressible 2; LC3, light chain 3; PARP, poly(ADP‐ribose) polymerase; PERK, protein kinase RNA‐like ER kinase; S6K, ribosomal protein S6 kinase.
mTOR signaling is downregulated following amino acid deprivation, and V‐ATPase is then necessary to activate mTOR complex 1.11, 31, 32 Therefore, we investigated mTOR downstream molecules in cells treated with V‐ATPase inhibitors. Bafilomycin A1 clearly impaired the phosphorylation of ribosomal protein kinase S6K (T389) and ribosomal protein S6 (S235/236) in V‐ATPase inhibitor‐sensitive RKO cells (Fig. 4). Cleaved PARP, a marker of apoptosis induction, was induced more clearly in RKO cells, which were more susceptible to intracellular stress in response to bafilomycin A1, than in RCC4‐vec cells (Fig. 4). Because LC‐3 is delivered to lysosomes for degradation, lysosomal inhibitors inhibit autophagosome–lysosome fusion and the degradation of LC3‐II, which results in autophagy inhibition and the accumulation of LC3‐II.33 The autophagy marker LC3B‐II was induced by bafilomycin A1 more clearly in RKO cells at a lower concentration than in RCC‐vec cells, suggesting autophagy is inhibited by bafilomycin A1 in RKO cells (Fig. 4). Interestingly, the levels of the mature form of cathepsin D were attenuated by bafilomycin A1 treatment at the cell growth inhibitory concentration in both cells (Fig. 4), implying that the downregulation of cathepsin D is important for cell growth inhibitory effects of V‐ATPase inhibitors.
Some colorectal cancer patients showed cathepsin D downregulation in tumors
We next investigated whether a fraction of cancer patients have tumors that harbor downregulated levels of CTSD. Overall, CTSD mRNA expression levels were significantly lower in colon tumor tissues than in normal tissues (Fig. 5a). Compared with matched paired samples, 34 of 39 tumors (87%) of colorectal cancer patients showed downregulated CTSD mRNA levels (Fig. 5b).
Figure 5.
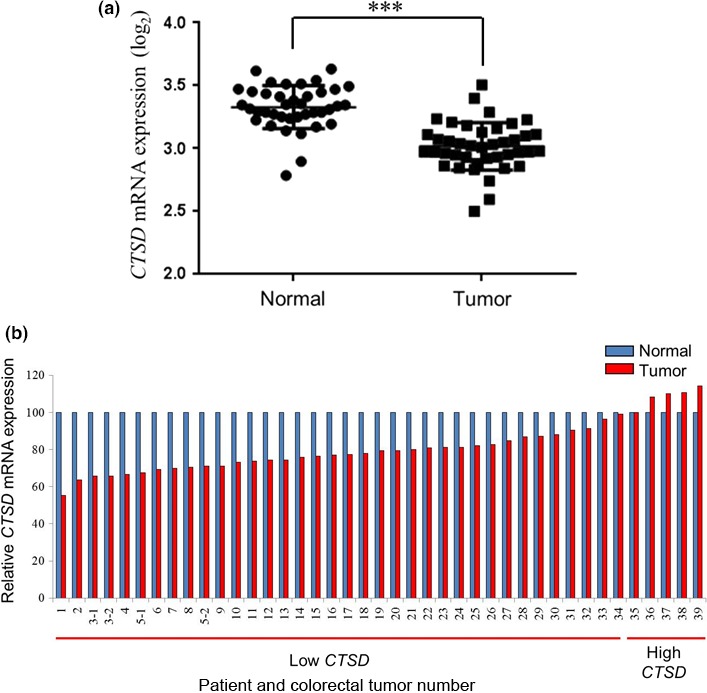
Downregulated cathepsin D gene expression levels in colorectal tumors compared with matched normal tissues. (a) CTSD mRNA expression levels (log2) of clinical colorectal tumor tissues (n = 41) and their matched normal tissues (n = 39) were quantified by a transcriptome analysis. Data are presented as mean ± SD. ***P < 0.00001, Student's t‐test. (b) CTSD mRNA expression levels of the clinical colorectal tumor relative to those of the matched normal tissue, determined by setting the normal tissue value as 100%, were divided into two groups, that is, low and high CTSD expression in tumor tissues.
Discussion
We showed that Acridine Orange and AcidiFluor, which accumulate in acidic intracellular compartments,34 were inhibited by bafilomycin A1, in agreement with the inhibitory effects on macropinocytosis, intracellular amino acids, and cell growth. These results imply that the loss of activity in acidic intracellular compartments in response to bafilomycin A1 may impair the degradation of macropinocytosed BSA and further uptake of BSA, affecting nutrient supply, including the supply of intracellular amino acids, and leading to the inhibition of cancer cell growth.
We found that cancer cell lines with low cathepsin D expression were sensitive to several V‐ATPase inhibitors. In addition, V‐ATPase inhibitors led to the induction of AAR, elicitation of ER stress, and suppression of mTOR signaling more strongly in cells expressing low levels of cathepsin D than in those with high cathepsin D expression. Cathepsin D is a soluble lysosomal aspartic endopeptidase that functions in the clearance of proteins. The decreased levels of the mature form of cathepsin D in response to bafilomycin A1, shown in Figure 4, imply that the downregulation of cathepsin D is not only a potential selection marker, but also a mechanism of cell growth inhibition by V‐ATPase inhibitors.
Cathepsin D is a multifunctional protein involved in cancer invasion and metastasis by mediating the intracellular degradation of matrix proteins and apoptosis;35, 36 it also functions to protect cells from apoptotic cell death induced by oxidative stress through autophagy activation or the degradation of damaged mitochondria when autophagy is impaired.37, 38 V‐ATPase inhibitors block the late stages of autophagy by interfering with the fusion of autophagosomes with endosomes and lysosomes.39 This is consistent with our results showing that LC3B‐II is induced by bafilomycin A1 (Fig. 4). Our data also showed that V‐ATPase inhibitors induce the dysfunction of intracellular compartments, and this may lead to the activation of AAR and induction of ER stress pathways in cells expressing low levels of cathepsin D. We hypothesized that when cathepsin D is highly active, cellular stress induced by V‐ATPase inhibitors might be diminished by cathepsin D, including the activation of autophagy or clearance of damaged compartments. Our data showed that the cathepsin D inhibitor pepstatin A and CTSD knockdown increase the cell growth inhibition induced by bafilomycin A1, and this finding is supported by a previous report showing that pepstatin A inhibits cell growth when essential amino acids are depleted.12
Cathepsin D is overexpressed in several cancer types and is considered to be involved in cancer progression and metastasis,35, 40 especially in breast cancer because estrogen induces cathepsin D.41 However, patients with cathepsin D‐negative colorectal adenocarcinoma show a worse prognosis, suggesting the need for therapeutic strategies for low cathepsin D‐expressing tumors.42 This finding is reasonable because cathepsin D induces apoptosis as a tumor suppressor, either directly or in response to several stimuli.43, 44, 45, 46, 47 Our data indicated that cathepsin D is actually downregulated in colorectal tumors compared with matched normal tissues, and a previous report has shown that 58% of colorectal tumors are negative for cathepsin D,42 suggesting that many patients with colorectal cancer can benefit from V‐ATPase inhibitors using cathepsin D expression, as evaluated by immunohistochemistry, as a marker for patient selection.48 In this study, we focused on the relationship between cathepsin D levels and susceptibility to V‐ATPase inhibitors. However, other cathepsins may also be involved in V‐ATPase inhibitor sensitivity, as we found that several cathepsin inhibitors, including the cathepsin B, H, and L inhibitor E‐64‐d, cathepsin B inhibitor CA‐074, cathepsin K inhibitor II, cathepsin L inhibitor CAA0225, and cathepsin L inhibitor III, also enhanced the growth inhibition effect induced by the V‐ATPase inhibitor bafilomycin A1 in RCC4‐vec cells, and those effects were synergistic as evidenced by the combination index <1.0 (Fig. S1). It is necessary to elucidate which cathepsin is the most sensitive marker for treatment with V‐ATPase inhibitors, and the underlying biological mechanism, in future studies.
In this study, we found that cancer cells with downregulated cathepsin D expression are highly susceptible to V‐ATPase inhibitors, possibly owing to the low protein degradation activity and energy supply. We further showed that most clinical colorectal tumors have downregulated cathepsin D, suggesting that V‐ATPase inhibitors are applicable for colorectal cancer patients. In conclusion, V‐ATPase inhibitors are promising therapeutic options for cancer with downregulated cathepsin D.
Disclosure Statement
S.K., S.N., H.N., M.F., K.N., and T.H. are employees of Takeda Pharmaceutical Company. T.S. has no conflict of interest.
Abbreviations
- AAR
amino acid starvation response
- ATF4
activating transcription factor 4
- CTSD
cathepsin D gene
- eIF2α
eukaryotic initiation factor 2α
- EIPA
5‐(N‐ethyl‐N‐isopropyl) amiloride
- ER
endoplasmic reticulum
- GCN2
general control nonderepressible 2
- GI50
50% growth inhibition values
- LC‐3
light chain 3
- mTOR
mammalian target of rapamycin
- PARP
poly(ADP‐ribose) polymerase
- PERK
protein kinase RNA‐like endoplasmic reticulum kinase
- RCC4‐vec
RCC4 plus vector alone
- RCC4‐VHL
RCC4 plus Von Hippel–Lindau
- S6
ribosomal protein S6
- S6K
ribosomal protein S6 kinase
- TMR‐BSA
tetramethylrhodamine‐conjugated BSA
- V‐ATPase
vacuolar (H+)‐ATPase
Supporting information
Fig. S1. Enhancement of the growth inhibition effect of vacuolar (H+)‐ATPase inhibitors by pretreatment with various cathepsin inhibitors. RCC4 renal cell carcinoma cells plus vector alone (RCC4‐vec) cells were treated with 10 μM E‐64‐d, 10 μM CA‐074, 10 μM cathepsin K inhibitor II, 30 μM CAA0225, or 10 μM cathepsin L inhibitor III. After 1 day, these cells were treated with the indicated concentrations of bafilomycin A1. After 3 days, cell viability was assessed. Ordinate values were obtained by setting the control group value as 100%. Data are presented as mean ± SD (n = 3). Each number indicates the combination index; synergistic effects of cathepsin inhibitors and bafilomycin A1 are indicated for values <1.0.
Acknowledgments
We thank Akiyoshi Hirayama for performing the metabolome analysis, Michael Milhollen and Elizabeth Carideo for antibody generation, Ryo Mizojiri for the synthesis of dyphylline, and Shunsuke Ebara for performing Western blotting. This article was supported by AMED‐CREST from the Japan Agency for Medical Research and Development, AMED (T.S.), and research funds from the Yamagata prefectural government and the City of Tsuruoka. This article was supported by Takeda Pharmaceutical Company Limited, Japan.
Cancer Sci 108 (2017) 1185–1193
Funding Information
Takeda Pharmaceutical Company Limited, Japan; Japan Agency for Medical Research and Development; Yamagata prefectural government; City of Tsuruoka.
References
- 1. Maxson ME, Grinstein S. The vacuolar‐type H(+)‐ATPase at a glance—more than a proton pump. J Cell Sci 2014; 127: 4987–93. [DOI] [PubMed] [Google Scholar]
- 2. Stransky L, Cotter K, Forgac M. The function of V‐ATPases in cancer. Physiol Rev 2016; 96: 1071–91. [DOI] [PMC free article] [PubMed] [Google Scholar]
- 3. Mindell JA. Lysosomal acidification mechanisms. Annu Rev Physiol 2012; 74: 69–86. [DOI] [PubMed] [Google Scholar]
- 4. Nishi T, Forgac M. The vacuolar (H+)‐ATPases—nature's most versatile proton pumps. Nat Rev Mol Cell Biol 2002; 3: 94–103. [DOI] [PubMed] [Google Scholar]
- 5. Sennoune SR, Martinez‐Zaguilan R. Vacuolar H(+)‐ATPase signaling pathway in cancer. Curr Protein Pept Sci 2012; 13: 152–63. [DOI] [PubMed] [Google Scholar]
- 6. Fais S, De Milito A, You H, Qin W. Targeting vacuolar H+‐ATPases as a new strategy against cancer. Cancer Res 2007; 67: 10627–30. [DOI] [PubMed] [Google Scholar]
- 7. Mijaljica D, Prescott M, Devenish RJ. V‐ATPase engagement in autophagic processes. Autophagy 2011; 7: 666–8. [DOI] [PubMed] [Google Scholar]
- 8. Yumoto R, Suzuka S, Oda K, Nagai J, Takano M. Endocytic uptake of FITC‐albumin by human alveolar epithelial cell line A549. Drug Metab Pharmacokinet 2012; 27: 336–43. [DOI] [PubMed] [Google Scholar]
- 9. Commisso C, Davidson SM, Soydaner‐Azeloglu RG et al Macropinocytosis of protein is an amino acid supply route in Ras‐transformed cells. Nature 2013; 497: 633–7. [DOI] [PMC free article] [PubMed] [Google Scholar]
- 10. Kamphorst JJ, Nofal M, Commisso C et al Human pancreatic cancer tumors are nutrient poor and tumor cells actively scavenge extracellular protein. Cancer Res 2015; 75: 544–53. [DOI] [PMC free article] [PubMed] [Google Scholar]
- 11. Zoncu R, Bar‐Peled L, Efeyan A, Wang S, Sancak Y, Sabatini DM. mTORC1 senses lysosomal amino acids through an inside‐out mechanism that requires the vacuolar H(+)‐ATPase. Science 2011; 334: 678–83. [DOI] [PMC free article] [PubMed] [Google Scholar]
- 12. Palm W, Park Y, Wright K, Pavlova NN, Tuveson DA, Thompson CB. The utilization of extracellular proteins as nutrients is suppressed by mTORC1. Cell 2015; 162: 259–70. [DOI] [PMC free article] [PubMed] [Google Scholar]
- 13. Murakami T, Shibuya I, Ise T et al Elevated expression of vacuolar proton pump genes and cellular pH in cisplatin resistance. Int J Cancer 2001; 93: 869–74. [DOI] [PubMed] [Google Scholar]
- 14. Torigoe T, Izumi H, Ishiguchi H et al Enhanced expression of the human vacuolar H+‐ATPase c subunit gene (ATP6L) in response to anticancer agents. J Biol Chem 2002; 277: 36534–43. [DOI] [PubMed] [Google Scholar]
- 15. Ohta T, Arakawa H, Futagami F et al Bafilomycin A1 induces apoptosis in the human pancreatic cancer cell line Capan‐1. J Pathol 1998; 185: 324–30. [DOI] [PubMed] [Google Scholar]
- 16. Lee JC, Lee CH, Su CL et al Justicidin A decreases the level of cytosolic Ku70 leading to apoptosis in human colorectal cancer cells. Carcinogenesis 2005; 26: 1716–30. [DOI] [PubMed] [Google Scholar]
- 17. Schneider LS, von Schwarzenberg K, Lehr T et al Vacuolar‐ATPase inhibition blocks iron metabolism to mediate therapeutic effects in breast cancer. Cancer Res 2015; 75: 2863–74. [DOI] [PubMed] [Google Scholar]
- 18. Nakashima S, Hiraku Y, Tada‐Oikawa S et al Vacuolar H+‐ATPase inhibitor induces apoptosis via lysosomal dysfunction in the human gastric cancer cell line MKN‐1. J Biochem 2003; 134: 359–64. [DOI] [PubMed] [Google Scholar]
- 19. Koltai T. Cancer: fundamentals behind pH targeting and the double‐edged approach. Onco Targets Ther 2016; 9: 6343–60. [DOI] [PMC free article] [PubMed] [Google Scholar]
- 20. Soga T, Baran R, Suematsu M et al Differential metabolomics reveals ophthalmic acid as an oxidative stress biomarker indicating hepatic glutathione consumption. J Biol Chem 2006; 281: 16768–76. [DOI] [PubMed] [Google Scholar]
- 21. Zhao Y, Hui J, Zhu L. Synthesis and bioevaluation of novel arylnaphthalene lignans as anticancer agents. Med Chem Res 2012; 22: 2505–10. [Google Scholar]
- 22. Foucquier J, Guedj M. Analysis of drug combinations: current methodological landscape. Pharmacol Res Perspect 2015; 3: e00149. [DOI] [PMC free article] [PubMed] [Google Scholar]
- 23. Sevlever D, Jiang P, Yen SH. Cathepsin D is the main lysosomal enzyme involved in the degradation of alpha‐synuclein and generation of its carboxy‐terminally truncated species. Biochemistry 2008; 47: 9678–87. [DOI] [PMC free article] [PubMed] [Google Scholar]
- 24. Neefjes J, Dantuma NP. Fluorescent probes for proteolysis: tools for drug discovery. Nat Rev Drug Discov 2004; 3: 58–69. [DOI] [PMC free article] [PubMed] [Google Scholar]
- 25. Guha S, Padh H. Cathepsins: fundamental effectors of endolysosomal proteolysis. Indian J Biochem Biophys 2008; 45: 75–90. [PubMed] [Google Scholar]
- 26. Han KY, Hwang JW, Bae GU, Kim SN, Kim YK. Akt regulation of Aven contributes to the sensitivity of cancer cells to chemotherapeutic agents. Mol Med Rep 2015; 11: 3866–71. [DOI] [PubMed] [Google Scholar]
- 27. Wek RC, Jackson BM, Hinnebusch AG. Juxtaposition of domains homologous to protein kinases and histidyl‐tRNA synthetases in GCN2 protein suggests a mechanism for coupling GCN4 expression to amino acid availability. Proc Natl Acad Sci USA 1989; 86: 4579–83. [DOI] [PMC free article] [PubMed] [Google Scholar]
- 28. Wek SA, Zhu S, Wek RC. The histidyl‐tRNA synthetase‐related sequence in the eIF‐2 alpha protein kinase GCN2 interacts with tRNA and is required for activation in response to starvation for different amino acids. Mol Cell Biol 1995; 15: 4497–506. [DOI] [PMC free article] [PubMed] [Google Scholar]
- 29. Dong J, Qiu H, Garcia‐Barrio M, Anderson J, Hinnebusch AG. Uncharged tRNA activates GCN2 by displacing the protein kinase moiety from a bipartite tRNA‐binding domain. Mol Cell 2000; 6: 269–79. [DOI] [PubMed] [Google Scholar]
- 30. Vandewynckel YP, Laukens D, Geerts A et al The paradox of the unfolded protein response in cancer. Anticancer Res 2013; 33: 4683–94. [PubMed] [Google Scholar]
- 31. Sancak Y, Peterson TR, Shaul YD et al The Rag GTPases bind raptor and mediate amino acid signaling to mTORC1. Science 2008; 320: 1496–501. [DOI] [PMC free article] [PubMed] [Google Scholar]
- 32. Sancak Y, Bar‐Peled L, Zoncu R, Markhard AL, Nada S, Sabatini DM. Ragulator‐Rag complex targets mTORC1 to the lysosomal surface and is necessary for its activation by amino acids. Cell 2010; 141: 290–303. [DOI] [PMC free article] [PubMed] [Google Scholar]
- 33. Mizushima N, Yoshimori T, Levine B. Methods in mammalian autophagy research. Cell 2010; 140: 313–26. [DOI] [PMC free article] [PubMed] [Google Scholar]
- 34. Stankiewicz M, Jonas W, Hadas E, Cabaj J, Douch PG. Supravital staining of eosinophils. Int J Parasitol 1996; 26: 445–6. [DOI] [PubMed] [Google Scholar]
- 35. Benes P, Vetvicka V, Fusek M. Cathepsin D–many functions of one aspartic protease. Crit Rev Oncol Hematol 2008; 68: 12–28. [DOI] [PMC free article] [PubMed] [Google Scholar]
- 36. Zaidi N, Maurer A, Nieke S, Kalbacher H. Cathepsin D: a cellular roadmap. Biochem Biophys Res Commun 2008; 376: 5–9. [DOI] [PubMed] [Google Scholar]
- 37. Hah YS, Noh HS, Ha JH et al Cathepsin D inhibits oxidative stress‐induced cell death via activation of autophagy in cancer cells. Cancer Lett 2012; 323: 208–14. [DOI] [PubMed] [Google Scholar]
- 38. Oliveira CS, Pereira H, Alves S et al Cathepsin D protects colorectal cancer cells from acetate‐induced apoptosis through autophagy‐independent degradation of damaged mitochondria. Cell Death Dis 2015; 6: e1788. [DOI] [PMC free article] [PubMed] [Google Scholar]
- 39. Yamamoto A, Tagawa W, Yoshimori T, Moriyama Y, Masaki R, Tashiro Y. Bafilomycin A1 prevents maturation of autophagic vacuoles by inhibiting fusion between autophagosomes and lysosomes in rat hepatoma cell line, H‐4‐II‐E cells. Cell Struct Funct 1998; 23: 33–42. [DOI] [PubMed] [Google Scholar]
- 40. Liaudet‐Coopman E, Beaujouin M, Derocq D et al Cathepsin D: newly discovered functions of a long‐standing aspartic protease in cancer and apoptosis. Cancer Lett 2006; 237: 167–79. [DOI] [PubMed] [Google Scholar]
- 41. Tandon AK, Clark GM, Chamness GC, Chirgwin JM, McGuire WL. Cathepsin D and prognosis in breast cancer. N Engl J Med 1990; 322: 297–302. [DOI] [PubMed] [Google Scholar]
- 42. Theodoropoulos GE, Panoussopoulos D, Lazaris AC, Golematis BC. Evaluation of cathepsin D immunostaining in colorectal adenocarcinoma. J Surg Oncol 1997; 65: 242–8. [DOI] [PubMed] [Google Scholar]
- 43. Bidere N, Lorenzo HK, Carmona S et al Cathepsin D triggers Bax activation, resulting in selective apoptosis‐inducing factor (AIF) relocation in T lymphocytes entering the early commitment phase to apoptosis. J Biol Chem 2003; 278: 31401–11. [DOI] [PubMed] [Google Scholar]
- 44. Deiss LP, Galinka H, Berissi H, Cohen O, Kimchi A. Cathepsin D protease mediates programmed cell death induced by interferon‐gamma, Fas/APO‐1 and TNF‐alpha. EMBO J 1996; 15: 3861–70. [PMC free article] [PubMed] [Google Scholar]
- 45. Roberg K, Kagedal K, Ollinger K. Microinjection of cathepsin d induces caspase‐dependent apoptosis in fibroblasts. Am J Pathol 2002; 161: 89–96. [DOI] [PMC free article] [PubMed] [Google Scholar]
- 46. Schestkowa O, Geisel D, Jacob R, Hasilik A. The catalytically inactive precursor of cathepsin D induces apoptosis in human fibroblasts and HeLa cells. J Cell Biochem 2007; 101: 1558–66. [DOI] [PubMed] [Google Scholar]
- 47. Wu GS, Saftig P, Peters C, Ed‐Deiry WS. Potential role for cathepsin D in p53‐dependent tumor suppression and chemosensitivity. Oncogene 1998; 16: 2177–83. [DOI] [PubMed] [Google Scholar]
- 48. Kirana C, Shi H, Laing E et al Cathepsin D expression in colorectal cancer: from proteomic discovery through validation using western blotting, immunohistochemistry, and tissue microarrays. Int J Proteomics 2012; 2012: 245819. [DOI] [PMC free article] [PubMed] [Google Scholar]
Associated Data
This section collects any data citations, data availability statements, or supplementary materials included in this article.
Supplementary Materials
Fig. S1. Enhancement of the growth inhibition effect of vacuolar (H+)‐ATPase inhibitors by pretreatment with various cathepsin inhibitors. RCC4 renal cell carcinoma cells plus vector alone (RCC4‐vec) cells were treated with 10 μM E‐64‐d, 10 μM CA‐074, 10 μM cathepsin K inhibitor II, 30 μM CAA0225, or 10 μM cathepsin L inhibitor III. After 1 day, these cells were treated with the indicated concentrations of bafilomycin A1. After 3 days, cell viability was assessed. Ordinate values were obtained by setting the control group value as 100%. Data are presented as mean ± SD (n = 3). Each number indicates the combination index; synergistic effects of cathepsin inhibitors and bafilomycin A1 are indicated for values <1.0.