Abstract
Background
This study aimed to investigate potential miRNAs and genes associated with the prognosis of hepatocellular carcinoma (HCC).
Methods
Weighted co-expression network analysis was utilized to analyze the mRNA and miRNA sequencing data of HCC from TCGA (The Cancer Genome Atlas) database. Significant network modules were identified, and then functions of genes in the gene network modules and target genes of miRNAs in the miRNA network modules were explored. Additionally, correlations between network modules and prognostic factors of HCC were analyzed.
Results
In total, 10 mRNA network modules were identified, three of which were significantly related to tumor stage, NAFLD (non-alcoholic fatty liver disease) and patient age. Four miRNA network modules were identified, of which one was associated with tumor stage. Targets of hsa-miR-363-5p were found distributed in the gene network modules, such as RGPD5, RGPD6, ZNF445 and ZNF780B. Kaplan–Meier test revealed that low expression of hsa-miR-363-5p was associated with better overall survival of HCC patients.
Conclusion
hsa-miR-363-5p may be a potential prognostic marker for HCC.
Keywords: Hepatocellular carcinoma, microRNA, Weighted co-expression network analysis, Prognosis
Background
Hepatocellular carcinoma (HCC) is the most common primary liver malignancy with increasing incidence worldwide, which is mainly associated with chronic hepatitis B virus (HBV) and/or hepatitis C virus (HCV) infections, as well as alcohol consumption [1, 2]. There are few effective treatments for advanced HCC partly because the cell- and molecular-based mechanisms that contribute to the pathogenesis of this tumor type remain unclear.
Aberrant expression of microRNA (miRNA) has been detected in a variety of human malignancies and proved to be important influencing factors in cancer-associated genomic regions. Recently, remarkable studies have revealed the vital roles of miRNA in HCC pathogenesis. Several miRNAs are upregulated in HCC tissues compared to that in normal tissues, such as miR-21, miR-122, and miR-223 [3, 4], whereas some miRNAs were downregulated, such as miR-122a, miR-22 and miR-152 [5–7]. A series of miRNAs have been identified as tumor suppressors in HCC. For instance, the putative tumor suppressor miR-124 regulates cell aggressiveness of HCC by targeting ROCK2 and EZH2 [8]. miRNA-26a suppresses tumor growth and metastasis of HCC by modulating the interleukin-6-Stat3 pathway [9]. Overexpression of miR-101 blocks epithelial-mesenchymal transition and angiogenesis of HCC via decreasing multiple genes (e.g. COX2, EZH2 and STMN1) [10]. Furthermore, there are some studies identified the associations between several miRNAs and clinical outcomes of HCC patients. For instance, the high level of miR-425-3p is associated with time to progression and progression free survival [11]. Upregulation of miR-494 contributes to the lower survival rate of HCC patients [12]. However, there are still numerous of miRNAs and their targets that are associated with HCC prognosis remain to be identified.
Weighted gene co-expression network analysis (WGCNA) was used to explore the biological functions of genes based on RNA sequencing or microarray data in different samples [13]. In this study, in order to identify the potential key miRNAs and genes associated with the prognosis of HCC, weighted co-expression network analysis was performed on the mRNA and miRNA. The results may provide novel information for the study of HCC prognosis, and provide novel potential biomarkers for the clinical therapy of HCC.
Methods
Sequencing and clinical data
The clinical data of 377 patients with HCC were extracted from The Cancer Genome Atlas (TCGA, http://cancergenome.nih.gov/). Among the 377 patients, mRNA sequencing data for 371 patients and miRNA sequencing data for 372 patients of level 3 were available. Both mRNA and miRNA sequencing data were generated using the Illumina HiSeq platform..
Data preprocessing
First, mRNAs and miRNAs with verbose <3 were removed using the goodSamplesGenes function in Weighted Gene Co-expression Network Analysis (WGCNA) (Version 1.43–10) package of R (Version 3.1.0) [14]. Meanwhile, abnormally low expressed mRNAs and miRNAs with RPKM (reads per kilobase of exon per million reads mapped) < 10 or deviation of average linkage distance and the main cluster >40% were removed, via an average linkage method. Subsequently, Pearson correlation coefficient between all of genes as well as miRNAs was calculated using the multiple testing, and the false positive rate < 5% was controlled by q-value [15].
Weighted Gene co-expression network analysis (WGCNA)
Euclidean distance and Pearson’s correlation matrices were used to calculate the correlation between gene pairs and miRNA pairs, and the correlation between gene i and gene j (or miRNA i and miRNA j) was defined as si,j = |cor (μi, μj)|., where μi and μj represent expression value vector of i and j, respectively, and cor represents the Pearson correlation coefficient between the two expression value vectors. The calculated Pearson’s correlation matrices were transformed into matrices of connection strengths using a power function ai,j = si,j β. The β value is set as weighting coefficient only when the correlation coefficient between log(k) and log(p(k)) reaches 0.8, where p(k) represents the proportion of nodes with connectivity k. After the adjacency parameter was determined, the correlation matrix was transformed into an adjacency matrix, which was subsequently transformed into a topological overlap matrix. The topological overlap matrix (TOM) [16] was computed as follow:
where 1 ij = ∑μ α iμ α jμ indicates the product sums of the adjacency coefficients of the nodes connected to both i and j. k ↺ = ∑μ α ↺μindicates the sum of the adjacency coefficients of the nodes only connected to i. Similarly, k j = ∑μ α jμ indicates the sum of the adjacency coefficient of the nodes only connected to j. If two nodes are neither connected each other nor share any neighbors, ϖ ij = 0. The formula was used to calculate the dissimilarity degree between any two nodes.
Identification of significant network modules
Genes were performed hierarchical clustering using the dissimilarity coefficient as the distance measure. Each branch corresponds to a module. Modules were identified by using a mixed dynamic TreeCut (Version 1.62) algorithm criterion [17]. The eigengenes in each module, which is stipulated as the first principal component of a given module and can be considered as a representative gene expression profile in a module, was calculated in turn when modules cannot be identified with the dynamic TreeCut algorithm criterion, then the merged close modules were clustered into new modules. The network significance approach determined the module related to prognostic factors based on module significance (MS). The MS indicated the average gene significance (GS) of all the genes in the module. Significant miRNA network modules were identified using the same methods as gene network module identification.
Analysis of correlations between network modules and prognostic factors
Correlations between mRNA/miRNA network modules and seven prognostic factors of HCC [(gender, age, tumor stage, alcohol consumption, hepatitis B virus (HBV), hepatitis C virus (HCV) and non-alcoholic fatty liver disease (NAFLD)] were analyzed by calculating the Pearson correlation coefficient [18], and p < 0.01 was set as the cut-off criterion.
Functional enrichment analysis of genes and miRNAs
Gene Ontology (GO) functional enrichment analysis of genes in the modules was conducted based on the Database for Annotation, Visualization and Integrated Discovery (DAVID, https://david.ncifcrf.gov/) [19, 20]. The p-value of each GO term was calculated by Fisher’s Exact Test [21], and only terms with p-value <0.05 were considered significant.
Furthermore, before GO enrichment analysis of miRNA targets, target genes of miRNAs in the modules were predicted based on the information in TargetScan (http://www.targetscan.org/), miRanda (http://www.microrna.org/microrna/home.do), and miRwalk (http://zmf.umm.uni-heidelberg.de/apps/zmf/mirwalk2/). Only the miRNA-gene pairs that were common in the three databases and met with false discovery rate (FDR) < 0.05 were chosen for further analysis. Afterwards, the target genes of miRNAs were underwent GO enrichment analysis, and only terms with p-value <0.05 were considered significant.
Results
Data preprocessing
For the mRNA sequencing data, after data preprocessing, 362 mRNAs were removed due to low expression or data missing, and a total of 20,169 mRNAs were remained for further analysis. Subsequently, hierarchically clustering of mRNA expression data for the 371 patients was carried out (Fig. 1a). Deviation between data of some patient samples and the main cluster was more than 40%, thus, 3.5E + 6 was set as the cut-off criteria. Finally, data of 22 patient samples were removed due to deviation >40% or RPKM <10, thus, mRNA data of 349 patients remained for further analysis.
Fig. 1.
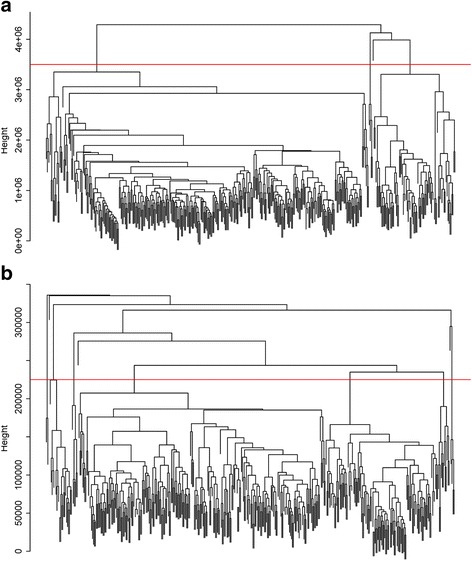
The cluster dendrogram of co-expression network modules for mRNAs (a) and miRNAs (b). The red line represents the cut-off of data filtering in the step of data preprocessing
For the miRNA sequencing data, 854 miRNAs remained after data preprocessing. The hierarchically clustering of miRNA expression data for the 372 patients showed that deviation between data of some patient samples and the main cluster was more than 40%, thus, 2.25E + 5 was set as the cut-off threshold (Fig. 1b). Finally, a total of 320 patient sample data remained for further analysis.
mRNA expression module analysis of WGCNA
In total, 10 mRNA network modules were identified using WGCNA. Because module identification does not make use of prior biological knowledge about the mRNA, the biological meaning of each module is initially unknown and hence the modules were assigned a color label (plum, antique white, coral, ivory, light cyan, medium purple, brown, dark magenta, pale violet and dark grey). (Fig. 2a).
Fig. 2.
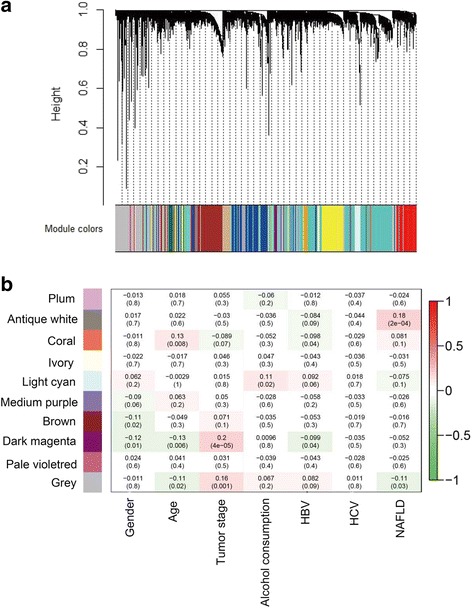
The color display of co-expression network modules for mRNAs (a) and the correlation of mRNA co-expression network modules with clinical prognostic factors of hepatocellular carcinoma (b). HBV, hepatitis B virus; HCV, hepatitis C virus; NAFLD, non-alcoholic fatty liver disease
To reveal the functions of the mRNAs in each of the modules, GO enrichment analysis was performed. According to the results, the mRNAs in the dark magenta module (n = 8695) were enriched for mRNA that coded for proteins involved in alternative splicing; in the dark grey module (n = 6199), they were involved with sensory transduction; in the coral module (n = 1488), they were involved with oxidoreductase (Table 1).
Table 1.
Gene Ontology enrichment analysis of genes in the ten network modules
| Module | Gene number | Functional Ontology (top) | p value | Discription |
|---|---|---|---|---|
| Plum | 52 | keratinization | 1.50E-25 | Protein involved in keratinization, the process in which the cytoplasm of the outermost cells of the vertebrate epidermis is replaced by keratin. Keratinization occurs in the stratum corneum, feathers, hair, claws, nails, hooves, and horns. |
| Antique white | 122 | erythrocyte | 1.20E-09 | Protein involved in the maturation of erythrocytes, the predominant type of cells present in vertebrate blood and which contain the gas-transporting protein, hemoglobin. |
| Coral | 1488 | oxidoreductase | 4.20E-49 | Enzyme that catalyzes the oxidation of one compound with the reduction of another. |
| Ivory | 124 | Secreted | 6.20E-11 | Protein secreted into the cell surroundings. |
| Light cyan | 3299 | acetylation | 4.90E-92 | Protein which is posttranslationally modified by the attachment of at least one acetyl group; generally at the N-terminus. |
| Medium purple | 35 | cell membrane | 6.20E-03 | Protein found in or associated with the cytoplasmic membrane, a selectively permeable membrane which separates the cytoplasm from its surroundings. Known as the cell inner membrane in prokaryotes with 2 membranes. |
| Brown | 99 | glycoprotein | 3.90E-04 | Protein containing one or more covalently linked carbohydrates of various types, i.e. from monosaccharides to branched polysaccharides, including glycosylphosphatidylinositol (GPI), glycosaminoglycans (GAG). |
| Dark magenta | 8695 | alternative splicing | 3.20E-39 | Protein for which at least two isoforms exist due to distinct pre-mRNA splicing events. |
| Pale violetred | 46 | chromosomal protein | 1.00E-08 | Protein which is associated with chromosomal DNA, including histones, protamines and high mobility group proteins. |
| Grey | 6199 | sensory transduction | 3.40E-13 | Protein involved in sensory transduction, the process by which a cell converts an extracellular signal, such as light, taste, sound, touch or smell, into electric signals. |
Correlations between gene network modules and clinical prognostic data were analyzed. Module dark magenta was found to be significantly correlated with tumor stage of HCC (r = 0.2, p = 4e-5); module antique white was related to NAFLD (r = 0.18, p = 2e-4); and module coral was associated with age (r = 0.13, p = 0.008) (Fig. 2b).
Additionally, GO enrichment analysis of the three gene modules that correlated with prognosis of HCC was conducted. The results showed that module dark magenta was significantly related to several functions like alternative splicing and transcription (Table 2).
Table 2.
Top 5 Gene Ontology functional terms of genes in module dark magenta associated with the clinical prognostic data
| Genes numbers | Functional Ontology (top5) | p value | Discription |
|---|---|---|---|
| 3576 | alternative splicing | 3.5E-39 | Protein for which at least two isoforms exist due to distinct pre-mRNA splicing events. |
| 1038 | dna-binding | 7.6E-36 | Protein which binds to DNA, typically to pack or modify the DNA, or to regulate gene expression. |
| 1091 | transcription regulation | 2.2E-30 | Protein involved in the regulation of the transcription process. |
| 1107 | Transcription | 3.3E-29 | Protein involved in the transfer of genetic information from DNA to messenger RNA (mRNA) by DNA-directed RNA polymerase |
| 2102 | nucleus | 3.8E-27 | Protein located in the nucleus of a cell. |
Weighted Gene co-expression network analysis (WGCNA) of miRNA
According to the module analysis of miRNA co-expression networks, four miRNA network modules were identified, and assigned the color labels brown, blue, turquoise and grey. The correlation analysis of modules and clinical prognostic data revealed that module blue was markedly associated with tumor stage of HCC (r = 0.22, p = 2e-5) (Fig. 3).
Fig. 3.
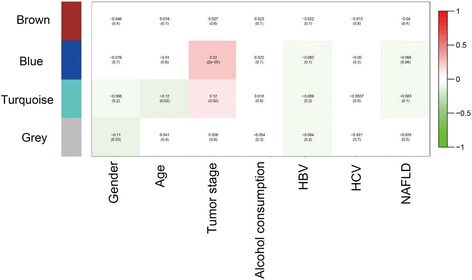
The correlation of microRNA co-expression network modules with clinical prognostic factors of hepatocellular carcinoma. HBV, hepatitis B virus; HCV, hepatitis C virus; NAFLD, non-alcoholic fatty liver disease
As the most significant module related to tumor stage, 111 miRNAs contained in the module blue were chosen for target genes. A total of 530 target genes were screened out based on the information in TargetScan, miRanda, and miRwalk. These target genes were significantly related to GO functions like alternative splicing, phosphotransferase and immune response (Table 3).
Table 3.
The results of Gene Ontology enrichment analysis of target genes of microRNAs in module blue
| Function ontology | p value | Description |
|---|---|---|
| Alternative splicing | 2.90E-05 | Protein for which at least two isoforms exist due to distinct pre-mRNA splicing events. |
| Phosphotransferase | 3.90E-03 | Protein involved in the phosphotransferase system, the major carbohydrate transport system in bacteria. This phosphotransferase system catalyzes the transfer of the phosphoryl group from phosphoenolpyruvate to incoming sugar substrates concomitant with their translocation across the cell membrane. |
| Coiled coil | 5.30E-03 | Protein which contains at least one coiled coil domain, a type of secondary structure composed of two or more alpha helices which entwine to form a cable structure. In proteins, the helical cables serve a mechanical role in forming stiff bundles of fibres. |
| Immune response | 9.00E-03 | Protein involved in immunity, any immune system process that functions in the response of an organism to a potential internal or invasive threat. The vertebrate immune system is formed by the innate immune system (composed of phagocytes, complement, antimicrobial peptides, etc) and by the adaptive immune system which consists of T- and B-lymphocytes. |
| Transferase | 1.40E-02 | Enzyme that transfers a chemical group, e.g. a methyl group or a glycosyl group from one compound (donor) to another compound (acceptor). |
Associations of miRNA target genes and gene network modules
To investigate whether miRNA targets in module blue were genes in the gene network modules, distribution of miRNA targets in the 10 gene network modules was analyzed. More than 200 miRNA targets were distributed in the gene module dark magenta (Fig. 4). Among them, the number of target genes of hsa-miR-363-5p in module dark magenta reached 22, including APOBEC3F, ASB16, GAPVD1, IL6R, MRPL44, MTFMT, MYEF2, PPM1D, RASSF2, RELL1, RGPD5, RGPD6, RHOF, RRP15, SHOX, SLC9A7, SPC24, ST8SIA4, WHSC1, ZNF445, ZNF780B, and ZYG11A.
Fig. 4.
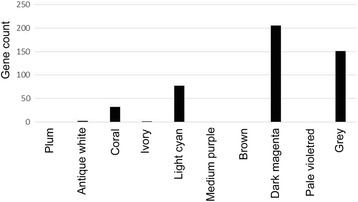
Distribution of microRNA in module blue target genes in the ten gene network modules
Correlation of hsa-miR-363-5p and prognosis of HCC
To further reveal the correlation of hsa-miR-363-5p and prognosis of HCC, survival curve was analyzed by Kaplan–Meier test. The median value of hsa-miR-363-5p expression (RPKM = 4.61) was set as the cut-off criteria for high- and low-expression groups of HCC patient samples in TCGA. The 5-year survival curve proved the survival difference between the high- and low-expression groups started at 2 years after surgery, and the difference reached 51.4% 5 years (p = 0.012) (Fig. 5) after surgery. The results indicated that hsa-miR-363-5p expression was closely related to the prognosis of HCC.
Fig. 5.
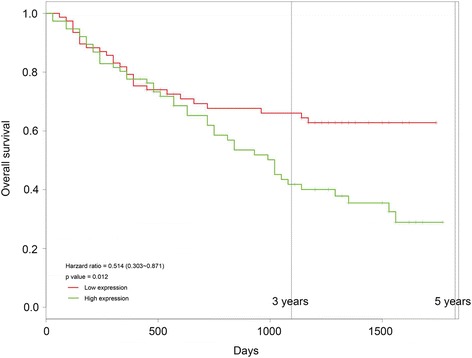
The survival curve displaying the difference of survival rate between the high- and low-expression groups divided by hsa-miR-363-5p expression level
Discussion
In the present study, 10 mRNA network modules were identified based on the WGCNA of sequencing data of HCC samples, of which three modules were significantly related to tumor stage, NAFLD and patient age. Meanwhile, four miRNA network modules were identified, of which one module was associated with tumor stage of HCC. Target genes of the miRNAs in this miRNA network module were markedly related to alternative splicing.
Alternative splicing is one of the most significant components of the functional complexity of the human genome, and various splicing alterations have been involved in different steps and aspects of cancer initiation and progression [22]. In HCC, alternative splicing of multiple molecules have been detected. For instance, two alternative splicing isoforms of the cell fate determinant Numb, PRRL and PRRS, correlated with the prognosis of patients with HCC [23]. Alternative splicing of A-Raf is regulated by the upregulation of hnRNP A2 in HCC, which activates the Ras-MAPK-ERK pathway [24]. Another study reported that the splicing regulator SLU7 is an essential factor for the preservation of HCC cell viability via oncogenic miR-17-92 cluster expression [25]. Therefore, alternative splicing of some genes plays a critical role in the progression and prognosis of HCC.
Furthermore, a set of target genes of miRNAs were the genes in the gene network modules. Among them, 22 targets of hsa-miR-363-5p were distributed in the gene network modules, such as RGPD5, RGPD6, ZNF445, and ZNF780B. Kaplan–Meier test revealed that low expression of hsa-miR-363-5p was closely related to better overall survival of HCC patients. miR-363-5p belongs to the miR-363 family, and it modulates endothelial cell properties and their communication with hematopoietic precursor cells [25]. Inhibition of miR-363-5p affect angiogenic properties (e.g. the response to stimulation by angiogenic factors) of endothelial cells and the interaction between endothelial cells and hematopoietic precursors [26]. miR-363-5p has been previously predicted to be down-regulated in HCC tumor endothelial cells compared to normal hepatic sinusoidal endothelial cells [27]. Besides, miR-363-5p also exhibits decreased expression in other tumors, such as human oral squamous carcinoma and triple-negative breast cancer [28, 29]. These studies indicated that miR-363-5p is usually downregulated in cancer. However, low expression of hsa-miR-363-5p was found to be closely associated with the better overall survival of HCC patients. There is no report about the association of miR-363-5p with survival of HCC patients to date. We speculate that low expression of miR-363-5p might has effect on angiogenic properties and interactions with hematopoietic precursors, and thus inhibits the angiogenesis in HCC, weakens the invasion ability of tumor and results in a better overall survival of patients. However, this inference is required to be further validated by experiments, which will be conducted in our future study.
A set of genes, such as RGPD5, RGPD6, ZNF445, and ZNF780B were predicted to be regulated by miR-363-5p in this study. Both RGPD5 and RGPD6 share a high degree of sequence identity with RANBP2, a large RAN-binding protein [30]. Currently, there are limited studies about the relations between RGPD5/ RGPD6 and cancer. Both ZNF445 (also known as ZNF168) and ZNF780B (also known as ZNF779) encode zinc finger proteins that may be associated with transcriptional regulation [31]. No evidence is now available to show their connection with HCC. However, a previous study has demonstrated that another member of the ZNF family, ZNF165 mRNA and its protein are expressed in HCC, indicating that ZNF family may be involved in tumor biology of HCC [32]. Besides, a recent study has found that zinc finger protein ZBTB20 promotes tumor growth of HCC via transcriptionally repressing FoxO1 [33]. In our further study, we will confirm the regulatory relationships between miR-363-5p and its target genes (e.g. RGPD5, RGPD6, ZNF445 and ZNF780B), and the associations of these genes with HCC.
Conclusion
In conclusion, we found that several gene networks and one miRNA network might be important clinical prognostic factors (e.g. tumor stage, NAFLD or age) for HCC based on the WGCNA of sequencing data. Low expression of hsa-miR-363-5p was closely related to the better overall survival of HCC, and it may be a potential prognostic marker for HCC.
Acknowledgements
None.
Funding
None.
Availability of data and materials
The authors confirm that all data underlying the findings are fully available without restriction. All data were stored in a secure database to maintain anonymity. But it can be accessed upon reasonable request.
Authors’ contributions
JZ and JF participated in the design of this study, and they both performed the statistical analysis. CMZ and JZ carried out the study and collected important background information. YYQ collected the dataset, drafted the manuscript and provided some important intellectual content. All authors read and approved the final manuscript.
Competing interests
The authors declare that they have no competing interests.
Consent for publication
Not applicable.
Ethics approval and consent to participate
Not applicable.
Publisher’s Note
Springer Nature remains neutral with regard to jurisdictional claims in published maps and institutional affiliations.
Abbreviations
- DAVID
the Database for Annotation, Visualization and Integrated Discovery
- FDR
False discovery rate
- GO
Gene Ontology
- GS
Gene significance
- HBV
Chronic hepatitis B virus
- HCC
Hepatocellular carcinoma
- HCV
Hepatitis C virus
- miRNA
microRNA
- MS
Module significance
- NAFLD
Non-alcoholic fatty liver disease
- RPKM
Reads per kilobase of exon per million reads mapped
- TCGA
The Cancer Genome Atlas
- TOM
Topological overlap matrix
- WGCNA
Weighted gene co-expression network analysis
Contributor Information
Jun Zhang, Phone: +86-028-86638387, Email: zhangzhzhzh@hotmail.com.
Jia Fan, Email: xiaofanjj320@tom.com.
Chongming Zhou, Email: tumor939@163.com.
Yanyu Qi, Email: qiyanyu3@163.com.
References
- 1.Arzumanyan A, Reis HM, Feitelson MA. Pathogenic mechanisms in HBV-and HCV-associated hepatocellular carcinoma. Nat Rev Cancer. 2013;13(2):123–135. doi: 10.1038/nrc3449. [DOI] [PubMed] [Google Scholar]
- 2.Morgan TR, Mandayam S, Jamal MM. Alcohol and hepatocellular carcinoma. Gastroenterology. 2004;127(5):S87–S96. doi: 10.1053/j.gastro.2004.09.020. [DOI] [PubMed] [Google Scholar]
- 3.Xu J, Wu C, Che X, Wang L, Yu D, Zhang T, et al. Circulating MicroRNAs, miR-21, miR-122, and miR-223, in patients with hepatocellular carcinoma or chronic hepatitis. Mol Carcinog. 2011;50(2):136–142. doi: 10.1002/mc.20712. [DOI] [PubMed] [Google Scholar]
- 4.Tomimaru Y, Eguchi H, Nagano H, Wada H, Kobayashi S, Marubashi S, et al. Circulating microRNA-21 as a novel biomarker for hepatocellular carcinoma. J Hepatol. 2012;56(1):167–175. doi: 10.1016/j.jhep.2011.04.026. [DOI] [PubMed] [Google Scholar]
- 5.Zhang J, Yang Y, Yang T, Liu Y, Li A, Fu S, et al. microRNA-22, downregulated in hepatocellular carcinoma and correlated with prognosis, suppresses cell proliferation and tumourigenicity. Br J Cancer. 2010;103(8):1215–1220. doi: 10.1038/sj.bjc.6605895. [DOI] [PMC free article] [PubMed] [Google Scholar]
- 6.Huang J, Wang Y, Guo Y, Sun S. Down-regulated microRNA-152 induces aberrant DNA methylation in hepatitis B virus–related hepatocellular carcinoma by targeting DNA methyltransferase 1. Hepatology. 2010;52(1):60–70. doi: 10.1002/hep.23660. [DOI] [PubMed] [Google Scholar]
- 7.Gramantieri L, Ferracin M, Fornari F, Veronese A, Sabbioni S, Liu CG, et al. Cyclin G1 is a target of miR-122a, a microRNA frequently down-regulated in human hepatocellular carcinoma. Cancer Res. 2007;67(13):6092–6099. doi: 10.1158/0008-5472.CAN-06-4607. [DOI] [PubMed] [Google Scholar]
- 8.Zheng F, Liao Y-J, Cai M-Y, Liu Y-H, Liu T-H, Chen S-P, et al. The putative tumour suppressor microRNA-124 modulates hepatocellular carcinoma cell aggressiveness by repressing ROCK2 and EZH2. Gut. 2012;61(2):278–289. doi: 10.1136/gut.2011.239145. [DOI] [PubMed] [Google Scholar]
- 9.Yang X, Liang L, Zhang XF, Jia HL, Qin Y, Zhu XC, et al. MicroRNA-26a suppresses tumor growth and metastasis of human hepatocellular carcinoma by targeting interleukin-6-Stat3 pathway. Hepatology. 2013;58(1):158–170. doi: 10.1002/hep.26305. [DOI] [PubMed] [Google Scholar]
- 10.Zheng F, Liao Y-J, Cai M-Y, Liu T-H, Chen S-P, Wu P-H, et al. Systemic delivery of microRNA-101 potently inhibits hepatocellular carcinoma in vivo by repressing multiple targets. PLoS Genet. 2015;11(2):e1004873. doi: 10.1371/journal.pgen.1004873. [DOI] [PMC free article] [PubMed] [Google Scholar]
- 11.Vaira V, Roncalli M, Carnaghi C, Faversani A, Maggioni M, Augello C, et al. MicroRNA-425-3p predicts response to sorafenib therapy in patients with hepatocellular carcinoma. Liver Int. 2015;35(3):1077–1086. doi: 10.1111/liv.12636. [DOI] [PubMed] [Google Scholar]
- 12.Chuang KH, Whitney-Miller CL, Chu CY, Zhou Z, Dokus MK, Schmit S, et al. MicroRNA-494 is a master epigenetic regulator of multiple invasion-suppressor microRNAs by targeting ten eleven translocation 1 in invasive human hepatocellular carcinoma tumors. Hepatology. 2015;62(2):466–480. doi: 10.1002/hep.27816. [DOI] [PMC free article] [PubMed] [Google Scholar]
- 13.Zhang B, Horvath S. A general framework for weighted gene co-expression network analysis. Stat Appl Genet Mol Biol. 2005;4(1):1128. doi: 10.2202/1544-6115.1128. [DOI] [PubMed] [Google Scholar]
- 14.Langfelder P, Horvath S. WGCNA: an R package for weighted correlation network analysis. BMC Bioinformatics. 2008;9(1):559. doi: 10.1186/1471-2105-9-559. [DOI] [PMC free article] [PubMed] [Google Scholar]
- 15.Storey JD, Tibshirani R. Statistical significance for genomewide studies. Proc Natl Acad Sci U S A. 2003;100(16):9440–9445. doi: 10.1073/pnas.1530509100. [DOI] [PMC free article] [PubMed] [Google Scholar]
- 16.Yip AM, Horvath S. Gene network interconnectedness and the generalized topological overlap measure. BMC Bioinformatics. 2007;8:22. doi: 10.1186/1471-2105-8-22. [DOI] [PMC free article] [PubMed] [Google Scholar]
- 17.Langfelder P, Zhang B, Horvath S. Defining clusters from a hierarchical cluster tree: the dynamic tree cut package for R. Bioinformatics. 2008;24(5):719–720. doi: 10.1093/bioinformatics/btm563. [DOI] [PubMed] [Google Scholar]
- 18.Sedgwick P. Pearson’s correlation coefficient. BMJ. 2012;345:e4483. doi: 10.1136/bmj.e4483. [DOI] [Google Scholar]
- 19.Huang DW, Sherman BT, Lempicki RA. Systematic and integrative analysis of large gene lists using DAVID bioinformatics resources. Nat Protocols. 2008;4(1):44–57. doi: 10.1038/nprot.2008.211. [DOI] [PubMed] [Google Scholar]
- 20.Huang DW, Sherman BT, Lempicki RA. Bioinformatics enrichment tools: paths toward the comprehensive functional analysis of large gene lists. Nucleic Acids Res. 2009;37(1):1–13. doi: 10.1093/nar/gkn923. [DOI] [PMC free article] [PubMed] [Google Scholar]
- 21.Routledge R. Fisher’s exact test. Encycl Biostat. 2005.
- 22.Kroll J, Fonseca A, de Souza S. Post-genomic Approaches in Cancer and Nano Medicine. 2015. Alternative splicing and cancer; p. 1. [Google Scholar]
- 23.Lu Y, Xu W, Ji J, Feng D, Sourbier C, Yang Y, et al. Alternative splicing of the cell fate determinant numb in hepatocellular carcinoma. Hepatology. 2015;62(4):1122–1131. doi: 10.1002/hep.27923. [DOI] [PMC free article] [PubMed] [Google Scholar]
- 24.Shilo A, Hur VB, Denichenko P, Stein I, Pikarsky E, Rauch J, et al. Splicing factor hnRNP A2 activates the Ras-MAPK-ERK pathway by controlling a-Raf splicing in hepatocellular carcinoma development. RNA. 2014;20(4):505–515. doi: 10.1261/rna.042259.113. [DOI] [PMC free article] [PubMed] [Google Scholar]
- 25.Urtasun R, Elizalde M, Azkona M, Latasa M, García-Irigoyen O, Uriarte I, et al. Splicing regulator SLU7 preserves survival of hepatocellular carcinoma cells and other solid tumors via oncogenic miR-17-92 cluster expression. Oncogene. 2016. [DOI] [PubMed]
- 26.Costa A, Afonso J, Osório C, Gomes AL, Caiado F, Valente J, et al. miR-363-5p regulates endothelial cell properties and their communication with hematopoietic precursor cells. J Hematol Oncol. 2013;6:87. doi: 10.1186/1756-8722-6-87. [DOI] [PMC free article] [PubMed] [Google Scholar]
- 27.Z-h C, Shen S-Q, Chen Z-b HC. Growth inhibition of hepatocellular carcinoma tumor endothelial cells by miR-204-3p and underlying mechanism. World J Gastroenterol. 2014;20(18):5493–5504. doi: 10.3748/wjg.v20.i18.5493. [DOI] [PMC free article] [PubMed] [Google Scholar]
- 28.Khuu C, Jevnaker AM, Bryne M, Osmundsen H. An investigation into anti-proliferative effects of microRNAs encoded by the miR-106a-363 cluster on human carcinoma cells and keratinocytes using microarray profiling of miRNA transcriptomes. Front Gen. 2014;5:246. doi: 10.3389/fgene.2014.00246. [DOI] [PMC free article] [PubMed] [Google Scholar]
- 29.Yang F, Zhang W, Shen Y, Guan X. Identification of dysregulated microRNAs in triple-negative breast cancer (review) Int J Oncol. 2015;46(3):927–932. doi: 10.3892/ijo.2015.2821. [DOI] [PubMed] [Google Scholar]
- 30.Neilson DE, Adams MD, Orr CM, Schelling DK, Eiben RM, Kerr DS, et al. Infection-triggered familial or recurrent cases of acute necrotizing encephalopathy caused by mutations in a component of the nuclear pore, RANBP2. Am J Hum Genet. 2009;84(1):44–51. doi: 10.1016/j.ajhg.2008.12.009. [DOI] [PMC free article] [PubMed] [Google Scholar]
- 31.Calabrò V, Pengue G, Bartoli PC, Pagliuca A, Featherstone T, Lania L. Positional cloning of cDNAs from the human chromosome 3p21–22 region identifies a clustered organization of zinc-finger genes. Hum Genet. 1995;95(1):18–21. doi: 10.1007/BF00225067. [DOI] [PubMed] [Google Scholar]
- 32.Dong X, Yang X, Wang Y, Chen W. Zinc-finger protein ZNF165 is a novel cancer-testis antigen capable of eliciting antibody response in hepatocellular carcinoma patients. Br J Cancer. 2004;91(8):1566–1570. doi: 10.1038/sj.bjc.6602138. [DOI] [PMC free article] [PubMed] [Google Scholar]
- 33.Kan H, Huang Y, Li X, Liu D, Chen J, Shu M. Zinc finger protein ZBTB20 is an independent prognostic marker and promotes tumor growth of human hepatocellular carcinoma by repressing FoxO1. Oncotarget. 2016. [DOI] [PMC free article] [PubMed]
Associated Data
This section collects any data citations, data availability statements, or supplementary materials included in this article.
Data Availability Statement
The authors confirm that all data underlying the findings are fully available without restriction. All data were stored in a secure database to maintain anonymity. But it can be accessed upon reasonable request.


