

Abstract
We describe a strategy for de novo peptide sequencing based on matched pairs of tandem mass spectra (MS/MS) obtained by collision induced dissociation (CID) and 351 nm ultraviolet photodissociation (UVPD). Each precursor ion is isolated twice with the mass spectrometer switching between CID and UVPD activation modes to obtain a complementary MS/MS pair. To interpret these paired spectra, we modified the UVnovo de novo sequencing software to automatically learn from and interpret fragmentation spectra, provided a representative set of training data. This machine learning procedure, using random forests, synthesizes information from one or multiple complementary spectra, such as the CID/UVPD pairs, into peptide fragmentation site predictions. In doing so, the burden of fragmentation model definition shifts from programmer to machine and opens up the model parameter space for inclusion of nonobvious features and interactions. This spectral synthesis also serves to transform distinct types of spectra into a common representation for subsequent activation-independent processing steps. Then, independent from precursor activation constraints, UVnovo’s de novo sequencing procedure generates and scores sequence candidates for each precursor. We demonstrate the combined experimental and computational approach for de novo sequencing using whole cell E. coli lysate. In benchmarks on the CID/UVPD data, UVnovo assigned correct full-length sequences to 83% of the spectral pairs of doubly charged ions with high-confidence database identifications. Considering only top-ranked de novo predictions, 70% of the pairs were deciphered correctly. This de novo sequencing performance exceeds that of PEAKS and PepNovo on the CID spectra and that of UVnovo on CID or UVPD spectra alone. As presented here, the methods for paired CID/UVPD spectral acquisition and interpretation constitute a powerful workflow for high-throughput and accurate de novo peptide sequencing.
TOC Graphic

Introduction
The adoption of high throughput bottom-up mass spectrometry for proteomics has accelerated rapidly in the past decade.1–3 Driven by improvements in both instrumentation and software interpretation of protein mass spectral data, more spectra of higher quality may be identified from an experiment than ever before. There have also been significant gains in de novo peptide sequencing, through which peptide sequences are inferred directly from the MS/MS spectra. De novo methods therefore offer a compelling approach that alleviates the reliance on annotated reference databases, but there remains significant room for further improvements.4–7 Limitations inherent in most MS/MS spectra prevent accurate and full-length de novo sequence assignment for standard bottom-up proteomics experiments, and the gap is being filled with ever more elaborate database search and custom processing pipelines for identification of unanticipated post-translational modifications, sequence variants, and other novel proteoforms.8
Our previous study illustrated how 351 nm ultraviolet photodissociation (UVPD) combined with protein carbamylation and chromophore derivatization of N-terminal amines alleviated two major obstacles to successful de novo sequencing: incomplete peptide sequence coverage, and spectral symmetry due to observation of both N and C-terminal ions.9 Here we describe a strategy that uses high-throughput collection of matched CID/UVPD spectral pairs in conjunction with de novo sequencing. The greater fragment ion diversity in CID spectra complements the y ions that predominate 351 nm UVPD mass spectra of chromophore-tagged peptides, and the combination of UVPD and CID spectra offers superior de novo sequencing performance compared to use of UVPD or CID alone.
The collection of paired spectra, in efforts to improve de novo sequencing, has over a decade of precedence.10–18 Matched spectra from a single precursor isolation window, when produced through different precursor activation methods, contain complementary information that can substantially improve sequencing performance. Savitski et al., in 2005, first described “proteomics-grade” de novo sequencing from high resolution CID/ECD spectral pairs.10 Many software tools now support sequencing of paired or triplet spectra, PEAKS and pNovo+ being the most popular.11–18 These programs are each limited to select combinations from CID, HCD, ETD, and ECD spectra. Here, we report on both the first methods for paired CID/UVPD acquisition and computational methods, implemented in the UVnovo software, to merge information from multiple spectra of the same peptide.
UVnovo uses a novel machine learning approach to spectral interpretation. From any type of peptide fragmentation process or combination of different processes, it can automatically learn how observed MS/MS peak features relate to true peptide fragmentation sites. These models are later employed for interpretation of unknown spectra. Thus, the generalized UVnovo framework removes a great burden from the programmer and obviates the need for explicit human definition of the fragment ions, their importance and correlation structure. We apply UVnovo to complementary pairs of UVPD and CID spectra and show that de novo sequencing performance is greatly improved relative to that for individual spectra.
Methods
Materials
Trypsin Gold (Promega, Madison, WI, USA), LC-MS grade acetonitrile and water (EMD Millipore; Darmstadt, Germany), phosphate buffered saline (PBS) and dimethyl sulfoxide (DMSO) (Thermo Fisher Scientific Inc.; San Jose, CA, USA), sulfosuccinimydyl-7-amino-4-methyl-coumarin-3-acetic acid (Sulfo-NHS-AMCA) (Pierce Biotechnology; Rockford, IL, USA) were used as received. E. coli lysate was graciously donated by Dr. M. Stephen Trent at the University of Georgia.
Mass spectrometry and paired CID/UVPD collection
We used a Thermo Velos Pro dual linear ion trap mass spectrometer (Thermo Fisher Scientific, San Jose, CA, USA) coupled to a 351 nm excimer laser (Coherent, Santa Clara, CA, USA) for UVPD in the ion trap.19 Collection of paired CID/UVPD data required modification of the standard data acquisition procedures, accomplished with custom scripts in Thermo Fisher Scientific’s proprietary ion trap control language (ITCL). Briefly, five CID/UVPD MS/MS pairs were collected for each survey MS1 scan. Spectra in a pair were acquired sequentially, CID then UVPD, both from the same precursor isolation window. As instructed in the custom ITCL code, the instrument collision energy (NCE) value was switched between 35 and 0 for the CID and UVPD scans, respectively. Under a non-zero NCE, precursor ions were retained for CID activation in the high-pressure cell, and the product ions were then shuttled to the low-pressure cell for detection. At an NCE of 0, the intact precursors were transferred immediately to the low-pressure cell and the laser pulsed to induce UVPD.
Sample preparation for UVPD analysis
Whole cell E. coli lysate was used for development and testing of the paired CID/UVPD acquisition and sequencing workflow presented here. Sample preparation and N-terminal chromophore peptide modification were performed as described previously.9 E. coli lysate was carbamylated to block the reactive primary amines of the lysine side-chains by mixing 50 μg of lysate in 50 mM sodium carbonate with 8 M urea and heating for 4 hours at 80 °C. The resulting carbamylated proteins were then buffer exchanged into PBS to remove urea and subsequently digested using trypsin at 37 °C overnight. After digestion, 25 μL of 20 mM AMCA in DMSO was added to the solution and kept in the dark overnight at room temperature. A C18 SPE cartridge was used to clean the samples and remove residual AMCA. Finally, the samples were dried and reconstituted for LC-MS/MS in 98% water/2% acetonitrile with 0.1% formic acid.
LC-MS/MS analysis and acquisition of a CID/UVPD dataset for benchmarking
Peptides were separated by reverse phase chromatography using a Dionex NSLC 3000 nanoLC (Thermo Scientific; Waltham, MA, USA) interfaced to the UVPD-enabled Thermo Velos Pro mass spectrometer described above. Samples eluted over a 360 min gradient, starting with 3% B and increasing to 50% B and under a flow rate of 300 nL/min. Mobile phase A was water with 0.1% formic acid (v/v), and mobile phase B was acetonitrile with 0.1% formic acid (v/v). Approximately 5 μg of peptide mixture was loaded on a 15 cm column, packed in-house with C18 stationary phase (3.5 μm particles of 140 Å pore size). Five precursor ions were selected following each MS1 scan. Fragmentation switched between CID (NCE 35, 10 ms) and UVPD (15 pulses at 500 Hz and 3 mJ per pulse), and a complementary pair of MS/MS were generated for each selected precursor ion.
UVnovo
UVnovo provides both de novo sequencing functionality and an automated training procedure for learning how to interpret new types and combinations of fragmentation spectra. Briefly, UVnovo trains a random forest (RF) model against previously identified spectra. It then applies the RF to unknown spectra generated through the same activation method(s) to predict the mass position of each subsequent precursor peptide residue. These predictions are put into a graphical model framework where each node represents the mass of a possible inter-residue amide bond, and each vertex between nodes spans the mass of a single amino acid. The best path through the graph maximizes the product of individual node probabilities and defines the de novo peptide sequence prediction. This spectrum inference and sequence prediction is repeated for each likely peptide length and at the observed precursor mass as well as at the observed mass −1 Da and +1 Da, to compensate for the low mass resolution afforded through ion trap analysis. This yields multiple sequence candidates for each precursor, and these are scored and ranked. A more thorough description of UVnovo is included in Supplemental Information (including Figures S1 – S2) and our previous publication.9
Benchmarking
SEQUEST
The E. coli CID/UVPD spectra from three replicate injections were processed using the SEQUEST and Percolator nodes in Proteome Discoverer v. 1.4 (Thermo Fisher Scientific, San Jose, Ca, USA). Both N-terminal AMCA and lysine carbamylation were required as fixed modifications, and optional methionine oxidation was allowed. Spectra were searched against a sequence database that included the UniProt E. coli strain K12 reference proteome and the MaxQuant common contaminants. We established a dataset for UVnovo training and validation from these search results and recognized each CID/UVPD pair as the top-ranked peptide spectrum match (PSM) from the CID spectrum. We limited this set to spectral pairs with high confidence PSMs (Percolator false discovery rate <%1) from doubly charged precursors with theoretical precursor mass within ± 1.6 Da of the observed value.
UVnovo
We evaluated UVnovo de novo sequencing performance on the CID/UVPD spectral pairs as well as on the individual sets of CID and UVPD spectra. Using a 3-fold cross validation (CV) regime, we were able to test performance against all PSMs while maintaining independence between the data used for training and testing. Spectra were divided based on their assigned peptide sequence into three partitions. In each of the three CV rounds, spectra and PSMs from two of the partitions were used for training an RF, with which UVnovo used for interpretation of ‘unknown’ spectra from the remaining partition.
The UVnovo sequence predictions for a given spectral pair, ranked by de novo score, were compared against the corresponding SEQUEST PSM. To be considered correct, we required each residue in the full-length PSM to correspond exactly in position and unit mass to a residue in the de novo sequence. In other words, no sequence gaps were allowed, and ambiguous residue pairs I/L and F/Moxidation were treated as equivalent in the comparison.
PEAKS and PepNovo
The performance of UVnovo was compared to that of the popular de novo sequencing programs PEAKS and PepNovo.11,20,21 As these programs were not designed to interpret UVPD spectra, we applied them only to the CID component of each spectral pair from the E. coli dataset. Individual program parameters were chosen for optimal analysis of low resolution CID spectra and are detailed in Supplemental Information. We filtered the results of PepNovo to exclude all predictions with sequence gaps and re-ranked the remaining sequences accordingly.
Results and Discussion
Paired CID and UVPD MS/MS
The general de novo sequencing workflow entailed protein carbamylation followed by tryptic digestion, derivatization with the chromophore AMCA, LC-MS/MS analysis, and lastly, data processing via UVNovo. Using whole cell E. coli lysate, proteins were carbamylated at all primary amines (lysines and N-termini) prior to digestion. Carbamylation proceeds with near 100% efficiency, and effectively blocks all lysine reactive sites, thus preventing their subsequent reaction.1 The carbamylated proteins were digested with trypsin, active now only C-terminal to arginine, and the resulting peptides were incubated with AMCA to install the chromophore at the new peptide N-terminal primary amines. Lacking the amine, the N-terminal peptide of each protein was not labeled. Derivatization with this UV chromophore rendered peptides susceptible to 351 nm UV photoactivation. LC–MS/MS of the AMCA-modified digest was performed using a dual cell linear ion trap mass spectrometer equipped with a 351 nm excimer laser. Following each MS1 survey scan, CID/UVPD spectral pairs were acquired for each of five selected precursors. Modification of the ion trap control software, required for collection of paired spectra, instructed the instrument to switch between CID in the high-pressure cell and UVPD in the low-pressure cell for alternating scans.
UVPD of AMCA-modified peptides produces spectra with a dominant y ion series. 351 nm photoactivation induces cleavage of the C–N peptide bonds and generates b- and y-type fragment ions.1 The b ions retain the N-terminal chromophore and are consequently annihilated with repeated laser pulses during UVPD, while the y ions were not activated further and survived in the trap. CID spectra from the same peptides display conventional b and y ions, the b ions shifted by +215.058 Da, the mass of AMCA. Figure 1 shows matched CID and UVPD spectra from the E. coli peptide K[AMCA, carbamyl]AAITAEIR.
Figure 1.
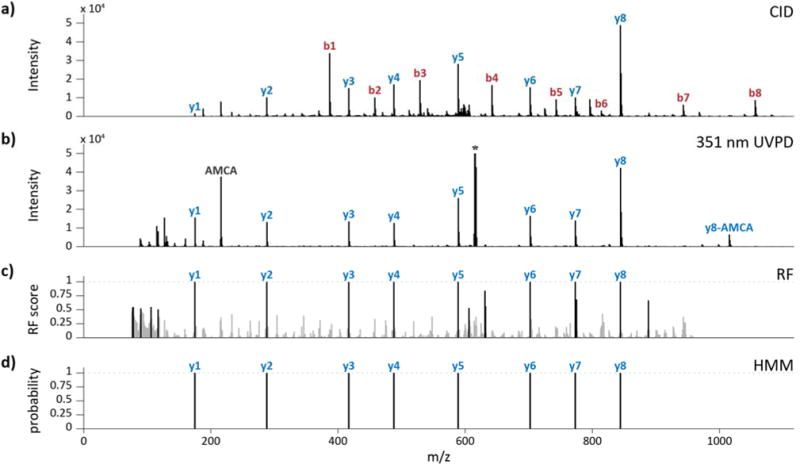
Example CID/UVPD pair for peptide K[AMCA, carbamyl]AAITAEIR and synthetic spectra derived from the pair. (a) CID (NCE 35) and (b) UVPD (3 mJ per pulse, 15 pulses). (c) A random forest algorithm merges both into a single synthetic spectrum. Peaks scoring below 0.5 are shaded gray. (d) A hidden Markov model assigns a probability to each possible fragmentation site. The precursor is labeled with an asterisk.
UVnovo overview
We initially developed UVnovo for de novo interpretation and sequencing of 351 nm UVPD mass spectra,9 and here we describe software improvements that allow de novo sequence inference from any type or combination of spectra. Spectra, individual or matched, are transformed using a random forest classifier into a single ‘spectrum’ of prediction scores for each potential N-terminal fragmentation site (Figure 1c). High-scoring positions ideally manifest as a complete and clean sequence ladder traversal of the parent peptide in the N- to C-terminal direction. UVnovo uses hidden Markov models to both identify and score peptide sequences which fit the RF-generated spectra (Figure 1d). Multiple sequence predictions for each precursor are generated, one at each likely peptide length. To accommodate for precursor mass errors, RF spectral synthesis and de novo sequencing are performed using the instrument-assigned precursor mass and again at −1 and +1 Da from the given mass. All predictions for a given precursor are then ranked by the de novo sequence score.
Machine learning for spectral interpretation
UVnovo differs from most other de novo sequencing programs in how it models and interprets fragmentation spectra.1 Most such programs are constructed around the offset frequency function (OFF), which represents a descriptive statistical model for understanding and interpreting peptide fragmentation.22 Early implementations assumed independence between the expected fragmentation peaks or features (ex. b ions, neutral losses), and models now are able to capture simple feature dependencies, for example through use of a directed graph structure.20 The models are typically hand-tuned or provided a concrete set of fragment ions and dependencies, and for well-characterized types of spectra they can perform quite well.
In a departure from the frequency-based statistical models, UVnovo takes a machine learning approach, using a random forest algorithm, to automatically learn from and interpret mass spectra.1 Popular and powerful for machine learning application, random forests are ensembles composed of many individual binary decision trees.23 A major strength of decision trees and random forests is their ability to exploit a much larger space of features and feature interactions when compared to classical statistical models.24 The recent de novo sequencing program Novor employs this advantage through use of two large decision trees for spectral interpretation and scoring.25 UVnovo also combines and utilizes spectral features at a scale that is combinatorially impractical with OFF-based models.
Novor uses the same set of spectral features regardless of activation type; in contrast, UVnovo selects automatically those it finds most important from a much larger space of potential features.1 In this regard UVnovo follows the work of Datta and Bern, whose spectrum fusion algorithm used the OFF to learn features important for paired CID and ETD spectra interpretation.26 With these, it identified simple feature dependencies and constructed effective tree-augmented networks for making predictions. Unfortunately, the spectrum fusion algorithm was presented only as a demonstration of automated supervised learning and was not released for general use. UniNovo also applies the OFF in a similar scheme for automated fragment ion learning.15 However, it does not permit user-defined peptide modifications or custom protease specificities, therefore precluding its use for UVPD spectra of AMCA-derivatized peptides.
UVnovo benchmarking on E. coli lysate
51,525 CID/UVPD spectral pairs (103,050 MS/MS spectra) were collected across three replicate injections. We processed the spectra using Proteome Discoverer SEQUEST with the Percolator node and identified with high-confidence 4,616 CID/UVPD pairs (all 2+) describing 1,842 unique peptides. These 4,616 pairs were applied for UVnovo testing, using 3-fold cross validation (CV) to maintain independence between training and testing examples. UVnovo generated predictions for each at its instrument-assigned precursor mass and additionally at −1 Da and +1 Da from observed. The use of the expanded mass offset was essential as 43% of pairs diverged from the assigned PSMs by ±1 Da. Therefore, each of the 4,616 CID/UVPD examples in the E. coli benchmark was provided potentially several putative de novo sequence assignments, and the predictions were scored and ranked.
We benchmarked the UVnovo predictions against the corresponding SEQUEST PSMs, counting a de novo sequence as correct if it matched exactly the PSM, with no gaps allowed. This is a more stringent criterion than commonly used for de novo benchmarks. Isobaric residues I/L and the residues F/Moxidation, indistinguishable in the ion trap, were judged equivalent. In addition to the CID/UVPD predictions, we ran UVnovo using only single scan types to compare the capacities of CID, UVPD, and paired spectra for de novo sequencing. Results are presented in Figures 2–5 and Table 1.
Figure 2.
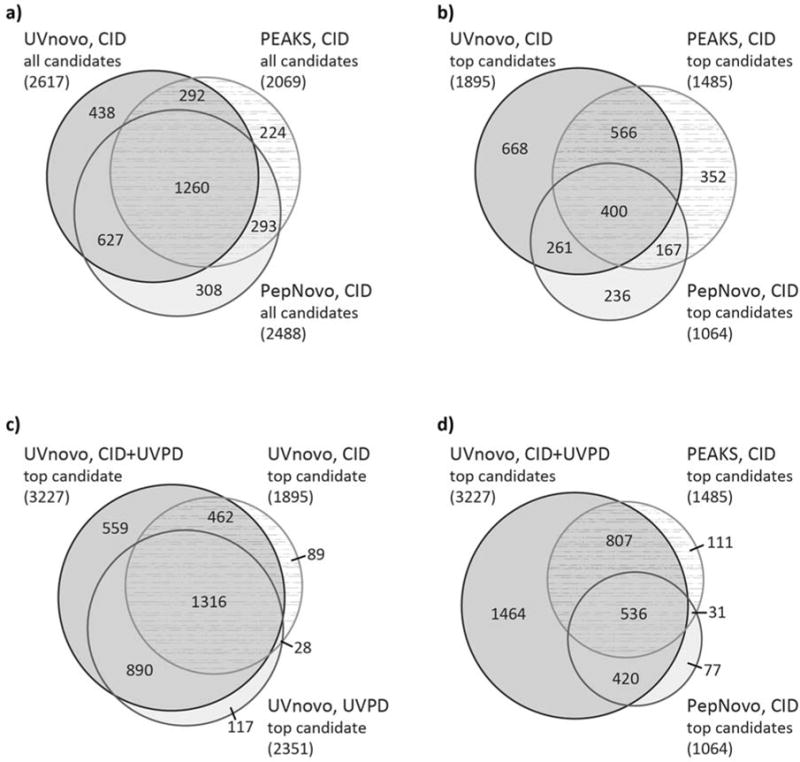
Overlap in de novo sequencing results from the E. coli lysate benchmarking dataset of 4,616 doubly charged CID/UVPD pairs. (a) Comparison of CID spectra identification between UVnovo-CID, PEAKS, and PepNovo. This considers all de novo candidates for each spectrum. (b-d) Only the top ranked de novo prediction for each spectrum or CID/UVPD pair is included.
Figure 5.
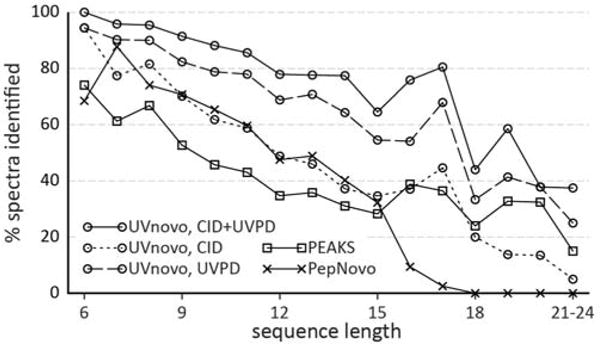
Fraction of sequences of each length with a correct de novo prediction.
Table 1.
Comparison of UVnovo, PEAKS, and PepNovo on the E. coli CID/UVPD Data Seta
| no. spectra identifiedb (fraction, %) | no. identifiedby top de novoc(fraction, %) | avg rankd | max rank | avg lengthe | no. peptidesidentifiedf(fraction, %) | |
|---|---|---|---|---|---|---|
| Total data set | 4616 | – | – | – | 11.43 | 1842 |
| UVnovo (CID + UVPD) | 3835 (83.1) | 3227 (69.9) | 1.23 | 11 | 11.00 | 1544 (83.8) |
| UVnovo (CID) | 2617 (56.7) | 1895 (41.1) | 1.47 | 11 | 10.44 | 1142 (62.0) |
| UVnovo (UVPD) | 3422 (74.1) | 2351 (50.9) | 1.60 | 14 | 10.86 | 1415 (76.8) |
| PEAKS (CID) | 2069 (44.8) | 1485 (32.2) | 1.70 | 10 | 10.61 | 1058 (57.4) |
| PepNovo (CID) | 2488 (53.9) | 1064 (23.05) | 4.80 | 44 | 10.08 | 1094 (59.4) |
The data set consists of charge 2+ CID/UVPD spectral pairs with high confidence sequence annotations.
Total number of spectral pairs (first row) and number of spectra/pairs with correct full length de novo predictions.
Number of spectra identified by top ranked de novo prediction.
Average rank of correct de novo predictions.
Average length of correct predictions.
Number of unique peptides identified.
The degree of overlap in the de novo sequencing results obtained from the analysis of all spectra and the 4,616 CID/UVPD pairs are summarized in Figure 2 with various comparisons showcased in Venn diagram format (all candidates or top-ranked candidates, as well as evaluation of CID spectra alone versus CID+UVPD). The top-ranked UVnovo sequence prediction correctly matched the corresponding PSM for 3,227 (69.9%) of the paired CID/UVPD spectra (Figure 2). In contrast, UVnovo sequencing on the individual spectral types produced 1,895 (41.1%) and 2,351 (50.9%) correct top-ranked predictions, for CID and UVPD respectively (Figure 2). When including the three best scoring de novo predictions for each precursor, UVnovo correctly sequenced 82.0% (CID/UVPD), 54.1% (CID) and 69.5% (UVPD) of the E. coli examples. There is substantial overlap in these correct assignments (Figure 3a).
Figure 3.
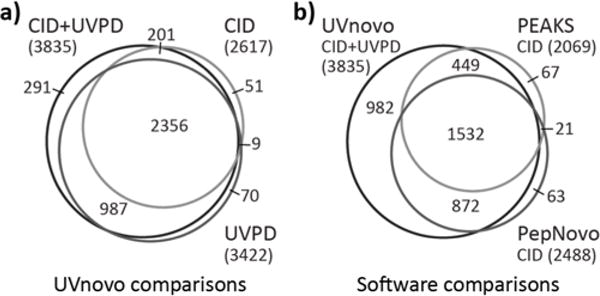
Counts and overlap of spectra that were identified correctly from the E. coli benchmark set. (a) UVnovo identifications from the paired, CID-only, and UVPD-only spectra. (b) Paired spectra UVnovo identifications and CID spectra identified through PEAKS and PepNovo. Numbers shown include correct de novo predictions of any rank.
We compare these results to those from CID-only analyses with PEAKS and PepNovo, which returned up to 10 and 50 sequence predictions for each spectrum, respectively. Neither program identified as many correct sequences as UVnovo for the CID spectra, let alone for the paired CID/UVPD data (Figure 4, Table 1). Only 151 (3.3%) of the 4616 total spectra were correctly recognized by one or both of PEAKS and PepNovo and not UVnovo-CID/UVPD. In contrast, UVnovo recovered 982 (21.3%) sequences from the paired spectra that were not identified by either PEAKS or PepNovo (Figure 3b).
Figure 4.
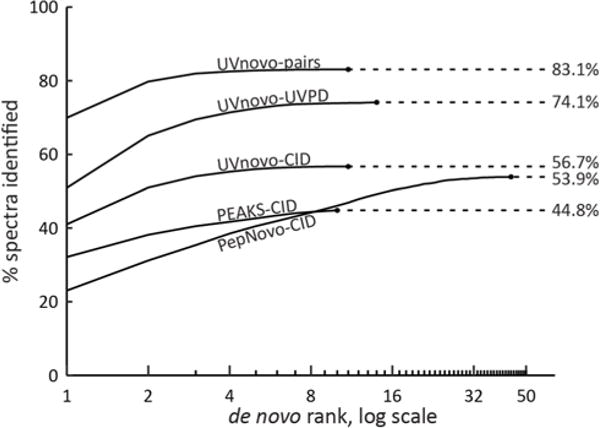
Cumulative fraction of correct de novo sequences by descending prediction rank on paired (UVnovo) and individual (UVnovo, PEAKS, and PepNovo) spectra. UVnovo interpretation of paired CID/UVPD outperforms that using only the CID or UVPD subset of spectra. The dataset contains 4616 charge 2+ paired spectra from E. coli lysate. Correct sequence predictions match the full-length SEQUEST PSM with no gaps allowed. I/L and F/Moxidation residue assignments are treated as equivalent.
The length of correct reconstructions averaged from 10.08 residues (PepNovo) to 11.00 residues (UVnovo-CID/UVPD), and PEAKS and all three UVnovo experiments identified peptides up to 24 residues long, the longest in our dataset (Figure 5). We also compare the ability of each program to score its predictions and discriminate between correct and incorrect sequences. In this regard, UVnovo and PEAKS greatly outperform PepNovo in ranking correct sequences highly (Figure 4). This is important in practice when the sequence identity is not known a priori.
These results show the advantage of UVPD for de novo sequencing, compared to CID, though the largest benefits are realized through synthesis of both CID and UVPD spectra, whereby UVnovo harnesses the best properties of each activation method.
UVPD provides comprehensive fragmentation and sequence directionality
UVPD fragmentation occurs consistently across a whole peptide, and the resulting spectra generally provide more complete sequence coverage than seen from CID. This characteristic is essential for successful full peptide sequencing and accounts for much of the difference in CID and UVPD performance, especially for longer peptides (Figure 5).
Additionally, the absence of abundant N-terminal ions in UVPD spectra of peptides tagged at their N-termini with chromophores eliminates one of the central problems in standard de novo analysis. Known as the ‘antisymmetric path problem’, confusion of ion series directionality can lead to inversions in the assigned de novo sequence.27 This is a factor for all fragmentation methods which generate symmetric pairs of N and C-terminal ions such as the b and y ion series of CID spectra. No commonly used proteomics workflows for de novo sequencing avoid this problem, though it can be alleviated through various specialized labeling and instrumentation methods.5,28 As presented here, our AMCA-derivatization and 351 nm UVPD workflow offers another way to overcome this problem.
CID complexity complements UVPD simplicity
The complexity of CID spectra is beneficial in combination with the interpretability of UVPD spectra. The symmetries in CID spectra are modeled automatically during UVnovo training as interactions between feature variables, for example those representing b and y ion peaks, and they influence spectral fragment site predictions. The additional b ions and neutral losses therefore substantiate true peptide fragmentation site predictions. Furthermore, the symmetry between b and y ions is effective for inference of the MS/MS precursor mass in UVnovo. UVPD spectra, lacking N- and C-terminal ion symmetries, do not provide such a means. When initialized with an incorrect precursor mass, N- and C-terminal features are misaligned relative to each other, and this is reflected in lower scoring RF predictions. Consequently, sequence predictions made using the correct precursor mass will typically score better.
The CID symmetries also improve deconvolution of signals from co-eluting peptides of differing precursor mass. Such discrimination between these ions is difficult or impossible when using only UVPD spectra, and this can lead to chimeric sequence predictions spanning the fragmentation sites of two or more peptide species. CID symmetries here provide a means to differentiate peptide ions from species of different mass, sometimes enabling de novo sequence generation for both. For example, UVnovo recovers from a single CID/UVPD pair the sequences ‘TENLYILPASQTR’ and ‘VYDALEVQNGNER’, with respective prediction ranks of 6 and 1 (Figure S2). ‘TENLYILPASQTR’ matches the SEQUEST PSM and was also identified by PepNovo (rank 4), and both sequences appear as tryptic peptides in the E. coli database, differing in mass by 0.92 Da. The b and y ion symmetries manifest differently for each and allow correct sequencing for both.
Future improvements
These results for paired spectra are comparable to the current state of the art in de novo peptide sequencing, where high resolution mass spectrometry is widely considered to be “exceedingly important.”29 That the CID/UVPD data was collected on a low resolution ion trap mass spectrometer illustrates the power of 351 nm UVPD for de novo analysis, either stand-alone or when complemented with a second activation method. We expect translation of our methods to high resolution CID/UVPD acquisition and analysis will bring significant improvements. Of the incorrect E. coli CID/UVPD sequence assignments, around half differ at only one fragment site from the corresponding PSM. High resolution MS/MS spectra, or even an accurate precursor mass, would help substantially in correcting these point errors. It could also improve local sequence confidence scoring and the ability to fill sequence gaps.30,31
Conclusions
We achieve accurate and comprehensive de novo peptide sequencing through a combined experimental and computational approach. Key to this success, the MS workflow generates both conventional MS/MS spectra exhibiting b/y ions and y-only mass spectra. The latter is a unique feature of 351 nm UVPD for peptides tagged with chromophores at the N-termini. For de novo analysis of these complementary CID/UVPD spectral pairs, we have generalized the machine learning framework of the UVnovo software to work with matched MS/MS produced through any combination of precursor activation methods. Provided a set of training examples, UVnovo effectively learns from and then utilizes the best properties of each activation method. We are not aware of any other software that provides such flexibility for interpreting any combination of complementary spectra.
Applied here to CID/UVPD paired spectra, UVnovo concurrently synthesizes evidence from both to derive stronger predictions of peptide bond location (fragmentation site) than either spectrum would provide on its own. In general, the UVPD spectra provide comprehensive fragmentation coverage and a clear directionality for ion series, while the symmetries and redundancies in CID spectra are necessary for precursor mass assignment and improve fragmentation site discrimination.
We identify correct full-length de novo sequences for 83% of spectral pairs using this matched CID/UVPD approach, benchmarking on an E. coli lysate dataset of doubly charged spectral pairs with high-confidence PSMs. These results, obtained from low-resolution ion trap mass spectra, demonstrate the effectiveness of CID/UVPD paired spectra for de novo peptide sequencing and the power of automated machine learning applied to new spectral acquisition methods. Continued development of UVPD workflows, on high resolution instrumentation and perhaps using alternatives to CID, will offer exciting prospects for the future of de novo proteome analysis.
Supplementary Material
Acknowledgments
Funding from the NSF (CHE-1402753) and the Welch Foundation (F-1155) to J.B., and from the NIH, NSF, ARO award W911NF-12-1-0390, Welch Foundation (F-1515), DARPA and DTRA to E.M.M. is acknowledged. JRC acknowledges support from NIH 1K12GM102745. All data and analysis results are publicly available at ProteomeXchange with accession ID PXD006038. UVnovo is available at https://github.com/marcottelab/UVnovo.
Footnotes
Supporting Information: A more detailed description of the UVnovo sequencing and training algorithms is provided as well as the parameters used for PEAKS and PepNovo analysis. Supplemental figures include a plot of RF error relative to the number of feature used for training and an example of de novo sequence recovery from co-eluting peptides. This material is available free of charge via the Internet at http://pubs.acs.org.
References
- 1.Richards AL, Merrill AE, Coon J. J Curr Opin Chem Biol. 2015;24:11–17. doi: 10.1016/j.cbpa.2014.10.017. [DOI] [PMC free article] [PubMed] [Google Scholar]
- 2.Mayne J, Ning Z, Zhang X, Starr AE, Chen R, Deeke S, Chiang C-K, Xu B, Wen M, Cheng K, Seebun D, Star A, Moore JI, Figeys D. Anal Chem. 2016;88(1):95–121. doi: 10.1021/acs.analchem.5b04230. [DOI] [PubMed] [Google Scholar]
- 3.Zhang Y, Fonslow BR, Shan B, Baek M-C, Yates JR. Chem Rev. 2013;113:2343–2394. doi: 10.1021/cr3003533. [DOI] [PMC free article] [PubMed] [Google Scholar]
- 4.Frank AM, Savitski MM, Nielsen ML, Zubarev RA, Pevzner PA. J Proteome Res. 2007;6:114–123. doi: 10.1021/pr060271u. [DOI] [PMC free article] [PubMed] [Google Scholar]
- 5.Seidler J, Zinn N, Boehm ME, Lehmann WD. PROTEOMICS. 2010;10:634–649. doi: 10.1002/pmic.200900459. [DOI] [PubMed] [Google Scholar]
- 6.Hughes C, Ma B, Lajoie GA. In: Proteome Bioinformatics. Hubbard SJ, Jones AR, editors. Vol. 604. Humana Press; Totowa, NJ: 2010. pp. 105–121. [Google Scholar]
- 7.Medzihradszky KF, Chalkley RJ. Mass Spectrom Rev. 2015;34:43–63. doi: 10.1002/mas.21406. [DOI] [PMC free article] [PubMed] [Google Scholar]
- 8.Nesvizhskii AI. Nat Methods. 2014;11:1114–1125. doi: 10.1038/nmeth.3144. [DOI] [PMC free article] [PubMed] [Google Scholar]
- 9.Robotham SA, Horton AP, Cannon JR, Cotham VC, Marcotte EM, Brodbelt JS. Anal Chem. 2016;88:3990–3997. doi: 10.1021/acs.analchem.6b00261. [DOI] [PMC free article] [PubMed] [Google Scholar]
- 10.Savitski MM, Nielsen ML, Kjeldsen F, Zubarev RA. J Proteome Res. 2005;4:2348–2354. doi: 10.1021/pr050288x. [DOI] [PubMed] [Google Scholar]
- 11.Ma B, Zhang K, Hendrie C, Liang C, Li M, Doherty-Kirby A, Lajoie G. Rapid Commun Mass Spectrom. 2003;17:2337–2342. doi: 10.1002/rcm.1196. [DOI] [PubMed] [Google Scholar]
- 12.Chi H, Chen H, He K, Wu L, Yang B, Sun R-X, Liu J, Zeng W-F, Song C-Q, He S-M, Dong M-Q. J Proteome Res. 2012;12:615–625. doi: 10.1021/pr3006843. [DOI] [PubMed] [Google Scholar]
- 13.Bertsch A, Leinenbach A, Pervukhin A, Lubeck M, Hartmer R, Baessmann C, Elnakady YA, Müller R, Böcker S, Huber CG, Kohlbacher O. ELECTROPHORESIS. 2009;30:3736–3747. doi: 10.1002/elps.200900332. [DOI] [PubMed] [Google Scholar]
- 14.He L, Ma B. J Bioinform Comput Biol. 2010;8:981–994. doi: 10.1142/s0219720010005099. [DOI] [PubMed] [Google Scholar]
- 15.Jeong K, Kim S, Pevzner PA. Bioinformatics. 2013;29:1953–1962. doi: 10.1093/bioinformatics/btt338. [DOI] [PMC free article] [PubMed] [Google Scholar]
- 16.Guthals A, Clauser KR, Frank AM, Bandeira N. J Proteome Res. 2013;12:2846–2857. doi: 10.1021/pr400173d. [DOI] [PMC free article] [PubMed] [Google Scholar]
- 17.Yan Y, Kusalik AJ, Wu FX. 2014 IEEE International Conference on Bioinformatics and Biomedicine (BIBM) 2014:150–155. [Google Scholar]
- 18.An M, Zou X, Wang Q, Zhao X, Wu J, Xu L-M, Shen H-Y, Xiao X, He D, Ji J. Anal Chem. 2013;85:4530–4537. doi: 10.1021/ac4001699. [DOI] [PubMed] [Google Scholar]
- 19.Gardner MW, Smith SI, Ledvina AR, Madsen JA, Coon JJ, Schwartz JC, Stafford GC, Brodbelt JS. Anal Chem. 2009;81:8109–8118. doi: 10.1021/ac901313m. [DOI] [PMC free article] [PubMed] [Google Scholar]
- 20.Frank A, Pevzner P. Anal Chem. 2005;77:964–973. doi: 10.1021/ac048788h. [DOI] [PubMed] [Google Scholar]
- 21.Frank AM. J Proteome Res. 2009;8:2241–2252. doi: 10.1021/pr800678b. [DOI] [PMC free article] [PubMed] [Google Scholar]
- 22.Dančík V, Addona TA, Clauser KR, Vath JE, Pevzner PA. J Comput Biol. 1999;6:327–342. doi: 10.1089/106652799318300. [DOI] [PubMed] [Google Scholar]
- 23.Breiman L. Mach Learn. 2001;45:5–32. [Google Scholar]
- 24.Malley JD, Kruppa J, Dasgupta A, Malley KG, Ziegler A. Methods Inf Med. 2011;51:74–81. doi: 10.3414/ME00-01-0052. [DOI] [PMC free article] [PubMed] [Google Scholar]
- 25.Ma B. J Am Soc Mass Spectrom. 2015;26:1885–1894. doi: 10.1007/s13361-015-1204-0. [DOI] [PMC free article] [PubMed] [Google Scholar]
- 26.Datta R, Bern M. J Comput Biol. 2009;16:1169–1182. doi: 10.1089/cmb.2009.0122. [DOI] [PubMed] [Google Scholar]
- 27.Song Y, Yu M. Inf Process Lett. 2015;115:377–381. [Google Scholar]
- 28.Brownstein NC, Guan X, Mao Y, Zhang Q, DiMaggio PA, Xia Q, Zhang L, Marshall AG, Young NL. Rapid Commun Mass Spectrom. 2015;29:659–666. doi: 10.1002/rcm.7137. [DOI] [PubMed] [Google Scholar]
- 29.Ma B, Johnson R. Mol Cell Proteomics. 2012;11:1–16. doi: 10.1074/mcp.O111.014902. [DOI] [PMC free article] [PubMed] [Google Scholar]
- 30.Pan C, Park BH, McDonald WH, Carey PA, Banfield JF, VerBerkmoes NC, Hettich RL, Samatova NF. BMC Bioinformatics. 2010;11:118. doi: 10.1186/1471-2105-11-118. [DOI] [PMC free article] [PubMed] [Google Scholar]
- 31.Spengler B. J Am Soc Mass Spectrom. 2004;15:703–714. doi: 10.1016/j.jasms.2004.01.007. [DOI] [PubMed] [Google Scholar]
Associated Data
This section collects any data citations, data availability statements, or supplementary materials included in this article.