Abstract
The apolipoprotein A5 gene (APOA5) has been repeatedly implicated in lowering plasma triglyceride levels. Since several studies have demonstrated that hyperinsulinemia is associated with hypertriglyceridemia, we sought to determine whether APOA5 is regulated by insulin. Here, we show that cell lines and mice treated with insulin down-regulate APOA5 expression in a dose-dependent manner. Furthermore, we found that insulin decreases human APOA5 promoter activity, and subsequent deletion and mutation analyses uncovered a functional E box in the promoter. Electrophoretic mobility shift and chromatin immunoprecipitation assays demonstrated that this APOA5 E box binds upstream stimulatory factors (USFs). Moreover, in transfection studies, USF1 stimulates APOA5 promoter activity, and the treatment with insulin reduced the binding of USF1/USF2 to the APOA5 promoter. The inhibition of the phosphatidylinositol 3-kinase (PI3K) pathway abolished insulin's effect on APOA5 gene expression, while the inhibition of the P70 S6 kinase pathway with rapamycin reversed its effect and increased APOA5 gene expression. Using an oligonucleotide precipitation assay for USF from nuclear extracts, we demonstrate that phosphorylated USF1 fails to bind to the APOA5 promoter. Taken together, these data indicate that insulin-mediated APOA5 gene transrepression could involve a phosphorylation of USFs through the PI3K and P70 S6 kinase pathways that modulate their binding to the APOA5 E box and results in APOA5 down-regulation. The effect of exogenous hyperinsulinemia in men showed a decrease in the plasma ApoAV level. These results suggest a potential contribution of the APOA5 gene in hypertriglyceridemia associated with hyperinsulinemia.
Several epidemiological studies have established that, in addition to an elevated cholesterol level in low-density lipoprotein and reduced cholesterol level in high-density lipoprotein (HDL), hypertriglyceridemia is an independent risk factor for coronary heart diseases (12, 22). Moreover, hypertriglyceridemia is often associated with the metabolic syndrome that characterizes diabetes and obesity (21, 35). Type 2 diabetes is frequently linked to hyperglycemia, hyperinsulinemia, and hypertriglyceridemia, and the leading cause of death for individuals with diabetes is cardiovascular diseases (34).
The apolipoprotein A5 gene (APOA5) was identified through comparative sequence analysis of genomic DNA sequences and has been shown to be important in determining plasma triglyceride levels in mice and humans (42). This gene is mainly expressed in the liver and resides in HDL and very low density lipoprotein particles (42, 59). It has been demonstrated that mice expressing a human APOA5 transgene showed a decrease in plasma triglyceride concentration to one-third the levels in control mice. Conversely, knockout mice lacking APOA5 had four times as much plasma triglycerides as controls. Moreover, adenoviral overexpression of APOA5 reduced serum levels of triglycerides and cholesterol in mice (60). Recent works focused on the triglyceride-lowering mechanism demonstrated an interaction between ApoAV, lipoprotein lipase, and ApoCIII (2, 18, 48, 64). Furthermore, strong genetic associations have been described between polymorphisms in the APOA5 gene and triglyceride concentrations in humans (1, 3, 15, 36, 37, 45, 51, 57). Finally, peroxisome proliferator-activated receptor α (PPARα) agonists are known to have hypotriglyceridemic effect, and several recent studies demonstrated that the APOA5 gene is highly up-regulated by PPARα and the farnesoid X receptor (44, 61).
Insulin plays a major role in the regulation of carbohydrate and lipid metabolism in liver, adipose tissue, and muscle. A wide variety of biological responses are regulated by insulin in coordination with other hormones, such as glucagon, to maintain glucose homeostasis. Hepatic fatty acid oxidation, lipogenesis, and protein synthesis are subject to regulation by insulin (41). Insulin controls the lipid synthesis from glucose in liver and adipose tissue and controls the exportation of fatty acids into lipoproteins from the liver to the extrahepatic organs. Some of these effects are exerted on the transcription level through a cascade of events. Binding of insulin to the insulin receptor on cell membrane triggers tyrosine kinase activity of the insulin receptor and results in its autophosphorylation within the cytoplasmic domain (8, 40). Tyrosine-phosphorylated insulin receptor then interacts with insulin receptor substrates (IRSs). Phosphorylation of IRS-1 and IRS-2 on the tyrosine residues then results in the recruitment and activation of divergent signaling molecules, including those in the Ras/mitogen-activated protein (MAP) kinase and the phosphatidylinositol 3-kinase (PI3K) pathways. One of the major downstream mediators of PI3K is the protein kinase B (PKB)/Akt (5, 17, 30-32). PI3K has also been suggested to activate P70 S6 kinase, which is thought to be important for stimulation of protein synthesis by insulin (11). While the Ras/MAP kinase pathway is believed to play an important role in the mitogenic effects of insulin (27, 40), PI3K is being demonstrated as an important mediator in metabolic regulation. Indeed, PI3K has been shown to mediate insulin inhibition of the transcription of the phosphoenolpyruvate carboxykinase (PEPCK) gene, which encodes the rate-limiting enzyme in gluconeogenesis (19, 55, 56), and insulin stimulation of the fatty acid synthase (FAS) promoter, a critical enzyme involved in lipogenesis (62). It is well known that insulin plays a key role in cardiovascular diseases through gene regulation of several apolipoproteins. In this regard, in HepG2 cells, insulin increases apolipoprotein A1 (APOA1), the major apolipoprotein component of HDL, which has an intrinsic antiatherogenic property (39, 50). In addition, insulin decreases apolipoprotein C3 (APOC3) in transgenic mice (9, 25), and APOC3 is positively associated with hypertriglyceridemia. Last, in cultured hepatocytes, insulin increases apolipoprotein A4 (APOA4), which plays a role in the prevention of atherosclerosis through the reverse cholesterol transport from peripheral tissues to the liver (14, 16, 53).
Upstream stimulatory factors (USFs) are ubiquitous members of the basic-helix-loop-helix (bHLH) family of transcription factors. First identified for their involvement in transcription from the adenovirus major late promoter (6, 38, 46), USF proteins were purified as two polypeptides of 43 and 44 kDa, termed USF1 and USF2, respectively (47). In addition to the bHLH structure, a leucine zipper is immediately adjacent and is also important for USF dimerization, and the two USF proteins bind to the 5′-CANNTG-3′ E-box motif with identical DNA binding specificity (52). USFs have been involved in the basal transcription of a number of genes including the FAS gene (7, 54, 62, 63). However, sterol response element binding protein 1 (SREBP-1) has been proposed by other authors as the FAS key activator (28). Indeed, SREBPs are bHLH-Zip transcription factors devoted to the control of genes involved in lipid metabolism, and unlike other members of the bHLH-Zip family, SREBPs were shown to bind not only to their specific target sites, namely the sterol response elements, but also to canonical E boxes (4, 29). In a recent paper, we demonstrated that the liver X receptor ligand T0901317 down-regulated APOA5 gene expression through activation of SREBP-1 (26).
The signaling pathways responsible for mediating the effects of insulin on lipid metabolism gene regulation are not well known. Since APOA5 is a critical apolipoprotein involved in triglyceride metabolism, we set out to investigate the regulation of the APOA5 gene by insulin and the signaling pathway involved in this regulation. In this report, we provide experimental evidence to demonstrate that insulin down-regulates APOA5 gene expression, and our results suggest that insulin regulation is mediated via the PI3K signaling pathway, which modulates the binding of USFs to APOA5 promoter.
MATERIALS AND METHODS
Cloning and construction of recombinant plasmids.
Human APOA5 promoter fragments (residues −304 to +63 [−304/+63], −146/+63, and −61/+63) were amplified by PCR by using an APOA5 genomic bacterial artificial chromosome clone as template and cloned in the pGL3 luciferase vector as reported previously (61). The following oligonucleotide primers were used for the PCR: forward, 5′-TCT GTT GGT GGG CCA GCC AG-3′, 5′-GGT GCC AGG GAA AGG GCA GG-3′, and 5′-CAA TTG GTG CCA GAG GCT CAG-3′; reverse, 5′-AAT GCC CTC CCT TAG GAC TGT GAC-3′. Site-directed mutagenesis (Stratagene) for the E box was done with following primer (mutated bases are indicated in bold): 5′-CTT TTG AAC TTC CCC GCG GTA TTT ACT CAG-3′.
Cell culture.
The human hepatic cell lines HepG2 and HuH7 were maintained in Dulbecco's modified Eagle's minimal (DMEM) medium containing 4.5 g of glucose per liter, supplemented with 10% fetal calf serum (FCS), 1% glutamine, 1% penicillin-streptomycin, 1% sodium pyruvate, and 1% nonessential amino acids (Invitrogen). The culture was maintained at 37°C in a humidified atmosphere containing 5% CO2. Medium was changed every other day. Before treatment, cells were deprived of glucose for 18 h. For experiments with the inhibitors of various signaling molecules, the cells were treated for 1 h with inhibitors at different concentrations (LY294002, 10 μM; wortmannin, 10 nM; PD98059, 10 μM; staurosporine, 5 nM; and rapamycin, 10 nM) before the addition of insulin. The same volume (less than 0.1% of the total volume of culture medium) of vehicle (dimethyl sulfoxide [DMSO]) was used as the negative control.
Primary rat hepatocytes.
Rat hepatocytes were isolated by collagenase perfusion from livers of Wistar rats as described previously (58). Hepatocytes (cell viability higher than 85% by trypan blue exclusion test) were cultured as a monolayer in serum-free William's E medium supplemented with 2 mM glutamine, 25 μg of gentamicin per ml, 100 nM dexamethasone, and 0.1% fatty acid-free bovine serum albumin (BSA) at 37°C in a humidified atmosphere containing 5% CO2. After a 6-h incubation, medium was changed to glucose-free DMEM supplemented with 2 mM glutamine, 25 μg of gentamicin per ml, 100 nM dexamethasone, 10 mM lactate, and 5.5 mM glucose. After overnight culture, cells were incubated for the indicated time in fresh culture medium supplemented with 2 mM glutamine, 25 μg of gentamicin per ml, and 100 nM dexamethasone.
Primary human hepatocytes.
Human hepatocytes were isolated from the liver of a 21-year-old woman. Hepatocytes were cultured in William's E medium supplemented with 10% FCS, 0.1% BSA, 10 nM T3, and 1 μM dexamethasone at 37°C in a humidified atmosphere containing 5% CO2. After 6 h of incubation, medium was changed to FCS-free medium supplemented with 0.1% BSA, 10 nM T3, and 1 μM dexamethasone for 18 h. Next, cells were incubated for 16 h in a culture medium deprived of glucose and FCS and supplemented with 100 nM dexamethasone and 10 nM T3. Finally, cells were treated in the same fresh medium with different concentrations of insulin as described in Results.
RNA extraction and real-time PCR analysis.
Total RNA from hepatic cells or mouse liver was extracted by using a NucleoSpin RNA II kit (Macherey-Nagel). An mRNA quantification analysis was performed after a reverse transcription by using random hexamer primers with the Omniscript Reverse transcriptase kit (QIAGEN), followed by a real-time PCR with the MX 4000 apparatus (Stratagene).
APOA5 mRNA was quantified and normalized with the 36B4 gene, which codes for the human acidic ribosomal phosphoprotein. Specific primers used for the amplifications are as follow: hAPOA5 forward, 5′-ACG CAC GCA TCC AGC AGA AC-3′; hAPOA5 reverse, 5′-TCG GAG AGC ATC TGG GGG TC-3′; rAPOA5 forward, 5′-GCC TGG GAA GGA GCC TCC TCG GC-3′; rAPOA5 reverse, 5′-GCT CCA TCA GCT CGA CCG TGT AGG G-3′; mAPOA5 forward, 5′-CTC TGT CCC ACA AAC TCA CAC G-3′; mAPOA5 reverse, 5′-AGG TAG GTG TCA TGC CGA AAA G-3′; 36B4 forward, 5′-CAT GCT CAA CAT CTC CCC CTT CTC C-3′; and 36B4 reverse, 5′-GGG AAG GTG TAA TCC GTC TCC ACA G-3′.
The PCR amplifications were performed with a Brilliant Quantitative PCR Core Reagent kit as recommended by the manufacturer (Stratagene). Independent experiments were done at least three times in triplicate. Levels of mRNA were expressed relative to untreated cells as means ± standard deviation (SD). Statistical significance was assessed with a Student's t test.
Animals and treatment.
Female C57BL/6 mice weighing between 20 to 25 g were purchased from Charles River Laboratories. Mice were maintained on standard rodent chow diet. Three groups of six mice were studied. After 4 h of fasting, mice were then injected intraperitoneally with 0.5 or 1 U of insulin per kg of body weight or with vehicle as a control. At 6 h after the injection of insulin, the livers were excised and snap-frozen in liquid nitrogen for total RNA extraction. Mouse apoa5 mRNA was quantified and normalized with the 36B4 gene.
Transient transfection assays.
Transfection studies were carried out with human hepatoma HepG2 cells in 24-well plates. Culture medium was changed to fresh medium in order to deprive the cells of glucose for 18 h. Transfection studies were performed at 50 to 60% confluency with jetPEI cationic polymer transfection reagent (Qbiogene). Cells were transfected with 3 μg of reporter vector, which contains the −304/+63 human APOA5 promoter fragment. Simultaneously, 300 ng of cytomegalovirus-β-galactosidase expression vector as a control was transfected in cells for transfection efficiency. For the deletion analysis, cells were transfected with different constructions of the human APOA5 promoter. Three luciferase constructs were used for this experiment: −304/+63, −146/+63, and −61/+63. After incubation for 2 h, cells were washed with phosphate-buffered saline solution and incubated for 24 h with different concentrations of insulin. Cells were lysed and the cytosolic fraction was collected. Luciferase activity was measured by using a Mithras LB 940 plate reader (Berthold Technologies) and normalized according to β-galactosidase activity. For the cotransfection experiments, 300 ng of USF1 expression vector was added for the precipitation.
Preparation of nuclear extracts, electrophoretic mobility shift assay (EMSA) and supershift assay.
HepG2 cells were untreated or treated with 10 nM insulin for 24 h, washed, resuspended in DMEM medium containing 10% FCS and 10% DMSO, and frozen in liquid nitrogen and conserved at −80°C. For the preparation of nuclear extracts, cells were centrifuged at 1,000 rpm for 5 min with an Eppendorf 5804R centrifuge and resuspended in 5 ml of buffer A (15 mM Tris-HCl [pH 8], 15 mM NaCl, 60 mM KCl, 0.5 mM EDTA, 1 mM phenylmethylsulfonyl fluoride). Cells were then centrifuged at 1,000 rpm for 5 min at 4°C, resuspended in 200 μl of buffer A with 0.05% Triton X-100, and centrifuged for 10 min with an Eppendorf 5804R centrifuge at 1,200 rpm. The pellet was washed with 5 ml of buffer A-0.05% Triton X-100 and then with 5 ml of buffer A. The nuclei were incubated in 50 μl of buffer A supplemented with 360 mM KCl at 4°C for 30 min and centrifuged for 5 min with an Eppendorf 5417R centrifuge at 13,000 rpm. Protein concentration was determined with a Bio-Rad protein assay. In vitro transcribed and translated human USF1 or unprogrammed reticulocyte lysate were synthesized by using a TNT Quick-Coupled Transcription/Translation System (Promega). To study the insulin regulatory region in the APOA5 gene, a synthetic double-stranded oligonucleotide from the human APOA5 gene was used: 5′-CTT TTG AAC TTC CAC GTG GTA TTT ACT CAG-3′. A 23-bp double-stranded oligonucleotide containing the E-box consensus for the binding of USFs (5′-CAC CCG GTC ACG TGG CCT ACA CC-3′) was used as a control probe. For mutation studies, the probe was done with the following primer (mutated bases are indicated in bold): 5′-CAC CCG GTC AAT TGG CCT ACA CC-3′. Double-stranded oligonucleotides were T4-polynucleotide kinase end labeled by using [γ-32P]ATP and purified by using a QIAquick Nucleotide Removal kit (QIAGEN). A total of 2.5 μg of nuclear extracts was preincubated in a total volume of 20 μl for 30 min on ice with 2.5 μg of poly(dI-dC) and 1 μg of herring sperm DNA in a binding buffer. For supershift experiments, 1 μg of anti-USF1, anti-USF2, or anti-SREBP1 antibodies (Santa Cruz Biotechnology) was added in this binding reaction. One microliter of end-labeled double-stranded oligonucleotide was added before a second incubation for 30 min on ice. Then, DNA-protein complexes were separated by electrophoresis on 5% polyacrylamide gels in 0.25× Tris-borate-EDTA buffer. The gel was dried and exposed to a film with an intensifying screen.
Oligonucleotide precipitation assay and Western blotting.
For this experiment, 5′ biotin-labeled oligonucleotides corresponding to the APOA5 E box used in EMSA were employed. Two microliters of double-stranded biotin-labeled oligonucleotides was incubated with 10 μg of nuclear extracts from HepG2 cells in an EMSA mixture for at least 1 h at 4°C. After three wash steps with EMSA binding buffer, 20 μl of streptavidin-Sepharose HP beads (Amersham Bioscience) was added in the oligonucleotide protein complex for 1 h at 4°C. Then, samples were centrifuged, washed, and boiled. Proteins were separated on 10% polyacrylamide gels with sodium dodecyl sulfate (SDS) and incubated with antibodies as recommended by the manufacturer (Santa Cruz Biotechnology). After electrophoretic transfer to nitrocellulose membranes and blocking, the membranes were incubated with polyclonal anti-USF1 and anti-USF2 antibodies (1:200 dilution) for 2 h at room temperature. After intensive washing, secondary antibody (1:10,000 dilution) was used for the detection of immunoreactive bands with an enhanced chemiluminescence detection system (Amersham Biosciences).
ChIP assay.
To detect the in vivo association of nuclear proteins with human APOA5 promoter, a chromatin immunoprecipitation (ChIP) assay was conducted as described by Upstate Biotechnology (Lake Placid, N.Y.) with some modifications. Briefly, HepG2 cells were cultured in a 10-cm culture dish for 3 days in standard culture conditions. Formaldehyde was then added to the medium at a final concentration of 1% for 10 min at 37°C. The cells were harvested, suspended with SDS lysis buffer (1% SDS, 10 mM EDTA, 50 mM Tris-HCl [pH 8.1]), and incubated on ice for 10 min. Lysates were sonicated, and debris was removed from the samples by centrifugation for 10 min with an Eppendorf 5417R centrifuge at 13,000 rpm. Supernatants were diluted 10-fold in immunoprecipitation buffer (0.01% SDS, 1.1% Triton X-100, 1.2 mM EDTA, 16.7 mM Tris-HCl [pH 8.1], 167 mM NaCl) and precleared with protein A-Sepharose beads that had been preabsorbed with salmon sperm DNA. The precleared chromatin solution was incubated with anti-USF1 antibodies (Santa Cruz) overnight at 4°C with rotation. For a negative control, a no-antibody immunoprecipitation was prepared by incubating the supernatant fraction with salmon sperm DNA and protein A-Sepharose beads for 1 h at 4°C with rotation. The immune complexes were then collected with the addition of protein A-Sepharose beads and washed successively in low-salt buffer (0.1% SDS, 1% Triton X-100, 2 mM EDTA, 20 mM Tris-HCl [pH 8.1], 150 mM NaCl), in high-salt buffer (same as the low salt buffer but with 500 mM NaCl), LiCl buffer (0.25 M LiCl, 1% NP-40, 1% deoxycholate, 1 mM EDTA, 10 mM Tris-HCl [pH 8.1]), and Tris-EDTA (pH 8.0). For detection of immunoprecipitated USF1, we performed immunoblot analysis. After several washes of the beads, each sample was completed with 25 μl of Laemmli buffer (Bio-Rad) and boiled for 10 min. The samples were subjected to 10% polyacrylamide gel electrophoresis under reducing conditions and transferred to nitrocellulose membrane to detect USF1 levels by using polyclonal anti-USF1 antibodies as described previously. For DNA study, each sample was eluted with freshly prepared 1% SDS and 0.1 M NaHCO3, and then cross-links were reversed with the addition of 5 M NaCl. Chromatin-associated proteins were digested with proteinase K (Sigma) (10 mg/ml) for 1 h at 45°C. The DNA was extracted with a QIAquick PCR purification kit (QIAGEN) and subjected to PCR amplification with the forward primer 5′-CCAGCCAGCAGGTCAGTG-3′ and the reverse primer 5′-CGTCTGGGCACAGAGAGC-3′, which were specifically designed from the APOA5 promoter. The 29-bp PCR products (−292/+6) were resolved by 2% agarose-ethidium bromide gel electrophoresis and visualized by UV. The PCR product was cloned into the pCRII-TOPO vector, and the recombinant vector was transformed into competent Escherichia coli with TOPO TA cloning kit (Invitrogen). The cloned PCR products were analyzed by sequencing and compared with the human APOA5 promoter sequence.
Insulin clamp study in humans.
Twelve healthy men participated in the study. All subjects underwent a history and physical examination and laboratory tests for exclusion of hepatic, renal, thyroid, and hematological abnormalities. None of the subjects used any medication. The purpose, nature, and potential risks of the studies were explained to the subjects before their written consent was obtained. The study protocol was approved by the ethical committee of the Helsinki University Central Hospital. All subjects were admitted at 7.30 a.m. to the metabolic ward of the Department of Medicine, University of Helsinki, after an overnight (12-h) fast. An indwelling cannula was inserted in an antecubital vein for infusions. A second cannula was inserted retrogradely into a heated hand vein to obtain arterialized venous blood for blood samplings. The study design allowed each subject to serve as his own control. At time zero, infusion of saline or insulin was started. The euglycemic clamp study was performed as previously described (13). Insulin (Actrapid Human; Novo Nordisk, Copenhagen, Denmark) was infused in a primed continuous manner at a rate of 1 mU/kg of body weight/min for 8 h. Normoglycemia was maintained by adjusting the rate of a 20% glucose infusion based on plasma glucose measurements which were performed at 5-min intervals. Measurements of ApoAV protein level in human plasma were done as described previously (18).
RESULTS
APOA5 gene expression is down-regulated by insulin in a dose-dependent manner in hepatocytes.
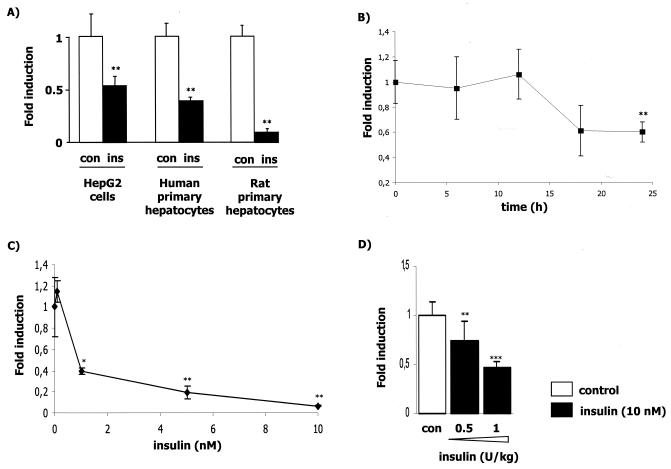
To determine whether insulin can modulate APOA5 gene expression in a human HepG2 cell line and in both primary human and rat hepatocytes, we analyzed APOA5 mRNA levels after a 24-h treatment with insulin (10 nM). We observed a down-regulation of APOA5 gene expression in all cellular models (Fig. 1A). In HepG2 cells and human primary hepatocytes at 10 nM of insulin, APOA5 gene expression is reduced by 46 and 60%, respectively, after 24 h of treatment, while apoa5 gene expression in rat primary hepatocytes is reduced by 90% (Fig. 1A). In another human hepatic cell line, HuH7, we found that the maximum decrease in APOA5 gene expression was reached 24 h after insulin treatment (Fig. 1B). We also demonstrated that in rat primary hepatocytes the insulin-mediated down-regulation of apoa5 is dose dependent (Fig. 1C). In this experiment, we also analyzed the expression of the apoc3 gene and confirmed its down-regulation by insulin (data not shown) as previously reported (9, 25).
FIG. 1.
Time- and dose-dependent down-regulation of APOA5 gene expression by insulin. APOA5 mRNA levels in hepatocytes were measured as described in Materials and Methods. (A) Effect of 10 nM insulin on APOA5 gene expression in different hepatocyte models treated during 24 h. The decrease (n-fold) in APOA5 gene expression is shown (black bars) versus control (white bar) (means ± SD; n = 3). (B) HuH7 cells were cultured for different times with 10 nM insulin. Results are representative of three independent experiments. (C) Primary rat hepatocytes were cultured for 24 h in the presence of increasing insulin concentrations up to 10 nM. (D) C57BL/6 mice were injected intraperitoneally with 0.5 or 1 U/kg of insulin (black bars) or vehicle as a control (white bars). Total RNA from liver was extracted 6 h after injection and subjected to a quantitative PCR using 36B4 as a normalizing gene. The decrease (n-fold) in apoa5 gene expression is shown (means ± SD; n = 6). Statistically significant differences between groups versus control were obtained with a Student t test and are indicated by asterisks (*, 0.01 < P < 0.05; **, 0.0001 < P < 0.01; and ***, P < 0.0001).
To investigate the regulation of apoa5 by insulin in vivo, C57BL/6 mice were injected with 0.5 or 1 U/kg of insulin. Six hours later, the mice were sacrificed, RNA was extracted from liver, and apoa5 gene expression was analyzed by quantitative PCR. A significant dose-dependent decrease in apoa5 mRNA levels was observed (Fig. 1D). In mice treated with 1 U/kg of insulin, apoa5 gene expression was decreased by 53% versus controls. In this experiment, no triglyceride level was observed (data not shown).
Effects of cycloheximide and actinomycin D on APOA5 mRNA expression.
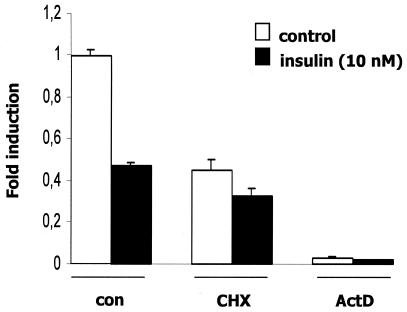
To investigate whether the insulin repression of APOA5 mRNA was dependent on ongoing protein synthesis, HuH7 cells were treated with the translation inhibitor cycloheximide prior to insulin treatment (Fig. 2). Treatment of cells with cycloheximide partially repressed APOA5 mRNA expression, indicating that proteins as the transcription factors are likely involved in the basal transcription of the APOA5 gene. However, the down-regulation of APOA5 mRNA remains unchanged after insulin treatment, showing that de novo protein synthesis is not implicated in the insulin-mediated down-regulation of APOA5 mRNA gene expression. To further define the mechanism underlying the decreased APOA5 steady-state mRNA level observed after insulin treatment, we tested whether this down-regulation was a result of changes in transcription. Thus, experiments were performed in HuH7 cells with the RNA polymerase II inhibitor actinomycin D prior to insulin treatment, which showed that APOA5 mRNA expression is dramatically decreased when transcription is inhibited. These results clearly suggested that APOA5 gene expression required ongoing transcription.
FIG. 2.
Effects of cycloheximide and actinomycin D on insulin down-regulation of APOA5 mRNA. Hepatocytes were pretreated with cycloheximide (CHX; 5 μg/ml) or actinomycin D (ActD; 2.5 μg/ml) for 2 h or 90 min, respectively, and treated during 6, 12, or 24 h with 10 nM insulin. Results obtained after 24 h of treatment are shown. The APOA5 steady-state mRNA levels were measured by quantitative PCR using 36B4 as a normalizing gene. Experiments were repeated at least three times, and a representative result is shown.
The human APOA5 promoter activity is decreased by insulin and contains a functional E box.
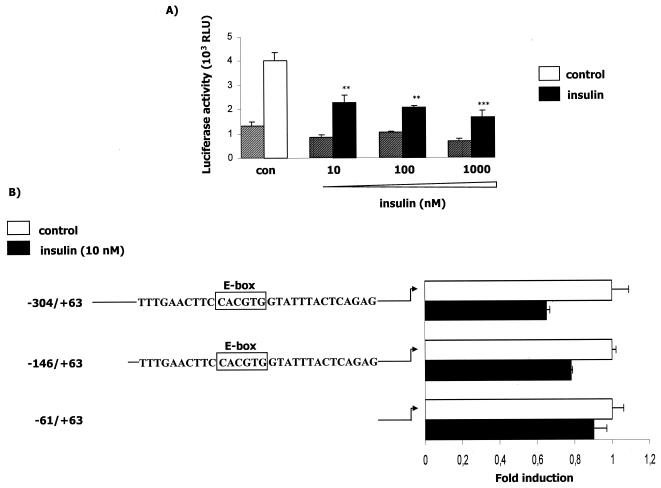
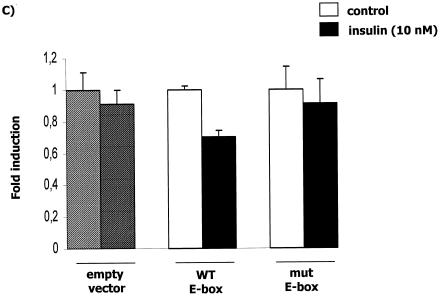
To determine if the insulin repression of human APOA5 mRNA levels occurs at the transcriptional level, we analyzed the promoter activity in transiently transfected cells. We observed that insulin strongly down-regulated promoter activity, with a nearly 70% decrease when transfected cells were treated with the highest concentration of insulin (Fig. 3A). This result supports the notion that the regulation of human APOA5 by insulin occurs at the transcriptional level. Deletion analyses were performed by transient transfections of HepG2 cells with three different constructs of the human APOA5 promoter (Fig. 3B). After 24 h of treatment with insulin, the promoter activity with the transfected −304/+63 and −146/+63 fragments was decreased. The effect of insulin on promoter activity was abolished when cells were transfected with the −61/+63 fragment. These results suggested the presence of a responsive element to insulin in the human APOA5 promoter spanning the differential region from −146 to −61. This response element is hypothesized to be responsible for the insulin-mediated transrepression of APOA5 gene expression. Then we performed transfection experiments with an APOA5 promoter fragment containing the mutated E box (Fig. 3C). The effect of insulin on APOA5 promoter is abolished when the E box is mutated. Experiments were controlled by the decrease of the promoter activity due to the insulin treatment of transfected cells.
FIG. 3.
Effect of insulin on the human APOA5 promoter activity, deletion analysis of the APOA5 promoter, and c functional analysis of the APOA5 E-box element. (A) HepG2 cells were transfected with empty reporter plasmid (striped bars) or the −304/+63 human APOA5 promoter fragment reporter plasmid (full bars). Cells were treated with different concentrations of insulin and were lysed after 24 h of treatment. (B) Schematic illustration of the reporter constructs used in the transfection studies. Boxed sequences represent the E box. Cells were transfected with different human APOA5 promoter fragment reporter plasmids and treated with insulin. After 24 h of treatment, the luciferase activity was measured. (C) HepG2 cells were transfected with the APOA5 promoter fragment containing the wild-type E box and with a construction containing a mutation of this E box. The luciferase activity was measured and expressed as described in Materials and Methods. Results were expressed as means ± SD (n = 3). Experiments were repeated at least three times, and a representative result is shown. Statistically significant differences between groups versus control were obtained with a Student's t test and are indicated by asterisks (*, 0.01 < P < 0.05; **, 0.0001 < P < 0.01; and ***, P < 0.0001). White bars represent the control without insulin, and black bars represent the promoter activity after a treatment with insulin.
Insulin decreased the binding of USFs to the APOA5 E box.
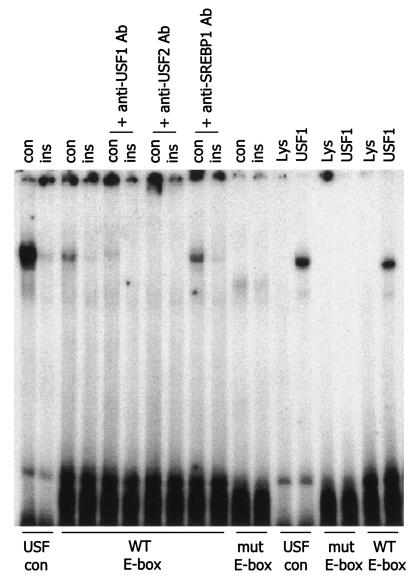
Through sequence analysis of the APOA5 promoter, we identified a potential E-box element, 5′-CACGTG-3′ at −76/−81, that is strongly homologous with the consensus E box. Nuclear extracts from insulin-treated cells were tested in an EMSA assay by using three probes: a USF consensus E box as the control probe, a wild-type APOA5 E box containing probe, and a mutated APOA5 E box containing probe. The results clearly showed a decrease in the nucleoprotein binding with extracts from insulin-treated cells (Fig. 4). Since the USFs were initially identified by their ability to bind to the E box, we investigated whether these transcription factors are involved in APOA5 gene regulation. To elucidate which transcription factor is implicated in this regulation, we tested whether the band observed in the gel shift assay with nuclear extracts is affected by the addition of specific antibodies. As shown in Fig. 4, the anti-USF1 or anti-USF2 antibodies disrupted the band and resulted in a supershift. It was verified that no crossing exists between these two specific antibodies, whereas in this assay no supershift was observed with anti-SREBP-1 antibody. Indeed, SREBP is known as another important transcription factor that binds E box and plays a crucial role in lipid metabolism. Results were confirmed by using the in vitro transcribed-translated human USF1, which binds to the APOA5 E box. Last, when the APOA5 E box is mutated, the binding of USF is abolished. Here, our data strongly support the notion that USF1 and USF2 are involved in the APOA5 gene regulation at the transcriptional level.
FIG. 4.
EMSA and supershift assay of nuclear extracts. Experiments were performed with nuclear extracts from HepG2 cells or with in vitro transcribed-translated human USF1 or unprogrammed reticulocyte lysate. Each reaction contained 2.5 μg of nuclear extracts, 1× gel shift reaction buffer, 2.5 μg of poly(dI-dC), 1 μg of herring sperm DNA, and 1 μl of [γ-32P]ATP-labeled probe. Three probes were used for experiments: a USF consensus E box as the control (con) probe, a wild-type (WT) APOA5 E-box-containing probe, and a mutated (mut) APOA5 E-box-containing probe. For the supershift assay, 1 μg of specific antibodies was added in the reaction mixture. After incubations on ice, samples were applied to a 5% nondenaturing polyacrylamide gel. The gel was dried and exposed to a film with an intensifying screen. Experiments were repeated at least three times.
USF binds the APOA5 E box in vivo.
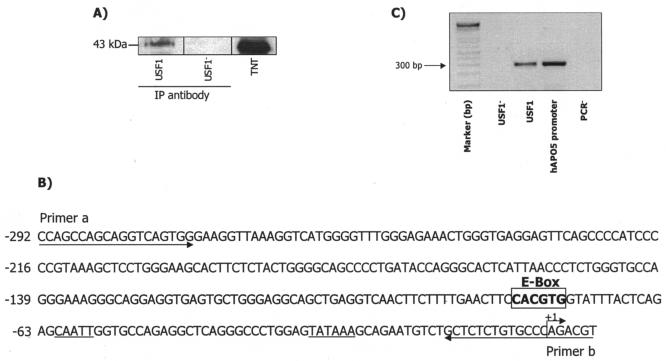
Having demonstrated the binding of transcription factor USF1 to the APOA5 promoter in vitro, we further analyzed by ChIP assay the in vivo binding of USF1 to APOA5 promoter. HepG2 cells were cultured in normal growth medium, and formaldehyde was added to cross-link the DNA-protein complexes in vivo. As a negative control, ChIP was performed without antibodies. As shown in Fig. 5A, cross-linked chromatin was immunoprecipitated with commercially available antibodies that specifically recognized human USF1. After sonication, immunoprecipitation, and reversal of cross-linking, the DNA was purified and used as a template for PCR amplification with primers that encompass the region from −292 to +6 containing the E box (Fig. 5B). A specific DNA fragment corresponding to this promoter region was detected by PCR (Fig. 5C), cloned, and sequenced. These data show that USF1 bound to the endogenous APOA5 promoter in HepG2 cells in vivo.
FIG. 5.
ChIP analysis of USF interaction with APOA5 promoter in vivo. (A) Western blot analysis of immunoprecipitated USF in HepG2 cells. As a negative control, chromatin immunoprecipitation was performed without antibodies (USF1−). (B) Schematic representation showing the USF binding site (E box). Two arrows indicate primers used for amplifying the region from −292 to +6 spanning the USF binding site. (C) Formaldehyde cross-linked chromatin isolated from HepG2 cells was immunoprecipitated with antibodies and subjected to PCR as described in Materials and Methods. PCR products were electrophoresed on 2% agarose gel.
The effect of USF1 on APOA5 transcription.
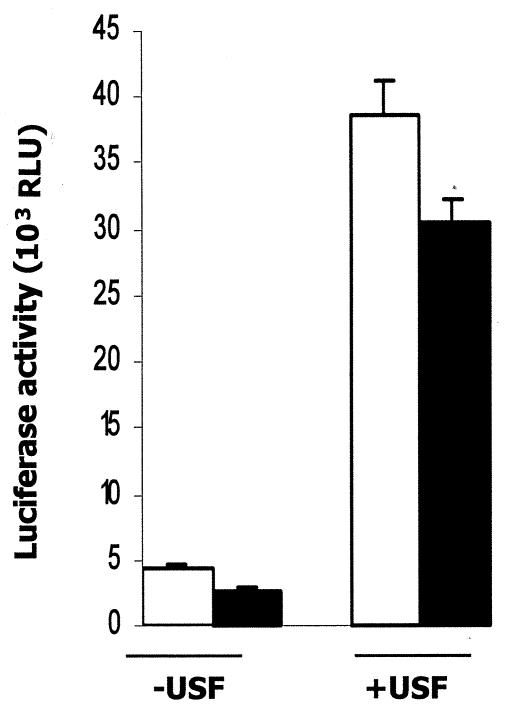
To determine whether the binding of USF1 to APOA5 promoter is functional, we analyzed the promoter activity in transiently cotransfected cells with the −304/+63 fragment of the human APOA5 promoter and USF1 (Fig. 6). We observed that USF1 clearly increased the promoter activity by 8.5-fold, and this effect was reduced when insulin was added. Experiments were controlled by the decrease of the promoter activity due to the treatment of transfected cells with insulin without cotransfected USF1.
FIG. 6.
E-box requirement for insulin regulation of the APOA5 promoter. HepG2 cells were cotransfected with the −304/+63 human APOA5 promoter fragment reporter plasmid and the USF1 expression plasmid. After 24 h of treatment with 10 nM insulin, cells were lysed, and the luciferase activity was measured and expressed as described in Materials and Methods. Results were expressed in luciferase activity (means ± SD; n = 3). Experiments were repeated at least three times, and a representative result is shown. Black bars, insulin; white bars, control; RLU, relative light units.
The effect of insulin on APOA5 gene expression is mediated by the PI3K phosphorylation pathway.
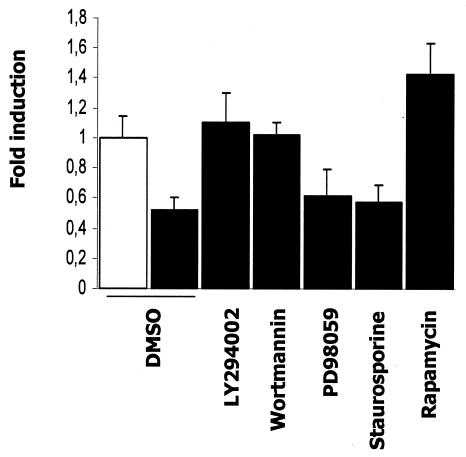
Since insulin is a potent activator of several phosphorylation cascades, PI3K is a well-documented insulin-stimulated kinase that mediates the gene regulation by insulin. We first used LY294002 and wortmannin, two inhibitors structurally distinct and specific to the PI3K pathway (Fig. 7). Both PI3K inhibitors blocked insulin responsiveness and prevented a decrease in APOA5 mRNA levels. These results suggested that the PI3K pathway is involved in the insulin-mediated down-regulation of APOA5 gene expression. Next, to further elucidate the signaling pathway involved, two other phosphorylation cascade inhibitors were used, PD98059 to inhibit MAP kinase and staurosporine to block the protein kinase C (PKC) pathway. In these two experiments, the negative effect of insulin remains unchanged, indicating that the down-regulation of APOA5 gene expression by insulin is independent of both the MAP kinase and PKC phosphorylation pathways. Last, we tested rapamycin, an inhibitor of the P70 S6 kinase involved in insulin responsiveness. Rapamycin, an immunosuppressant that binds and inhibits the function of mammalian target of rapamycin (mTOR), showed a 1.4-fold increase in APOA5 mRNA levels. Thus, APOA5 insulin responsiveness seemed to be dependent on the mTOR/P70 S6 kinase pathway. Taken together, these results implicate PI3K and P70 S6 kinase, but not MAP kinase or PKC, in the insulin-mediated down-regulation of APOA5 gene expression.
FIG. 7.
Effects of phosphorylation inhibitors on the APOA5 gene expression down-regulation by insulin. Before the addition of insulin, inhibitors were added to treat HuH7 cells for 1 h. The concentrations used were as follow: LY294002, 10 μM; wortmannin, 10 nM; PD98059, 10 μM; staurosporine, 5 nM; and rapamycin, 10 nM. The same volume of vehicle (DMSO) was used as the negative control (white bar). Cells were incubated with 10 nM insulin (black bars) for 24 h. Total RNA was isolated from the cells and subjected to a quantitative PCR using 36B4 as normalizing gene. Induction (n-fold) of APOA5 gene expression is shown (means ± SD; n = 3). Experiments were repeated three times, and a representative result is shown.
The nonphosphorylated form of USF1 binds to APOA5 E box.
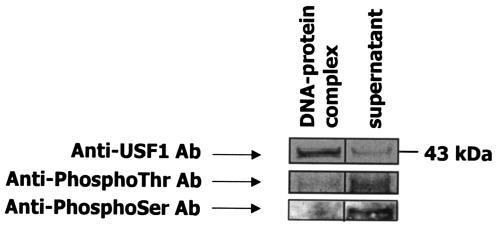
To investigate the phosphorylation state of USFs that bound to the APOA5 promoter, nuclear extracts were isolated from HepG2 cells and incubated with the oligonucleotide probe containing the APOA5 E box. After incubation with streptavidin-Sepharose beads, the oligonucleotide-protein complex and the supernatant were analyzed by Western blotting with anti-USF1 and antiphosphothreonine or antiphosphoserine antibodies (Fig. 8). These results demonstrated that a large amount of USF1 from nuclear extracts, a 43-kDa protein, bound the APOA5 E box, and a small amount of USF1 that did not bind to APOA5 E box was detected in the supernatant. Analyses with antiphosphothreonine or antiphosphoserine did not detect the USF1, which bound to the APOA5 E box, but did detect an approximate 43-kDa phosphoprotein in the supernatant. Our data indicated clearly that in hepatic cells, a large quantity of USF1 was not phosphorylated, and these findings revealed that in our experiment the nonphosphorylated form of USF1 binds to APOA5 E-box.
FIG. 8.
Oligonucleotide precipitation of USF1 from hepatic nuclear extracts. The experiment was performed by using 10 μg of nuclear extracts from HepG2 cells. First, a 5′ -biotin-labeled oligonucleotide probe containing the APOA5 E box was used for the formation of the oligonucleotide-protein complex. Then, streptavidin-Sepharose beads were added to interact with the biotinylated DNA-protein complex. Immunoblot analyses were done with anti-USF1, antiphosphothreonine, or antiphosphoserine as the primary antibody. Experiments were repeated at least three times, and a representative result is shown. Ab, antibody.
The ApoAV protein level is reduced in experimentally induced hyperinsulinemia in men.
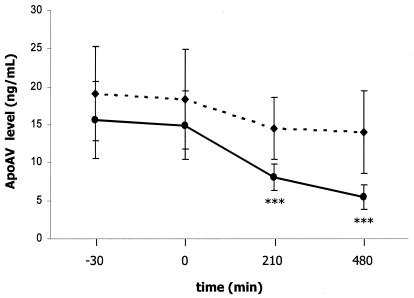
An insulin clamp study in humans was carried out to analyze the effect of insulin on human ApoAV levels in vivo (Fig. 9). For this study, 12 healthy men were recruited, and insulin was infused in a continuous manner at a rate of 1 mU/kg/min over 8 h. Glycemia was maintained at normal levels by adjusting the rate with a 20% glucose infusion. This experimentally induced hyperinsulinemia significantly reduced serum ApoAV protein levels at 3.5 and 8 h by 52 and 72%, respectively, versus levels in the control. However, no change in triglyceride levels was observed within this short time (data not shown). Moreover, ApoCIII, which is a target gene of insulin, was not affected in this study (data not shown).
FIG. 9.
Effects of insulin on the plasma ApoAV protein level in humans. Plasma ApoAV protein level was measured in humans after infusion of insulin (solid line) or saline (dashed line). Insulin was infused at a rate of 1 mU/kg/min for 8 h. Blood samplings from each subject were collected at different times. The first sample was collected 30 min before the beginning of insulin or saline infusion; the second sample was collected just after the start of infusion. The third and the fourth samples were collected 3.5 and 8 h, respectively, after the infusion. Results are expressed as means ± SD (n = 12). Statistically significant differences between groups versus the control were obtained with a Student's t test and are indicated by asterisks (*, 0.01 < P < 0.05; **, 0.0001 < P < 0.01; and ***, P < 0.0001).
DISCUSSION
Interest in this topic stems from the clinical observations showing that hyperinsulinemia and insulin resistance are associated with a hypertriglyceridemic state and the fact that APOA5 is negatively correlated with triglyceride levels. We examined the regulation of APOA5 gene expression by insulin and found a significant decrease.
For in vitro studies, HepG2 and HuH7 cells were chosen because they both express the APOA5 gene as well as the insulin receptor. In both hepatic cell lines, we found a significant time-dependent decrease in endogenous mRNA levels after cell treatment with 10 nM insulin. Experiments investigated in primary rat hepatocytes showed that this down-regulation observed after a 24-h treatment was dose dependent. So, the insulin-mediated down-regulation of APOA5 gene expression was shown in vitro in human and rat hepatocytes and was confirmed in vivo in insulin-injected mice. Insulin has previously been shown to regulate the expression of several genes including APOA1, APOC3, and APOA4. We confirmed here that rat apoc3 gene expression is decreased by nearly fourfold in our experiments (data not shown). It is well established that the plasmatic concentration of ApoCIII is positively correlated with levels of plasma triglycerides (33, 49). Nevertheless, its decrease by insulin could not explain the cause of hypertriglyceridemia associated with hyperinsulinemia.
We demonstrated that the insulin-mediated down-regulation of APOA5 occurs at the transcriptional level. The promoter activity in transfected HepG2 cells with human APOA5 was decreased in a dose-dependent manner, and deletion analyses of the promoter allowed the identification of an 85-bp DNA fragment likely to contain an element responsive to insulin.
Insulin regulates many genes at the transcriptional level, but the molecular mechanism responsible for this regulation is hampered by the fact that there is no consensus insulin response element that accounts for the regulation of all insulin-responsive genes (23). The analysis of the 85-bp candidate IRS fragment allowed the selection of a 30-bp fragment containing a putative E box located at −76/−81, similar to the consensus motif, which could potentially explain the APOA5 responsiveness to insulin. Moreover, it was clearly demonstrated that when the E box located at −76/−81 is deleted or mutated, the promoter activity of human APOA5 is dramatically abolished. This 30-bp fragment was used in an EMSA of nuclear extracts from HepG2 cells. Results obtained by EMSA clearly showed the binding of a transcription factor to the APOA5 E box and demonstrated that treatment of cells under hyperinsulinemic conditions prevented the binding of nucleoproteins to the promoter. The transcriptional regulation of lipogenic genes, such as FAS, by insulin is well studied; however, variance of the data from different groups suggests either USF (7, 54, 62, 63) or SREBP-1 (28) as being the key activator acting through the FAS E box. Recent work reported by Jakel et al. (26) has established the role of SREBP-1c in the down-regulation of APOA5 gene expression by a liver X receptor ligand. Authors showed the presence of two E-box elements located at +10/+15 and at −76/−81 that are implicated in SREBP-1c-mediated down-regulation of APOA5; nevertheless, SREBP-1c was demonstrated to preferably bind the +10/+15 E box. In our study, utilization of specific antibodies against USF1 and USF2 completely disrupted the band obtained in EMSA experiments, and no supershift was observed with anti-SREBP-1 antibody. Thus, these results clearly demonstrated the specificity of USF binding to the APOA5 E box located at −76/−81. Consequently, APOA5 regulation by insulin is mediated through the binding status of USF to the E box located at −76/−81. Since we have demonstrated a binding of USF1 to the APOA5 E box in vitro, we investigated the binding of USF to the APOA5 promoter in vivo. We performed a ChIP assay to cross-link the DNA-protein complexes in vivo, and we showed that USF1 bound to the endogenous APOA5 promoter in HepG2 cells. Cotransfection assays showed that USF1 significantly increased APOA5 promoter activity, and this increase is affected when insulin is added. Thus, the functionality of the APOA5 E box located at −76/−81 was clearly demonstrated. Indeed, when the APOA5 E box is deleted or mutated, it lost its ability of binding to USF, and the effect of insulin was completely abolished.
Since the novo protein synthesis was not involved and the binding of USFs in vitro was disrupted after insulin treatment, it was reasonable to hypothesize a modification of USF protein through insulin action that could affect the binding to the APOA5 E box. Many metabolic actions of insulin are mediated through pathways, which include the activation of PI3K and, consequently, the activation of its downstream target, PKB/Akt (5, 17, 30-32). In this report, we provide evidence that the mechanism of regulation by insulin is mediated by the PI3K signaling pathway and seems to be independent of the MAP kinase or the PKC signaling pathways. Indeed, inhibitors of PI3K (LY294002 and wortmannin) abolished the insulin down-regulation of endogenous APOA5 mRNA. The P70 S6 kinase is activated by the phosphorylation cascade involving the sequential activation of PI3K, PDK1/2, PKB/Akt, and mTOR kinase. Phosphorylation of the ribosomal protein S6 by the P70 S6 kinase stimulates the translation initiation of mRNAs and entry into the cell cycle. Thus, rapamycin, an inhibitor of the FRAP/mTOR kinase, inhibits the ribosomal P70 S6 kinase. Here, our data showed an increase in APOA5 gene expression when cells were treated with rapamycin. This up-regulation may be explained by another important function of this inhibitor. Indeed, FRAP/mTOR is known to phosphorylate the P70 S6 kinase via the phosphorylation-dependent inactivation of the protein phosphatase 2A. Rapamycin treatment results in a rapid dephosphorylation and inactivation of the P70 S6 kinase through the inactivation of the FRAP/mTOR kinase and activation of protein phosphatase 2A by its dephosphorylation (24, 43).
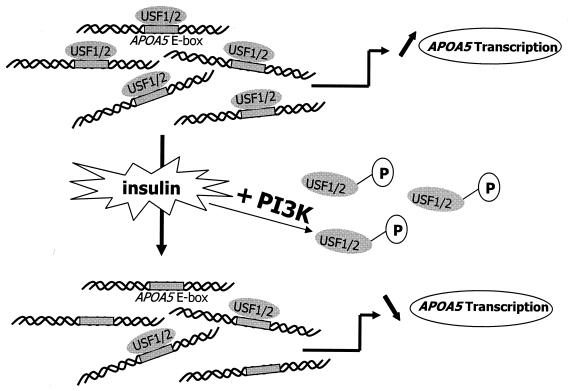
Taken together, our results demonstrated that, through the PI3K and P70 S6 kinase pathways, a phosphorylation and dephosphorylation mechanism could modulate the ability of USFs to bind APOA5 promoter and, consequently, their transactivation function. The oligonucleotide precipitation of USF1 from HepG2 nuclear extracts followed by immunoblot analyses showed that USF1, which binds APOA5 E box, is not phosphorylated and exists in a large amount in hepatic cells. However, only a small amount of USF1 was not phosphorylated and failed to bind to the APOA5 E box. By contrast, it has been demonstrated that the phosphorylated form of USF1 bound DNA preferentially to transactivate certain genes (10, 20). Nevertheless, no conclusive report on the regulation of USF by a phosphorylation and dephosphorylation mechanism has been reported before. Our data suggest a potential mechanism whereby insulin stimulates the PI3K pathway inducing the phosphorylation and binding exclusion to APOA5 promoter of the transcriptional activator USF, thereby resulting in the down-regulation of APOA5 gene expression (Fig. 10). The phosphorylation site prediction for the HLH DNA binding domain of USF1 shows potential phosphorylation on threonines and/or serines. The potential phosphorylation of these sites induced by insulin-stimulated kinase could probably alter the binding of USF1 to DNA.
FIG. 10.
A proposed model for the roles of USF1 and USF2 in the regulation of APOA5 gene transcription. Under insulin, the PI3K pathway is stimulated, inducing a phosphorylation of USF. The phosphorylated complexes lose their ability to bind APOA5 promoter and, consequently, their transactivation function.
Last, we assessed the effect of the insulin in healthy men by using an euglycemic hyperinsulinemic clamp study. The data showed a decrease in plasma ApoAV protein levels in a short time following treatment. The inhibitory effect of insulin on ApoAV seems to present a paradox in connection to what has been previously reported on hyperinsulinemia and insulin resistance, where there is a lack of insulin action and an increase in hypertriglyceridemia. Recently, ApoAV was demonstrated to enhance the catabolism of triglyceride-rich particles (18, 48). In our study, the triglyceride as well as ApoCIII levels were not affected within a short time, but the early decrease in ApoAV levels could initiate a delay in the catabolism of triglyceride-rich particles, resulting in their accumulation in the plasma and the consequent hypertriglyceridemia.
In summary, our in vitro and in vivo studies demonstrated that insulin decreases APOA5 gene expression in humans and rodents. This down-regulation occurs at the transcriptional level and is mediated by the PI3K and P70 S6 kinase signaling pathways. Binding and transfection studies allowed us to underscore the importance of USFs as transcriptional factors required for the regulation of the APOA5 gene through a phosphorylation-dephosphorylation mechanism. Moreover, we have shown that insulin decreases ApoAV protein levels in humans after insulin administration.
These results suggest that the insulin-mediated down-regulation of the APOA5 gene could potentially contribute to the development of the hypertriglyceridemia associated with hyperinsulinemia.
Acknowledgments
This work was supported by the Fondation Leducq and in part by the NIH-NHLBI Programs for Genomic Application grant HL66681 (E.M.R.) and NIH grant HL071954A (E.M.R. and L.A.P.) through the U.S. Department of Energy under contract number DE-AC03-76SF00098.
The technical assistance of Emmanuelle Moitrot, Corinne Rommens, and Eric Baugé was greatly appreciated. We thank Patrick Duriez for critical reading.
REFERENCES
- 1.Aouizerat, B. E., M. Kulkarni, D. Heilbron, D. Drown, S. Raskin, C. R. Pullinger, M. J. Malloy, and J. P. Kane. 2003. Genetic analysis of a polymorphism in the human apolipoprotein A-V gene: effect on plasma lipids. J. Lipid Res. 44:1167-1173. [DOI] [PubMed] [Google Scholar]
- 2.Baroukh, N., E. Bauge, J. Akiyama, J. Chang, V. Afzal, J. C. Fruchart, E. M. Rubin, J. Fruchart, and L. A. Pennacchio. 2004. Analysis of apolipoprotein A5, C3, and plasma triglyceride concentrations in genetically engineered mice. Arterioscler. Thromb. Vasc. Biol. 24:1297-1302. [DOI] [PubMed] [Google Scholar]
- 3.Baum, L., B. Tomlinson, and G. Thomas. 2003. APOA5-1131T>C polymorphism is associated with triglyceride levels in Chinese men. Clin. Genet. 63:377-379. [DOI] [PubMed] [Google Scholar]
- 4.Brown, M. S., and J. L. Goldstein. 1997. The SREBP pathway: regulation of cholesterol metabolism by proteolysis of a membrane-bound transcription factor. Cell 89:331-340. [DOI] [PubMed] [Google Scholar]
- 5.Burgering, B. M., and P. J. Coffer. 1995. Protein kinase B (c-Akt) in phosphatidylinositol-3-OH kinase signal transduction. Nature 376:599-602. [DOI] [PubMed] [Google Scholar]
- 6.Carthew, R. W., L. A. Chodosh, and P. A. Sharp. 1985. An RNA polymerase II transcription factor binds to an upstream element in the adenovirus major late promoter. Cell 43:439-448. [DOI] [PubMed] [Google Scholar]
- 7.Casado, M., V. S. Vallet, A. Kahn, and S. Vaulont. 1999. Essential role in vivo of upstream stimulatory factors for a normal dietary response of the fatty acid synthase gene in the liver. J. Biol. Chem. 274:2009-2013. [DOI] [PubMed] [Google Scholar]
- 8.Cheatham, B., and C. R. Kahn. 1995. Insulin action and the insulin signaling network. Endocr. Rev. 16:117-142. [DOI] [PubMed] [Google Scholar]
- 9.Chen, M., J. L. Breslow, W. Li, and T. Leff. 1994. Transcriptional regulation of the apoC-III gene by insulin in diabetic mice: correlation with changes in plasma triglyceride levels. J. Lipid Res. 35:1918-1924. [PubMed] [Google Scholar]
- 10.Cheung, E., P. Mayr, F. Coda-Zabetta, P. G. Woodman, and D. S. Boam. 1999. DNA-binding activity of the transcription factor upstream stimulatory factor 1 (USF-1) is regulated by cyclin-dependent phosphorylation. Biochem. J. 344:145-152. [PMC free article] [PubMed] [Google Scholar]
- 11.Chung, J., T. C. Grammer, K. P. Lemon, A. Kazlauskas, and J. Blenis. 1994. PDGF- and insulin-dependent pp70S6k activation mediated by phosphatidylinositol-3-OH kinase. Nature 370:71-75. [DOI] [PubMed] [Google Scholar]
- 12.Cullen, P. 2000. Evidence that triglycerides are an independent coronary heart disease risk factor. Am. J. Cardiol. 86:943-949. [DOI] [PubMed] [Google Scholar]
- 13.DeFronzo, R. A., J. D. Tobin, and R. Andres. 1979. Glucose clamp technique: a method for quantifying insulin secretion and resistance. Am. J. Physiol. 237:E214-E223. [DOI] [PubMed] [Google Scholar]
- 14.Duverger, N., G. Tremp, J. M. Caillaud, F. Emmanuel, G. Castro, J. C. Fruchart, A. Steinmetz, and P. Denefle. 1996. Protection against atherogenesis in mice mediated by human apolipoprotein A-IV. Science 273:966-968. [DOI] [PubMed] [Google Scholar]
- 15.Endo, K., H. Yanagi, J. Araki, C. Hirano, K. Yamakawa-Kobayashi, and S. Tomura. 2002. Association found between the promoter region polymorphism in the apolipoprotein A-V gene and the serum triglyceride level in Japanese schoolchildren. Hum. Genet. 111:570-572. [DOI] [PubMed] [Google Scholar]
- 16.Evert, M., R. Schneider-Stock, and F. Dombrowski. 2003. Apolipoprotein A-IV mRNA overexpression in early preneoplastic hepatic foci induced by low-number pancreatic islet transplants in streptozotocin-diabetic rats. Pathol. Res. Pract. 199:373-379. [DOI] [PubMed] [Google Scholar]
- 17.Franke, T. F., S. I. Yang, T. O. Chan, K. Datta, A. Kazlauskas, D. K. Morrison, D. R. Kaplan, and P. N. Tsichlis. 1995. The protein kinase encoded by the Akt proto-oncogene is a target of the PDGF-activated phosphatidylinositol 3-kinase. Cell 81:727-736. [DOI] [PubMed] [Google Scholar]
- 18.Fruchart-Najib, J., E. Bauge, L. S. Niculescu, T. Pham, B. Thomas, C. Rommens, Z. Majd, B. Brewer, L. A. Pennacchio, and J. C. Fruchart. 2004. Mechanism of triglyceride lowering in mice expressing human apolipoprotein A5. Biochem. Biophys. Res. Commun. 319:397-404. [DOI] [PubMed] [Google Scholar]
- 19.Gabbay, R. A., C. Sutherland, L. Gnudi, B. B. Kahn, R. M. O'Brien, D. K. Granner, and J. S. Flier. 1996. Insulin regulation of phosphoenolpyruvate carboxykinase gene expression does not require activation of the Ras/mitogen-activated protein kinase signaling pathway. J. Biol. Chem. 271:1890-1897. [DOI] [PubMed] [Google Scholar]
- 20.Galibert, M. D., L. Boucontet, C. R. Goding, and T. Meo. 1997. Recognition of the E-C4 element from the C4 complement gene promoter by the upstream stimulatory factor-1 transcription factor. J. Immunol. 159:6176-6183. [PubMed] [Google Scholar]
- 21.Grundy, S. M. 1998. Hypertriglyceridemia, atherogenic dyslipidemia, and the metabolic syndrome. Am. J. Cardiol. 81:18B-25B. [DOI] [PubMed] [Google Scholar]
- 22.Haim, M., M. Benderly, D. Brunner, S. Behar, E. Graff, H. Reicher-Reiss, and U. Goldbourt. 1999. Elevated serum triglyceride levels and long-term mortality in patients with coronary heart disease: the Bezafibrate Infarction Prevention (BIP) Registry. Circulation 100:475-482. [DOI] [PubMed] [Google Scholar]
- 23.Hall, R. K., T. Yamasaki, T. Kucera, M. Waltner-Law, R. O'Brien, and D. K. Granner. 2000. Regulation of phosphoenolpyruvate carboxykinase and insulin-like growth factor-binding protein-1 gene expression by insulin. The role of winged helix/forkhead proteins. J. Biol. Chem. 275:30169-30175. [DOI] [PubMed] [Google Scholar]
- 24.Hartley, D., and G. M. Cooper. 2002. Role of mTOR in the degradation of IRS-1: regulation of PP2A activity. J. Cell Biochem. 85:304-314. [DOI] [PubMed] [Google Scholar]
- 25.Ito, Y., N. Azrolan, A. O'Connell, A. Walsh, and J. L. Breslow. 1990. Hypertriglyceridemia as a result of human apo CIII gene expression in transgenic mice. Science 249:790-793. [DOI] [PubMed] [Google Scholar]
- 26.Jakel, H., M. Nowak, E. Moitrot, H. Dehondt, D. Hum, L. A. Penacchio, J. Fruchart-Najib, and J. C. Fruchart. 2004. The LXR ligand T0901317 down-regulates APOA5 gene expression through activation of SREBP-1c. J. Biol. Chem. 279:45462-45469. [DOI] [PubMed] [Google Scholar]
- 27.Kahn, B. B. 1998. Type 2 diabetes: when insulin secretion fails to compensate for insulin resistance. Cell 92:593-596. [DOI] [PubMed] [Google Scholar]
- 28.Kim, J. B., P. Sarraf, M. Wright, K. M. Yao, E. Mueller, G. Solanes, B. B. Lowell, and B. M. Spiegelman. 1998. Nutritional and insulin regulation of fatty acid synthetase and leptin gene expression through ADD1/SREBP1. J. Clin. Investig. 101:1-9. [DOI] [PMC free article] [PubMed] [Google Scholar]
- 29.Kim, J. B., G. D. Spotts, Y. D. Halvorsen, H. M. Shih, T. Ellenberger, H. C. Towle, and B. M. Spiegelman. 1995. Dual DNA binding specificity of ADD1/SREBP1 controlled by a single amino acid in the basic helix-loop-helix domain. Mol. Cell. Biol. 15:2582-2588. [DOI] [PMC free article] [PubMed] [Google Scholar]
- 30.Klippel, A., W. M. Kavanaugh, D. Pot, and L. T. Williams. 1997. A specific product of phosphatidylinositol 3-kinase directly activates the protein kinase Akt through its pleckstrin homology domain. Mol. Cell. Biol. 17:338-344. [DOI] [PMC free article] [PubMed] [Google Scholar]
- 31.Klippel, A., C. Reinhard, W. M. Kavanaugh, G. Apell, M. A. Escobedo, and L. T. Williams. 1996. Membrane localization of phosphatidylinositol 3-kinase is sufficient to activate multiple signal-transducing kinase pathways. Mol. Cell. Biol. 16:4117-4127. [DOI] [PMC free article] [PubMed] [Google Scholar]
- 32.Kohn, A. D., F. Takeuchi, and R. A. Roth. 1996. Akt, a pleckstrin homology domain containing kinase, is activated primarily by phosphorylation. J. Biol. Chem. 271:21920-21926. [DOI] [PubMed] [Google Scholar]
- 33.Le, N. A., J. C. Gibson, and H. N. Ginsberg. 1988. Independent regulation of plasma apolipoprotein C-II and C-III concentrations in very low density and high density lipoproteins: implications for the regulation of the catabolism of these lipoproteins. J. Lipid Res. 29:669-677. [PubMed] [Google Scholar]
- 34.Lehto, S., T. Ronnemaa, K. Pyorala, and M. Laakso. 2000. Cardiovascular risk factors clustering with endogenous hyperinsulinaemia predict death from coronary heart disease in patients with type II diabetes. Diabetologia 43:148-155. [DOI] [PubMed] [Google Scholar]
- 35.Lemieux, I., N. Almeras, P. Mauriege, C. Blanchet, E. Dewailly, J. Bergeron, and J. P. Despres. 2002. Prevalence of “hypertriglyceridemic waist” in men who participated in the Quebec Health Survey: association with atherogenic and diabetogenic metabolic risk factors. Can. J. Cardiol. 18:725-732. [PubMed] [Google Scholar]
- 36.Martin, S., V. Nicaud, S. E. Humphries, and P. J. Talmud. 2003. Contribution of APOA5 gene variants to plasma triglyceride determination and to the response to both fat and glucose tolerance challenges. Biochim. Biophys. Acta 1637:217-225. [DOI] [PubMed] [Google Scholar]
- 37.Masana, L., J. Ribalta, J. Salazar, J. Fernandez-Ballart, J. Joven, and M. C. Cabezas. 2003. The apolipoprotein AV gene and diurnal triglyceridaemia in normolipidaemic subjects. Clin. Chem. Lab. Med. 41:517-521. [DOI] [PubMed] [Google Scholar]
- 38.Miyamoto, N. G., V. Moncollin, J. M. Egly, and P. Chambon. 1985. Specific interaction between a transcription factor and the upstream element of the adenovirus-2 major late promoter. EMBO J. 4:3563-3570. [DOI] [PMC free article] [PubMed] [Google Scholar]
- 39.Murao, K., Y. Wada, T. Nakamura, A. H. Taylor, A. D. Mooradian, and N. C. Wong. 1998. Effects of glucose and insulin on rat apolipoprotein A-I gene expression. J. Biol. Chem. 273:18959-18965. [DOI] [PubMed] [Google Scholar]
- 40.Myers, M. G., Jr., and M. F. White. 1996. Insulin signal transduction and the IRS proteins. Annu. Rev. Pharmacol. Toxicol. 36:615-658. [DOI] [PubMed] [Google Scholar]
- 41.O'Brien, R. M., and D. K. Granner. 1996. Regulation of gene expression by insulin. Physiol. Rev. 76:1109-1161. [DOI] [PubMed] [Google Scholar]
- 42.Pennacchio, L. A., M. Olivier, J. A. Hubacek, J. C. Cohen, D. R. Cox, J. C. Fruchart, R. M. Krauss, and E. M. Rubin. 2001. An apolipoprotein influencing triglycerides in humans and mice revealed by comparative sequencing. Science 294:169-173. [DOI] [PubMed] [Google Scholar]
- 43.Peterson, R. T., B. N. Desai, J. S. Hardwick, and S. L. Schreiber. 1999. Protein phosphatase 2A interacts with the 70-kDa S6 kinase and is activated by inhibition of FKBP12-rapamycin-associated protein. Proc. Natl. Acad. Sci. USA 96:4438-4442. [DOI] [PMC free article] [PubMed] [Google Scholar]
- 44.Prieur, X., H. Coste, and J. C. Rodriguez. 2003. The human apolipoprotein AV gene is regulated by PPAR alpha and contains a novel FXR response element. J. Biol. Chem. [DOI] [PubMed]
- 45.Ribalta, J., L. Figuera, J. Fernandez-Ballart, E. Vilella, M. Castro Cabezas, L. Masana, and J. Joven. 2002. Newly identified apolipoprotein AV gene predisposes to high plasma triglycerides in familial combined hyperlipidemia. Clin. Chem. 48:1597-1600. [PubMed] [Google Scholar]
- 46.Sawadogo, M., and R. G. Roeder. 1985. Interaction of a gene-specific transcription factor with the adenovirus major late promoter upstream of the TATA box region. Cell 43:165-175. [DOI] [PubMed] [Google Scholar]
- 47.Sawadogo, M., M. W. Van Dyke, P. D. Gregor, and R. G. Roeder. 1988. Multiple forms of the human gene-specific transcription factor USF. I. Complete purification and identification of USF from HeLa cell nuclei. J. Biol. Chem. 263:11985-11993. [PubMed] [Google Scholar]
- 48.Schaap, F. G., P. C. Rensen, P. J. Voshol, C. Vrins, H. N. Van Der Vliet, R. A. Chamuleau, L. M. Havekes, A. K. Groen, and K. Willems Van Dijk. 2004. ApoAV reduces plasma triglycerides by inhibiting very low density lipoprotein-triglyceride (VLDL-TG) production and stimulating lipoprotein lipase-mediated VLDL-TG hydrolysis. J. Biol. Chem. [DOI] [PubMed]
- 49.Schonfeld, G., P. K. George, J. Miller, P. Reilly, and J. Witztum. 1979. Apolipoprotein C-II and C-III levels in hyperlipoproteinemia. Metabolism 28:1001-1010. [DOI] [PubMed] [Google Scholar]
- 50.Schultz, J. R., J. G. Verstuyft, E. L. Gong, A. V. Nichols, and E. M. Rubin. 1993. Protein composition determines the anti-atherogenic properties of HDL in transgenic mice. Nature 365:762-764. [DOI] [PubMed] [Google Scholar]
- 51.Seda, O., and Sedovacute. 2003. New apolipoprotein A-V: comparative genomics meets metabolism. Physiol. Res. 52:141-146. [PubMed] [Google Scholar]
- 52.Sirito, M., S. Walker, Q. Lin, M. T. Kozlowski, W. H. Klein, and M. Sawadogo. 1992. Members of the USF family of helix-loop-helix proteins bind DNA as homo- as well as heterodimers. Gene Expr. 2:231-240. [PMC free article] [PubMed] [Google Scholar]
- 53.Stein, O., Y. Stein, M. Lefevre, and P. S. Roheim. 1986. The role of apolipoprotein A-IV in reverse cholesterol transport studied with cultured cells and liposomes derived from an ether analog of phosphatidylcholine. Biochim. Biophys. Acta 878:7-13. [DOI] [PubMed] [Google Scholar]
- 54.Sul, H. S., M. J. Latasa, Y. Moon, and K. H. Kim. 2000. Regulation of the fatty acid synthase promoter by insulin. J. Nutr. 130:315S-320S. [DOI] [PubMed] [Google Scholar]
- 55.Sutherland, C., R. M. O'Brien, and D. K. Granner. 1995. Phosphatidylinositol 3-kinase, but not p70/p85 ribosomal S6 protein kinase, is required for the regulation of phosphoenolpyruvate carboxykinase (PEPCK) gene expression by insulin. Dissociation of signaling pathways for insulin and phorbol ester regulation of PEPCK gene expression. J. Biol. Chem. 270:15501-15506. [DOI] [PubMed] [Google Scholar]
- 56.Sutherland, C., M. Waltner-Law, L. Gnudi, B. B. Kahn, and D. K. Granner. 1998. Activation of the Ras mitogen-activated protein kinase-ribosomal protein kinase pathway is not required for the repression of phosphoenolpyruvate carboxykinase gene transcription by insulin. J. Biol. Chem. 273:3198-3204. [DOI] [PubMed] [Google Scholar]
- 57.Talmud, P. J., E. Hawe, S. Martin, M. Olivier, G. J. Miller, E. M. Rubin, L. A. Pennacchio, and S. E. Humphries. 2002. Relative contribution of variation within the APOC3/A4/A5 gene cluster in determining plasma triglycerides. Hum. Mol. Genet. 11:3039-3046. [DOI] [PubMed] [Google Scholar]
- 58.Torra, I. P., V. Tsibulsky, F. Delaunay, R. Saladin, V. Laudet, J. C. Fruchart, V. Kosykh, and B. Staels. 2000. Circadian and glucocorticoid regulation of Rev-erbα expression in liver. Endocrinology 141:3799-3806. [DOI] [PubMed] [Google Scholar]
- 59.van der Vliet, H. N., M. G. Sammels, A. C. Leegwater, J. H. Levels, P. H. Reitsma, W. Boers, and R. A. Chamuleau. 2001. Apolipoprotein A-V: a novel apolipoprotein associated with an early phase of liver regeneration. J. Biol. Chem. 276:44512-44520. [DOI] [PubMed] [Google Scholar]
- 60.van der Vliet, H. N., F. G. Schaap, J. H. Levels, R. Ottenhoff, N. Looije, J. G. Wesseling, A. K. Groen, and R. A. Chamuleau. 2002. Adenoviral overexpression of apolipoprotein A-V reduces serum levels of triglycerides and cholesterol in mice. Biochem. Biophys. Res. Commun. 295:1156-1159. [DOI] [PubMed] [Google Scholar]
- 61.Vu-Dac, N., P. Gervois, H. Jakel, M. Nowak, E. Bauge, H. Dehondt, B. Staels, L. A. Pennacchio, E. M. Rubin, J. Fruchart-Najib, and J. C. Fruchart. 2003. Apolipoprotein A5, a crucial determinant of plasma triglyceride levels, is highly responsive to peroxisome proliferator-activated receptor α activators. J. Biol. Chem. 278:17982-17985. [DOI] [PubMed] [Google Scholar]
- 62.Wang, D., and H. S. Sul. 1998. Insulin stimulation of the fatty acid synthase promoter is mediated by the phosphatidylinositol 3-kinase pathway. Involvement of protein kinase B/Akt. J. Biol. Chem. 273:25420-25426. [DOI] [PubMed] [Google Scholar]
- 63.Wang, D., and H. S. Sul. 1997. Upstream stimulatory factor binding to the E-box at −65 is required for insulin regulation of the fatty acid synthase promoter. J. Biol. Chem. 272:26367-26374. [DOI] [PubMed] [Google Scholar]
- 64.Willems Van Dijk, K., P. C. Rensen, P. J. Voshol, and L. M. Havekes. 2004. The role and mode of action of apolipoproteins CIII and AV: synergistic actors in triglyceride metabolism? Curr. Opin. Lipidol. 15:239-246. [DOI] [PubMed] [Google Scholar]


