Abstract
Translation of fluorescence imaging using molecularly targeted imaging agents for real-time assessment of surgical margins in the operating room requires a fast and reliable method to predict tumor depth from planar optical imaging. Here, we developed a dual-wavelength fluorescent molecular probe with distinct visible and near-infrared excitation and emission spectra for depth estimation in mice and a method to predict the optical properties of the imaging medium such that the technique is applicable to a range of medium types. Imaging was conducted at two wavelengths in a simulated blood vessel and an in vivo tumor model. Although the depth estimation method was insensitive to changes in the molecular probe concentration, it was responsive to the optical parameters of the medium. Results of the intra-tumor fluorescent probe injection showed that the average measured tumor sub-surface depths were 1.31 ± 0.442 mm, 1.07 ± 0.187 mm, and 1.42 ± 0.182 mm, and the average estimated sub-surface depths were 0.97 ± 0.308 mm, 1.11 ± 0.428 mm, 1.21 ± 0.492 mm, respectively. Intravenous injection of the molecular probe allowed for selective tumor accumulation, with measured tumor sub-surface depths of 1.28 ± 0.168 mm, and 1.50 ± 0.394 mm, and the estimated depths were 1.46 ± 0.314 mm, and 1.60 ± 0.409 mm, respectively. Expansion of our technique by using material optical properties and mouse skin optical parameters to estimate the sub-surface depth of a tumor demonstrated an agreement between measured and estimated depth within 0.38 mm and 0.63 mm for intra-tumor and intravenous dye injections, respectively. Our results demonstrate the feasibility of dual-wavelength imaging for determining the depth of blood vessels and characterizing the sub-surface depth of tumors in vivo.
OCIS codes: (170.0170) Medical optics and biotechnology, (170.3880) Medical and biological imaging
1. Introduction
Using light to evaluate disease is increasingly common for both preclinical and clinical applications [1]. The expansion of the technology is due to advances in imaging methodologies and in fluorescent molecular probes that have diverse emission wavelengths and can bind to specific biological structures [2, 3]. Fluorescence methods allow for real-time imaging without the use of ionizing radiation and show promise in translational applications such as intraoperative imaging [4, 5]. Planar optical imaging is an attractive translational tool due to the versatility of imaging systems and the growing availability of targeted molecular dyes. Currently, planar optical imaging relies on the intensity of the fluorescent signal to determine the extent of the pathology [6]. Many factors can impact the relative intensity of a signal, including tissue optical properties, dye concentration, and depth of the overlying tissue. The ability to assess the extent of a biological structure, such as a tumor or blood vessels, using a fluorescent dye will improve disease detection and surveillance [7].
The challenge in determining the depth of a fluorescent signal from a planar image stems from the ill-posed nature of the inverse problem. If the depth of a fluorescent object is known, we can readily correlate the intensity of the signal with the depth. However, when the depth is unknown, there are insufficient parameters available that can describe the system in order to accurately calculate the depth based on the fluorescent signal. Approaches that have demonstrated depth resolution include analyzing the point-spread function of light [8], temporal based imaging [9], and structured illumination [10–12]. Currently, the mainstay of depth profiling is fluorescence molecular tomography (FMT) [13–17]. FMT uses source-detector pairs and solves the inverse problem based on relative changes in light intensity. FMT has proven to be useful in depth profiling for both preclinical and clinical applications. However, the complexity of solving the numerous equations makes it computationally expensive and less practical for some imaging applications, particularly those that require real-time feedback. Additionally, the spatial resolution of FMT is on the order of millimeters often limiting the technology in applications requiring high spatial resolution.
In an attempt to measure the depth of a fluorescent object beneath a surface, rather than the spatial distribution of the object itself, we investigated wide-field dual-wavelength imaging. Previous studies have demonstrated depth-profiling capability in a turbid medium by imaging at multiple wavelengths [18, 19]. The intensity of the fluorescence light detected varies as a function of depth due to the attenuation of light at that wavelength in a specific medium. Light attenuation is dependent on the optical properties of the medium, μa (absorption coefficient) and μ’s (reduced scattering coefficient). When imaging is conducted in the same medium at two different wavelengths, the attenuation coefficients are constant for each wavelength. The natural log of the ratio of the detected light at two wavelengths varies linearly with depth [20].
Swartling et al. demonstrated the dual-wavelength technique using a point source and detector pair in an imaging phantom [21]. The optical parameters were estimated by taking measurements of the optical spectrum of a fluorescent molecular probe at different depths in tissue and then using a Monte Carlo simulation to apply the parameters for depth estimation. However, point source-detector measurements are time consuming, and the model could produce significant errors at source-detector separations larger than 5 mm. To overcome these impediments, Kolste et al. expanded the technique to planar fluorescence imaging applications using a phantom mimicking brain tissue [18]. Both models relied on the perturbation of the fluorescence spectra of a single fluorophore as a function of tissue depth.
In this study, we explored the translation of the dual wavelength ratiometric technique to in vivo imaging applications. We also developed a method to predict the optical properties of the imaging medium such that the technique is applicable to a range of medium types. Instead of relying on two emission points from the fluorescence spectrum of the same fluorophore, we intentionally designed a dual fluorophore molecular system with two distinct emission profiles. This molecular system allows us to select any two wavelengths of interest without crosstalk for depth estimation in intact tissue. Our results demonstrate the feasibility of dual-wavelength imaging for determining the sub-surface depth of biological structures including blood vessels and tumors.
2. Methods and materials
2.1 Synthesis and spectral characterization of dual fluorescent imaging agents
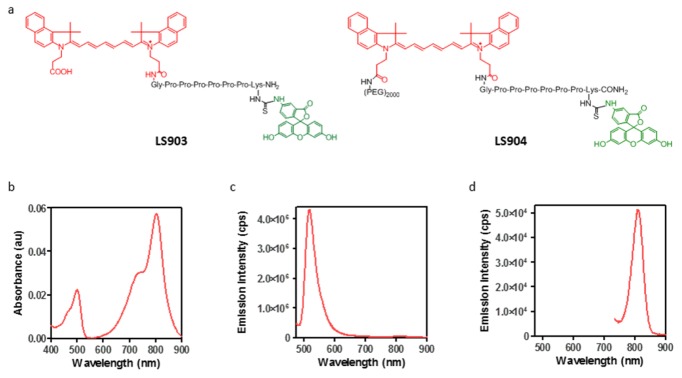
The dual-wavelength fluorescent imaging agent LS903 was synthesized using cypate [22] and fluorescein isothiocyanate (FITC isomer 1, Sigma). Briefly, an octapeptide with 6 proline residues flanked by glycine and lysine residues was synthesized on a solid support using standard Fmoc chemistry. The polyproline linker was used to create distance between the two fluorescent dyes and thus minimize effects due to any spectral overlap [23]. One of the free carboxylic acid groups on the dye cypate was conjugated to the free N-terminal amine on glycine. The product was cleaved from the resin, deprotected, and purified by high performance liquid chromatography (HPLC). Fluorescein isothiocyanate (FITC) was conjugated to the free epsilon amine on lysine. The resulting product (LS903; Fig. 1(a)) was purified by HPLC and characterized by ESI-MS: m/z for [M + H]+: 1781.6 (calculated), 1781 (observed); [M + 2H]2+: 891.3 (calculated), 891 (observed). To increase the water solubility and enhanced circulation in mice, PEG2000 (Laysan Bio, Inc.) was conjugated to the free carboxylic acid group of LS903, and the resulting product (LS904; Fig. 1(a)) was characterized by MALDI-TOF, which showed the expected uniform mass distribution around M = 3763.
Fig. 1.
Properties of dual fluorescent dyes. (a) Molecular structure of LS903 and LS904; (b) absorption spectra of LS903; and emission spectra of LS903 at (c) 460 nm and (d) 720 nm excitation. All spectra were taken in a solution of 1% BSA in PBS, pH 7.4.
For spectral characterization, the compounds were diluted in phosphate buffered saline (PBS, pH 7.4) containing 1% bovine serum albumin (BSA) to simulate the interaction of the molecules with proteins in vivo. Absorption spectra were measured on a DU 640 spectrophotometer (Beckman-Coulter, Brea, CA). Fluorescence emission spectra were recorded on a FluoroLog 3 spectrofluorometer (Horiba Jobin Yvon, Edison, NJ) using 475 nm/490-900 nm and 720 nm/735-900 nm as excitation/emission wavelength with 5 nm slits for FITC and cypate, respectively.
2.2 In vitro imaging
All dyes were formulated in a 1% BSA solution in PBS for use in in vitro imaging, which was conducted by layering various obscuring materials on top of LS903 sample. In our initial study, we used lunchmeat (turkey breast, Budding; 0.65 mm thick) to obscure a 32 μM LS903 sample in an Eppendorf tube. To obtain higher depth resolution we switched to silicone and plastic sheets of 0.254 mm and 0.13 mm thick, respectively (Mc. Master-Carr, Elmhurst, IL). Simulated vessels were created using polyurethane tubing 0.015” ID x 0.033” OD (Braintree Scientific, Braintree, MA), and LS903 was imaged at two different concentrations (25 and 50 μM) for vessel studies. All dual-wavelength imaging was conducted using the Optix MX3 system (ART Advanced Research Technologies, Montreal, CA) with excitation and emission wavelengths at 480/535 nm for the FITC channel, and 785/810 nm for the cypate channel. Normalized fluorescence was used for dual-wavelength image analysis, with the fluorescence signal normalized by the excitation power for each pixel. Image analysis was conducted using custom developed code in MATLAB (The Mathworks, Inc., Natick, MA).
2.3 In vivo Imaging
All mouse studies were conducted in compliance with the Washington University Animal Welfare Committee’s requirements for the care and use of laboratory animals in research. Balb/c mice were injected with 1 x 10⁶ 4T1 murine breast carcinoma cells on the flanks and the resulting subcutaneous orthotopic tumors were allowed to grow until they were approximately 10 mm in diameter. Mice were shaved prior to fluorescent dye injection and imaging. The Optix was used to acquire tumor fluorescence for dual-wavelength analysis, and the Pearl small animal imaging system (Licor, Lincoln, NE) for NIR-specific analysis. For intra-tumor injections (n = 3), LS903 was prepared in a 1% mouse serum albumin (MSA) solution in PBS, for a final dye concentration of 60 μM in 20 μL of solution per tumor. For intravenous injections (n = 2) LS904 was prepared in a 1% MSA solution in PBS, for a final dye concentration of 60 μM in 100 μL of solution per mouse. Animals were imaged both before and after injection for intra-tumor injections, and at 0, 2, and 4 hours post injection for intravenous injections. The maximum in vivo contrast was detected at 2 hours post injection, and images at this time point were used for depth analysis.
2.4 Optical parameter measurement
White silicone rubber sheets 0.010, 0.015, and 0.020 inches in thickness (86435K121, 86435K13, and 86435K15, respectively, McMaster-Carr, Elmhurst, IL) were divided into 2x2 inch sections. Three samples per thickness were measured using a custom integrating sphere setup (Beckman Laser Institute, University of California, Irvine, CA). By placement of the samples at the entrance or exit ports of an integrating sphere (4P-GPS-033-SL, Labsphere, North Sutton, NH), transmittance and reflectance values were measured using a broadband light source (HL2000 20W Quartz-Tunsten-Halogen lamp, Ocean Optics, Winter Park, FL), and spectrometer (Prime-X, B&W Tek, Newark, DE). Optical properties from 500 to 1000 nm were calculated with a MATLAB-based (MathWorks, Natick, MA) inverse adding-double algorithm (IAD) assuming a refractive index of 1.43, and anisotropy factor of 0.9. In brief, given transmittance and reflectance values, the IAD algorithm obtains absorption and scattering properties by iteratively solving the radiative transport equation until transmittance and reflectance values are matched [24].
3. Results
3.1 Structures and optical properties of dual fluorescent dyes
Figure 1(a) shows the structures of LS093 and LS904, with red and green colors representing the NIR and visible fluorescent dyes cypate and FITC, respectively. The absorption spectrum of LS903 showed the existence of both the cypate and FITC moieties (Fig. 1b). FITC peak emission was at 518 nm (Fig. 1c) and cypate peak emission was at 812 nm (Fig. 1d). The presence of two distinct fluorescent peaks allowed for imaging at dual-wavelengths, which was used to calculate the depth of the fluorescent signal.
3.2 Simulation of in vitro tissue depth estimation
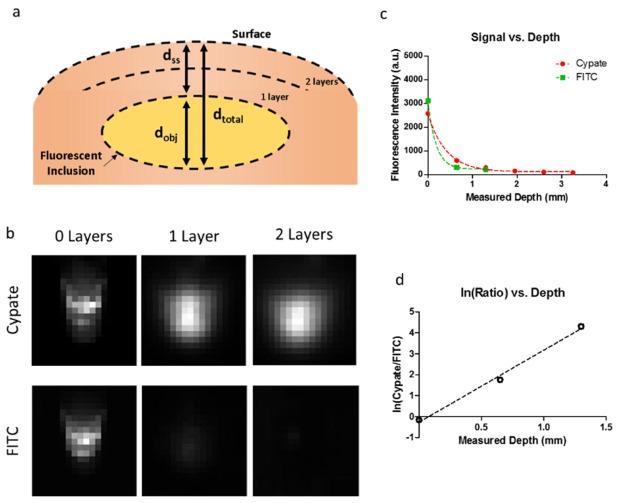
Description of tumor depth involves multiple depths that are of clinical significance. In intraoperative imaging, the distance from the edge of the tumor to the edge of the non-tumor tissue is important in margin determination in the vertical direction. This distance is analogous to the sub surface depth (dss) when delineating the tumor margin in the z-direction (Fig. 2(a)), or locating the depth of a fluorescent vessel under a tissue surface. There is also a depth of the tumor itself (dobj), and the overall depth of the tumor from the surface of the tissue (dtotal). The dtotal depth is important in tumor staging for malignancies that invade deeper structures. We quantified the signal from dual-wavelengths as a function of depth to determine the dss for in vivo tumor margin estimation and in vitro simulated vessel depth determination.
Fig. 2.
(a) Diagram showing depth configuration of fluorescent inclusion overlaid by a medium (lunchmeat, silicone, plastic, or skin). The layers represent the depth layers used for in vitro testing, the absolute number of layers varied depending on the test. (b) Images in both the cypate and FITC channels (rows) of an Eppendorf tube obscured by increasing layers of lunchmeat. No overlying lunchmeat in the left column, 1 layer of overlying lunchmeat in the middle column, and 2 layers of overlying lunchmeat in the right column. (c) Fluorescence signal vs. depth curve for the fluorescent ROI for LS903. (d) Natural log of the ratio of cypate-to-FITC for LS903.
We obscured LS903 in a 1.5 ml Eppendorf tube under an increasing number of lunchmeat slices to represent the increasing depth of a fluorescent inclusion below the surface. Figure 2(b) shows that the NIR signal (cypate) is visible at greater depths than the signal in the green channel (FITC). We plotted the signal for each channel vs. depth (Fig. 2(c)). The natural log of the ratio was plotted as a function of depth (Fig. 2d) to obtain a linear equation of the relationship (slope = 3.44, y-int = −0.27).
3.3 In vitro vessel depth estimation
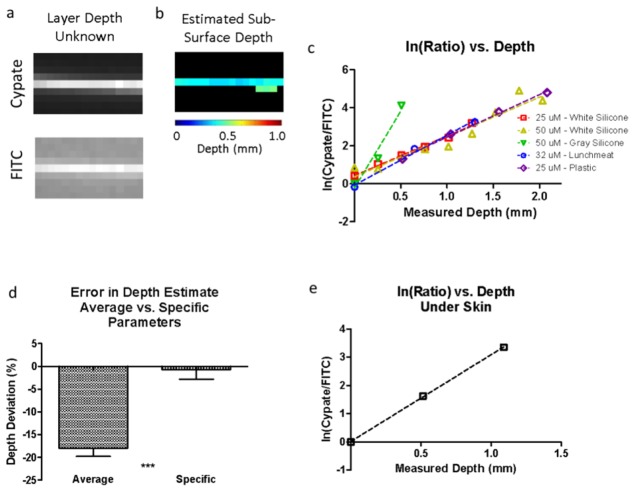
We simulated a vessel running beneath a layer of tissue by using silicone as our tissue phantom and polyurethane tubing as our vessel model. LS903 was allowed to flow through the vessel at varying concentrations (25 μM and 50 μM) and curves for the natural log of the ratios were generated (slope = 2.08, y-int = 0.43; slope = 2.10, y-int = 0.37). Next, we tested the performance of our method using a different material of unknown depth to obscure our vessel and imaged at both wavelengths (Fig. 3(a)). The predicted depth values for the vessel were mapped by using the ratio-curves previously generated (Fig. 3(b). The average estimated depth was 0.40 mm and the measured depth was 0.52 mm.
Fig. 3.
(a) Dual-wavelength images of the fluorescent vessel under layers of plastic with unknown depth and optical properties. (b) Depth map of estimated depth of vessel below the surface. (c) Natural log of the ratio of dual signals vs. measured depth for different overlying materials and concentrations showing differing slopes depending on the medium. (d) Comparison of the method accuracy for estimating depth in when using the average slope parameters and the specific slope parameter for a given medium. (e) Calibration curve using the fluorescent vessel under ex vivo mouse skin to determine the curve fit parameters for skin.
Varying the optical properties, by changing the overlying material, impacted our depth estimate (Fig. 3(c)). Materials that attenuated light more produced a higher slope value than materials that attenuated light less. Ideally, this slope would be predictable prior to estimating the depth. We quantified the difference in accuracy of our depth estimates using average parameters from different materials and specific parameters using the same material (Fig. 3(d)). There was a significant difference when using the different values (p < 0.001), thus indicating the importance of calibration studies with the same material used to perform the depth estimate. To translate this approach to in vivo imaging, we needed to generate a curve fit equation using the same material intended for the imaging study. To accomplish this goal, we layered mouse skin at varying depths to obtain a tissue-specific curve (slope = 3.08, y-int = 0.05) (Fig. 3(e)).
3.4 In vivo tumor depth estimation
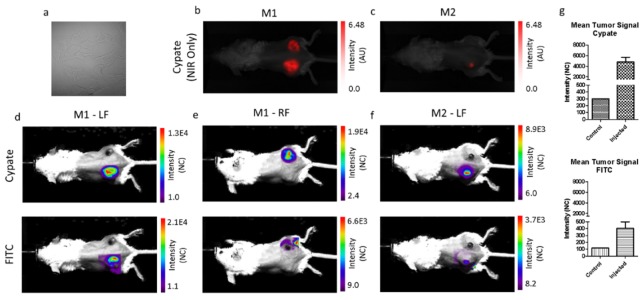
For in vivo depth estimation, we injected LS903 directly into 4T1 mouse flank tumors. Mouse 1 (M1) was injected bilaterally, and mouse 2 (M2) was only injected in the left flank tumor. The two mice were imaged using an NIR-specific imaging system, and a dual-wavelength imaging system. The NIR-specific imaging system shows the fluorescence distribution of LS903 in the mice (Fig. 4(b) and Fig. 4(c)). The dual-wavelength imaging system shows the fluorescence in the tumors in both the cypate and FITC channels (Figs. 4(d), 4(e), and 4(f)). The relative tumor signals were calculated in Fig. 4g, and in both channels the treated tumors had higher fluorescence signal than the untreated control tumor (M2-RF – not shown).
Fig. 4.
(a) Bright field image of 4T1 cells injected for xenograft model. NIR image of LS903 distribution using the cypate channel for (b) mouse 1 (M1) and (c) mouse 2 (M2). Dual-wavelength images of the tumor ROI in the cypate channel (top row) and FITC channel (bottom row) for column (d) M1-left flank (LF), (e) M1-right flank (RF), and (f) M2-LF. (g) Quantification of the in vivo tumor ROI signals for the cypate channel (top) and FITC channel (bottom).
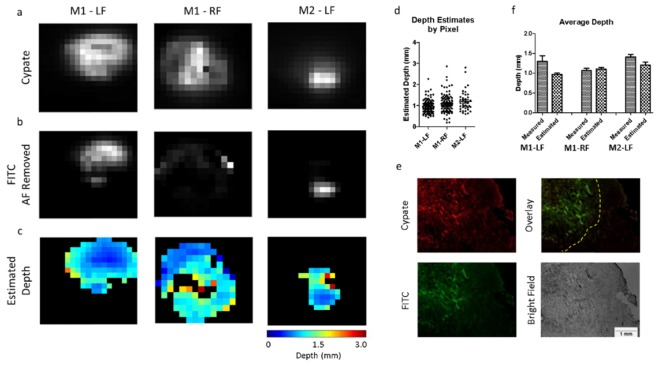
The image processing method used to analyze the images is shown in Fig. 5. Briefly, to estimate the depth of the fluorescence in the tumors, regions of interest (ROIs) were generated that included only the tumor in both the cypate (Fig. 6(a)) and FITC channels (Fig. 6(b)). The cypate image was thresholded to create the tumor ROI by removing pixels with low signal (background) and leaving only the region containing high signal (tumor). In this case, we were able to use a simple threshold method to isolate our tumor region because there was a high signal-to-background ratio for the cypate signal in the tumor vs. the surrounding tissue. In cases where the distinction between the tumor and the surrounding tissue may be less apparent, automated approaches can be employed to isolate the tumor [25]. Our tumor ROI (defined by the pixels identified in the cypate image) was then applied to the FITC channel, and the auto-fluorescence was subtracted from the FITC image. A pre-injection image in the FITC channel was used to establish the amount of auto-fluorescence to subtract prior to ratiometric analysis. The ratio of the images obtained at two wavelengths was used to create a map of the tumor depths for each of the tumors (Fig. 6(c)).
Fig. 5.
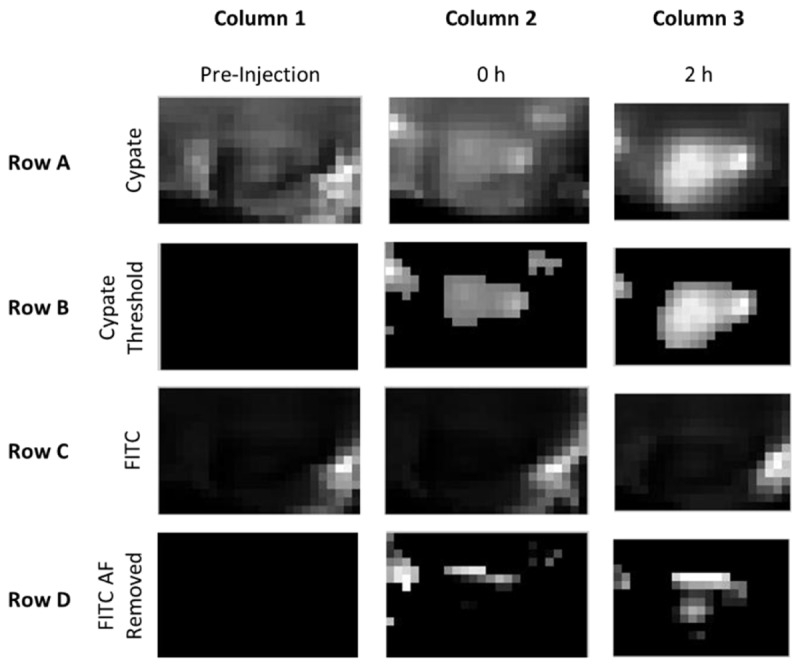
Overview of method for depth map generation from dual-wavelength imaging. Columns represent the (1) pre-injection image, (2) image immediately following the injection of the dye, and (3) image two hours following the injection of the dye. For intravenous probe administration, tumor accumulation of the dye was apparent at 2 hours post injection in the cypate channel (Row A, Column 3), so the 2 hour image was thresholded to determine the tumor ROI (Row B, Column 3). The FITC channel images contained high levels of auto-fluorescence from the hair and moderate levels in the skin (Row C). The tumor signal was not visible on a 0 – 255 grayscale until the high signal from the fur was removed. To remove the unwanted regions from the analysis, the pixels identified as the ROI using Cypate were applied to the FITC images (not shown). The remaining pixels were then compared to the average pre-injection FITC image values within the ROI. The pre-injection FITC image values were considered background and subtracted from the 2 hour FITC image, resulting in an FITC image that was of the ROI of interest with the pre-injection background values subtracted to remove auto-fluorescence (Row D, Column 3). The dual-wavelength images for cypate (Row B, Column 3) and FITC (Row D, Column 3) were used to calculate the depth estimate maps.
Fig. 6.
In vivo tumor images used for post processing. (a) Cypate images (top row), and (b) FITC images (bottom row) of the tumor region. The FITC image has the pre-injected auto-fluorescence subtracted from the tumor ROI. (c) Depth estimate maps for each of the tumors. (d) Pixel-by-pixel depth estimates for each tumor ROI. (e) Representative tumor histology (M2-LF) showing cypate fluorescence (top left), FITC fluorescence (bottom left), overlay of both channels (top right), and bright field image (bottom right). (f) Comparison of average measured depth vs. average estimated depth for each tumor.
The depth values for each pixel were plotted in Fig. 6(d) showing the distribution throughout the ROI. The tumor was then excised and prepared for histological analysis. In the tissue sections, both cypate and FITC channels were imaged, and areas of co-localization were analyzed (Fig. 6(e)). The apparent outline of the co-localized fluorescence region was determined by visual analysis, then 10 measurements from this outline of the co-localized area to the surface were taken. The average measured tumor sub-surface depths were 1.31 ± 0.442 mm, 1.07 ± 0.187 mm, and 1.42 ± 0.182 mm, compared to the average estimated depths of 0.97 ± 0.308 mm, 1.11 ± 0.428 mm, 1.21 ± 0.492 mm, respectively (Fig. 6(f)).
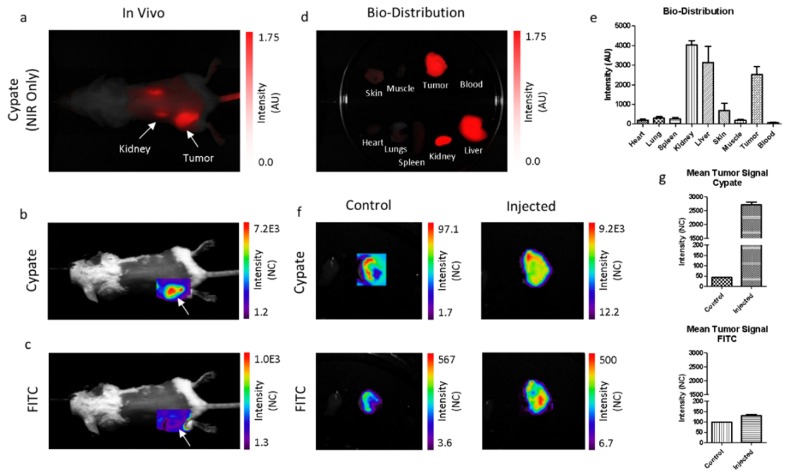
To evaluate if the dual-wavelength fluorescent dye could be used to estimate depth when administered systemically, we increased the water solubility of LS903 by conjugating it to PEG2000, to obtain LS904. The signals were measured in both channels as a function of depth and the natural log of the ratios for LS903 and LS904 were comparable. A 4T1 tumor bearing mouse was injected via the tail vein with LS904 and then imaged using the NIR-specific and dual-wavelength imaging systems. The cypate image shows that LS904 was present in the tumor region, as well as at the injection site in the tail. Dorsal view of the non-invasive image shows accumulation of the agents in the kidneys (Fig. 7(a)). The dual-wavelength images show that sufficient signal was present in the tumor ROI in both channels (Fig. 7(b) and Fig. 7(c)). The kidney was likely not visible in the FITC channel because it was deeper in the tissue than the green light could penetrate. Ex vivo imaging of major organs and tissues showed the compound was primarily in the tumor, as well as the clearance organs, the kidney and liver (Fig. 7(d)). Fluorescence from different tissues was quantified (Fig. 7(e)). Similarly, the ex vivo signals were measured in both channels for a control and the injected tumors (Fig. 7(f)), and the signals were quantified in Fig. 7(g).
Fig. 7.
(a) NIR image of LS904 distribution using the cypate channel. Dual-wavelength images of the tumor ROI in the (b) cypate, and (c) FITC channel. (d) Cypate ex vivo bio-distribution showing organ distribution of the dye, with (e) quantification. (f) Ex vivo tumor images of a mouse that was not injected with dye (left) and injected with LS904 (right). (g) Quantification of the ex vivo image signals for cypate and FITC.
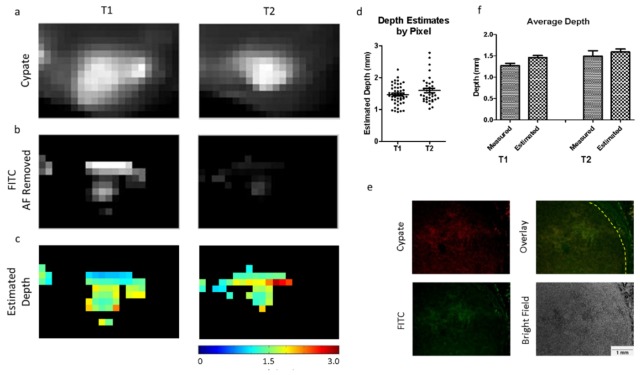
Depth maps were created for two tumors using the dual-wavelength images shown in Fig. 7. Figure 8(a) shows the cypate images, with the FITC images of the tumor ROIs in Fig. 8(b). Depth maps were created using our dual-wavelength images (Fig. 8(c)). Figure 8(d) shows a pixel-by-pixel representation of the depth estimates, and Fig. 8(e) shows the dual-wavelength histological analysis used for validation. The average measured depth values vs. the average estimated depth values for each of the tumors are shown in Fig. 8(f). The measured tumor sub-surface depths were 1.28 ± 0.168 mm, and 1.50 ± 0.394 mm, and the estimated depths were 1.46 ± 0.314 mm, and 1.60 ± 0.409 mm, respectively (Fig. 8(e)).
Fig. 8.
In vivo tumor images used for post processing. (a) Cypate images (top row), and (b) FITC images (bottom row) of the tumor regions (T1 and T2). The FITC image has the pre-injected auto-fluorescence subtracted from the tumor ROI. (c) Depth estimate maps for each of the tumors. (d) Pixel-by-pixel depth estimates for each tumor ROI. (e) Representative tumor histology (T2) showing cypate fluorescence (top left), FITC fluorescence (bottom left), overlay of both channels (top right), and bright field image (bottom right). (f) Comparison of average measured depth vs. average estimated depth for each tumor.
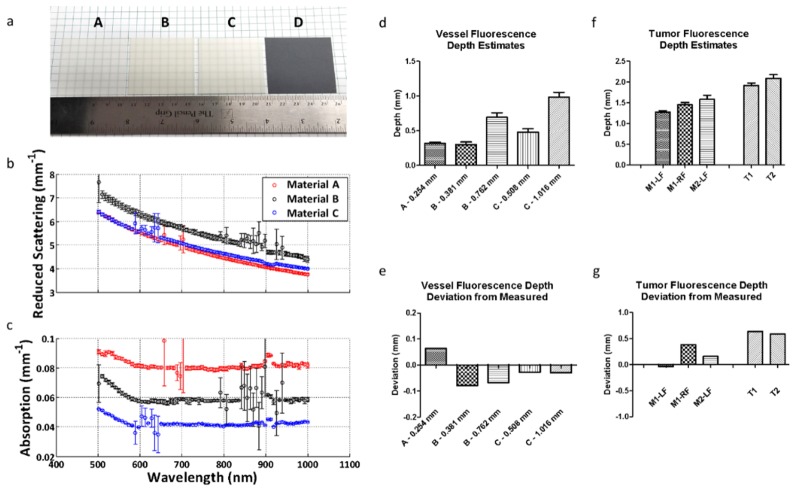
In previous trials, we assigned the slope of our curve based on empirical data. To lay the translational framework for this dual-wavelength approach, we next focused on a method for estimating the slope given the optical parameters of the material. We used an integrated sphere approach to calculate the absorption and scattering properties of silicone sections [24]. Figure 9(a) shows the silicone sections tested. Materials A, B, and C were white silicone sections of different thicknesses and durometers, and Material D was a gray silicone section. Because the materials were each of different durometers, and therefore had different material properties, they each had different absorption and scattering coefficients that could be measured. Figures 9(b) and 9(c) show the absorption and reduced scattering coefficients as a function of wavelength. Material D did not allow enough light to pass through to calculate the optical parameters and was therefore excluded from subsequent analysis. We then measured the cypate and FITC signals obtained at both wavelengths of interest for each material and used these values to calculate the coefficients of a transformation matrix. The coefficients of this matrix represented the transformation that could be used to determine the slope when the optical parameters were known. Equation (1) was used to represent the linear system of equations.
| (1) |
where Φ is a matrix of measured optical parameters for materials A, B and C at the wavelengths of interest, and m is a vector of the desired slopes for an optimized depth estimate. In expanding Eq. (1), the individual optical parameter values for Φ were entered for each material (A, B and C), and the series of equations represented by Eq. (2) was solved for each coefficient (x).
| (2) |
Table 1 outlines the individual optical parameter values used to solve the system of linear equations represented by Eq. (2).
Fig. 9.
(a) Images of silicone sections used to calculate absorption and reduced scattering coefficients at multiple wavelengths. Materials A, B, and C were white silicone sheets of different thicknesses and durometers. Material D was gray silicone; however, it was too opaque to obtain optical parameter data. (b) Reduced scattering coefficients as a function of wavelength for each material tested. (c) Absorption coefficients as a function of wavelength for each material tested. (d) Average fluorescence depth estimates of the simulated silicone vessel under the silicone sheets for each material using the optical parameter approach. Materials B and C were each stacked to show multiple depth estimates for the same material. (e) Average depth estimate deviation from measured for each material. (f) Average fluorescence depth estimates in vivo using the optical parameter approach. (g) Average depth estimate deviation from measured for each tumor.
Table 1. Measured optical parameters used for the matrix Φ to solve for the transform coefficients. Excitations at 518 nm and 812 nm were used to determine material properties for FITC and cypate fluorescence, respectively.
| (mm−1) | μa518 | μa812 | μ's518 | μ's812 |
|---|---|---|---|---|
| Material A | 0.09 | 0.080 | 6.20 | 4.40 |
| Material B | 0.07 | 0.058 | 7.05 | 5.15 |
| Material C | 0.05 | 0.041 | 6.20 | 4.60 |
In solving the system of linear equations in the form of Eq. (1), we found each x value (transform matrix coefficients). These coefficients allowed us to calculate the slopes in systems with known or measured optical parameters: xFITC_ab = 0; xCyp_ab = 336.51; xFITC_rs = −26.56; xCyp_rs = 33.37. The depth of the simulated vessel was estimated using only the optical parameters and linear transform to calculate the slope [Eq. (2)]. The silicone slices were stacked above our dye and the depths for the various materials were estimated (Fig. 9(d)). The deviations in depth estimation for each material are shown in Fig. 9(e), with each material falling within 0.1 mm error. Table 2 shows a summary of the results.
Table 2. Summary of estimated depths of simulated vessel under silicone obtained using the slope calculated from the measured optical parameters.
| Material | A | B | B | C | C |
|---|---|---|---|---|---|
| Estimated Depth (mm) | 0.318 | 0.302 | 0.695 | 0.481 | 0.986 |
| StDev (mm) | 0.116 | 0.269 | 0.394 | 0.350 | 0.414 |
| Measured Depth (mm) | 0.254 | 0.381 | 0.762 | 0.508 | 1.016 |
| Deviation (mm) | 0.064 | −0.079 | −0.067 | −0.027 | −0.030 |
The approach was then repeated using our previously obtained mouse tumor images along with optical parameter values reported in the literature for mouse skin. Mouse skin values at 518 nm and 812 nm were used to conduct this analysis with the absorption coefficients at approximately 0.175 and 0.070 mm−1, and the reduced scattering coefficients at approximately 1.65 and 0.70 mm−1, respectively [26]. Using these optical parameter values, and our calculated transform coefficients, we calculated a slope of 3.09 to use for the fluorescence depth estimates. The results obtained using this slope are shown in Fig. 9(f), and the deviations from the depths obtained using histology are shown in Fig. 9(g).
Using the forward model of optical parameters to estimate depth yielded results within 0.38 mm for the intra-tumor injections, and 0.63 mm for the intravenous injections. A summary of the results is shown in Table 3.
Table 3. Summary of estimated depths of tumor fluorescence in vivo obtained using the slope calculated from literature optical parameters.
| Tumor | M1 - LF | M1 - RF | M2 - LF | T1 | T2 |
|---|---|---|---|---|---|
| Estimated Depth (mm) | 1.271 | 1.448 | 1.578 | 1.913 | 2.085 |
| StDev (mm) | 0.401 | 0.557 | 0.641 | 0.408 | 0.532 |
| Measured Depth (mm) | 1.310 | 1.070 | 1.420 | 1.280 | 1.500 |
| Deviation (mm) | −0.039 | 0.378 | 0.158 | 0.633 | 0.585 |
4. Discussion
Fluorescence image guided surgery (FIGS) using molecularly targeted imaging agents has surged recently because of the real-time feedback of information for rapid assessment of surgical margins and the identification of microscopic lesions. To achieve these goals, most FIGS utilize planar fluorescence imaging technique. Depending on the tumor type such as ductal carcinoma in situ, a clear margin of healthy tissue up to 2 mm is required to prevent a second surgery. Unfortunately, a method for a simple tumor-depth estimation in the operating room using data from planar imaging systems is not readily available. Our dual wavelength excitation and emission approach is designed to estimate tissue depth by harnessing the shallow penetration of visible and the deeper penetration of NIR light for depth estimation. Although a loss of visible light signal will indicate a tumor is several microns away from the surface, calibrating the fluorescence intensity ratio with NIR fluorescence will reliably predict the tumor depth. We have outlined a method for determining the sub-surface depth of a fluorescent inclusion obscured by a scattering medium for the applications of depth determination of blood vessels and tumors. Using a monomolecular dual-wavelength probe eliminates errors caused by the difficulty in accurately determining the concentration of different dyes because the dyes are present in equimolar quantities. As such, the ratio of the signal obtained from each dye is predictable and can be used to calculate the depth. Because our green light signal attenuates rapidly in the tissue, we were only able to apply this technique to determine the sub-surface depth when the fluorescent inclusion was near the surface. Our custom fluorescent probe was used to validate the concept of a dual-emission fluorescent probe and serves as a platform for the creation of additional dual-emission probes. These probes can be custom designed for depth imaging. For example, by conjugating a red dye to cypate, we would be able to obtain deeper tissue imaging. Further optimization of this method would allow for estimating depths optically down to centimeters within the tissue.
The dual-wavelength approach for sub-surface depth estimation is impacted by tissue optical properties. As such, a priori knowledge of the type of tissue can be applied in a feed-forward manner for translational imaging. Our method allows for predicting tissue optical properties in a variety of tissue types such that they can be used for depth estimation. In Fig. 9 we demonstrated that the tissue optical parameters could be used to generate a slope value which could in turn be used to estimate depth. Previous works relied on Monte Carlo simulation to determine the optical parameters to input into their depth estimation. We used a linear equation based estimation method that adequately predicted our optical parameters. This method was sufficiently robust for the expansion of dual-wavelength imaging to in vivo applications.
Other researchers have developed methods for estimating tissue optical properties including parameterized mathematical models [27] and in vivo spatial-frequency domain imaging [28]. By combining these techniques with a dual-wavelength probe, accurate depth-resolved tissue imaging may be achievable in many different tissue types. Because our approach relies on the localization of the fluorescence signal for depth determination, the targeting moiety must be specific to the structure of interest. We employed the EPR effect to deliver our probe and demonstrated higher tumor signal compared to surrounding tissue Fig. 7. Many tumor targeting probes under development have the potential to improve the accuracy of the method.
Our method is beneficial because it is non-invasive, and it can be used in situations where a physical measurement is not possible. In the case of tumors containing fluorescence, the distance of the fluorescence below the surface could not be measured using a manual method such as calipers because there was no defined physical surface to measure from. Assessing the tumor sub-surface depth using calipers would require perturbing the tissue, and would be difficult to execute since skin and subcutaneous tissue deform when physically contacted. We attempted this procedure, but we were only able to obtain measurements of the skin itself (which was also distorted). This measurement was not representative of the system because the fluorescence in the tumors was localized to tissue deeper than just the skin layer. Because a physical measurement was not possible, we relied on fluorescence histology to validate our approach. We conducted 10 measurements from the co-localized signal to the surface. However, additional measurements over a larger area would be needed to determine the robustness of the method. We used a relatively high concentration of the imaging agents in this study to obtain an adequate signal for the calculation of depth estimates. Replacing the green with a red dye will increase the imaging depth using lower dye concentration. The effective dye concentration in tumors could be increased by using a more tumor specific targeting fluorescent agents.
We have demonstrated the feasibility of using a dual-wavelength custom developed fluorescent probe to determine the sub-surface depth of structures in tissue. An advantage of using an optical probe over auto-fluorescence spectral data alone is that dyes also can be readily targeted to specific biologic structures using cellular receptors. The specificity of optical imaging allows for flexibility in the approach for different preclinical and clinical uses, such as when a physical depth measurement would disrupt the tissue or be difficult to obtain. The simplicity of real-time planar optical imaging is advantageous for applications such as intraoperative imaging; allowing for the same fluorescent probe to be used for both the identification and depth characterization of structures in tissues. By understanding the sub-surface depth of a tumor, positive margins in the z-direction may be reduced. Further, once a gross pathological specimen is removed from the body, real-time margin assessment can be performed via imaging prior to histological evaluation.
Disclosures
The authors declare that there are no conflicts of interest related to this article.
Acknowledgments
The authors thank Kexian Liang for the synthesis of cypate and Gail Sudlow for animal model assistance.
Funding
National Institutes of Health (NIH) (R01 CA171651, R01 EB00811, S10 OD020129, and P50 CA094056, CA171651-04S1, S10OD016419, T32 EB014855, P30 CA091842); Alvin J. Siteman Cancer Research Fund (11-FY16-01).
References and links
- 1.Frangioni J. V., “In vivo near-infrared fluorescence imaging,” Curr. Opin. Chem. Biol. 7(5), 626–634 (2003). 10.1016/j.cbpa.2003.08.007 [DOI] [PubMed] [Google Scholar]
- 2.Kobayashi H., Choyke P. L., “Target-Cancer-Cell-Specific Activatable Fluorescence Imaging Probes: Rational Design and in Vivo Applications,” Acc. Chem. Res. 44(2), 83–90 (2011). 10.1021/ar1000633 [DOI] [PMC free article] [PubMed] [Google Scholar]
- 3.van Dam G. M., Themelis G., Crane L. M., Harlaar N. J., Pleijhuis R. G., Kelder W., Sarantopoulos A., de Jong J. S., Arts H. J., van der Zee A. G., Bart J., Low P. S., Ntziachristos V., “Intraoperative tumor-specific fluorescence imaging in ovarian cancer by folate receptor-α targeting: first in-human results,” Nat. Med. 17(10), 1315–1319 (2011). 10.1038/nm.2472 [DOI] [PubMed] [Google Scholar]
- 4.Liu Y., Bauer A. Q., Akers W. J., Sudlow G., Liang K., Shen D., Berezin M. Y., Culver J. P., Achilefu S., “Hands-free, wireless goggles for near-infrared fluorescence and real-time image-guided surgery,” Surgery 149(5), 689–698 (2011). 10.1016/j.surg.2011.02.007 [DOI] [PMC free article] [PubMed] [Google Scholar]
- 5.Valdés P. A., Leblond F., Jacobs V. L., Wilson B. C., Paulsen K. D., Roberts D. W., “Quantitative, spectrally-resolved intraoperative fluorescence imaging,” Sci. Rep. 2, 798 (2012). 10.1038/srep00798 [DOI] [PMC free article] [PubMed] [Google Scholar]
- 6.Becker A., Hessenius C., Licha K., Ebert B., Sukowski U., Semmler W., Wiedenmann B., Grötzinger C., “Receptor-targeted optical imaging of tumors with near-infrared fluorescent ligands,” Nat. Biotechnol. 19(4), 327–331 (2001). 10.1038/86707 [DOI] [PubMed] [Google Scholar]
- 7.Luker G. D., Luker K. E., “Optical imaging: current applications and future directions,” J. Nucl. Med. 49(1), 1–4 (2007). 10.2967/jnumed.107.045799 [DOI] [PubMed] [Google Scholar]
- 8.Dunn A. K., Wallace V. P., Coleno M., Berns M. W., Tromberg B. J., “Influence of optical properties on two-photon fluorescence imaging in turbid samples,” Appl. Opt. 39(7), 1194–1201 (2000). 10.1364/AO.39.001194 [DOI] [PubMed] [Google Scholar]
- 9.Hall D., Ma G., Lesage F., Wang Y., “Simple time-domain optical method for estimating the depth and concentration of a fluorescent inclusion in a turbid medium,” Opt. Lett. 29(19), 2258–2260 (2004). 10.1364/OL.29.002258 [DOI] [PubMed] [Google Scholar]
- 10.Konecky S. D., Mazhar A., Cuccia D., Durkin A. J., Schotland J. C., Tromberg B. J., “Quantitative optical tomography of sub-surface heterogeneities using spatially modulated structured light,” Opt. Express 17(17), 14780–14790 (2009). 10.1364/OE.17.014780 [DOI] [PMC free article] [PubMed] [Google Scholar]
- 11.Bélanger S., Abran M., Intes X., Casanova C., Lesage F., “Real-time diffuse optical tomography based on structured illumination,” J. Biomed. Opt. 15(1), 016006 (2010). 10.1117/1.3290818 [DOI] [PubMed] [Google Scholar]
- 12.Lukic V., Markel V. A., Schotland J. C., “Optical tomography with structured illumination,” Opt. Lett. 34(7), 983–985 (2009). 10.1364/OL.34.000983 [DOI] [PubMed] [Google Scholar]
- 13.Patwardhan S., Bloch S., Achilefu S., Culver J., “Time-dependent whole-body fluorescence tomography of probe bio-distributions in mice,” Opt. Express 13(7), 2564–2577 (2005). 10.1364/OPEX.13.002564 [DOI] [PubMed] [Google Scholar]
- 14.Solomon M., White B. R., Nothdruft R. E., Akers W., Sudlow G., Eggebrecht A. T., Achilefu S., Culver J. P., “Video-rate fluorescence diffuse optical tomography for in vivo sentinel lymph node imaging,” Biomed. Opt. Express 2(12), 3267–3277 (2011). 10.1364/BOE.2.003267 [DOI] [PMC free article] [PubMed] [Google Scholar]
- 15.Stuker F., Ripoll J., Rudin M., “Fluorescence molecular tomography: principles and potential for pharmaceutical research,” Pharmaceutics 3(4), 229–274 (2011). 10.3390/pharmaceutics3020229 [DOI] [PMC free article] [PubMed] [Google Scholar]
- 16.Corlu A., Choe R., Durduran T., Rosen M. A., Schweiger M., Arridge S. R., Schnall M. D., Yodh A. G., “Three-dimensional in vivo fluorescence diffuse optical tomography of breast cancer in humans,” Opt. Express 15(11), 6696–6716 (2007). 10.1364/OE.15.006696 [DOI] [PubMed] [Google Scholar]
- 17.Kepshire D., Davis S. C., Dehghani H., Paulsen K. D., Pogue B. W., “Fluorescence tomography characterization for sub-surface imaging with protoporphyrin IX,” Opt. Express 16(12), 8581–8593 (2008). 10.1364/OE.16.008581 [DOI] [PMC free article] [PubMed] [Google Scholar]
- 18.Kolste K. K., Kanick S. C., Valdés P. A., Jermyn M., Wilson B. C., Roberts D. W., Paulsen K. D., Leblond F., “Macroscopic optical imaging technique for wide-field estimation of fluorescence depth in optically turbid media for application in brain tumor surgical guidance,” J. Biomed. Opt. 20(2), 026002 (2015). 10.1117/1.JBO.20.2.026002 [DOI] [PMC free article] [PubMed] [Google Scholar]
- 19.Swartling J., Svensson J., Bengtsson D., Terike K., Andersson-Engels S., “Fluorescence spectra provide information on the depth of fluorescent lesions in tissue,” Appl. Opt. 44(10), 1934–1941 (2005). 10.1364/AO.44.001934 [DOI] [PubMed] [Google Scholar]
- 20.Leblond F., Ovanesyan Z., Davis S. C., Valdés P. A., Kim A., Hartov A., Wilson B. C., Pogue B. W., Paulsen K. D., Roberts D. W., “Analytic expression of fluorescence ratio detection correlates with depth in multi-spectral sub-surface imaging,” Phys. Med. Biol. 56(21), 6823–6837 (2011). 10.1088/0031-9155/56/21/005 [DOI] [PMC free article] [PubMed] [Google Scholar]
- 21.Swartling J., Svensson J., Bengtsson D., Terike K., Andersson-Engels S., “Fluorescence spectra provide information on the depth of fluorescent lesions in tissue,” Appl. Opt. 44(10), 1934–1941 (2005). 10.1364/AO.44.001934 [DOI] [PubMed] [Google Scholar]
- 22.Achilefu S., Dorshow R. B., Bugaj J. E., Rajagopalan R., “Novel receptor-targeted fluorescent contrast agents for in vivo tumor imaging,” Invest. Radiol. 35(8), 479–485 (2000). 10.1097/00004424-200008000-00004 [DOI] [PubMed] [Google Scholar]
- 23.Stryer L., Haugland R. P., “Energy transfer: a spectroscopic ruler,” Proc. Natl. Acad. Sci. U.S.A. 58(2), 719–726 (1967). 10.1073/pnas.58.2.719 [DOI] [PMC free article] [PubMed] [Google Scholar]
- 24.Prahl S. A., van Gemert M. J., Welch A. J., “Determining the optical properties of turbid mediaby using the adding-doubling method,” Appl. Opt. 32(4), 559–568 (1993). 10.1364/AO.32.000559 [DOI] [PubMed] [Google Scholar]
- 25.Miller J. P., Egbulefu C., Prior J. L., Zhou M., Achilefu S., “Gradient-Based Algorithm for Determining Tumor Volumes in Small Animals Using Planar Fluorescence Imaging Platform,” Tomography 2(1), 17–25 (2016). 10.18383/j.tom.2016.00100 [DOI] [PMC free article] [PubMed] [Google Scholar]
- 26.Sabino C. P., Deana A. M., Yoshimura T. M., da Silva D. F., França C. M., Hamblin M. R., Ribeiro M. S., “The optical properties of mouse skin in the visible and near infrared spectral regions,” J. Photochem. Photobiol. B 160, 72–78 (2016). 10.1016/j.jphotobiol.2016.03.047 [DOI] [PMC free article] [PubMed] [Google Scholar]
- 27.Jacques S. L., “Optical properties of biological tissues: a review,” Phys. Med. Biol. 58(11), R37–R61 (2013). 10.1088/0031-9155/58/11/R37 [DOI] [PubMed] [Google Scholar]
- 28.Cuccia D. J., Bevilacqua F., Durkin A. J., Ayers F. R., Tromberg B. J., “Quantitation and mapping of tissue optical properties using modulated imaging,” J. Biomed. Opt. 14(2), 024012 (2009). 10.1117/1.3088140 [DOI] [PMC free article] [PubMed] [Google Scholar]


