Abstract
We report a generic method for automatic segmentation of endoscopic optical coherence tomography (OCT) images. In this method, OCT images are first processed with L1-L0 norm minimization based de-noising and smoothing algorithms to increase the signal-to-noise ratio (SNR) and enhance the contrast between adjacent layers. The smoothed images are then formulated into cost graphs based on their vertical gradients. After that, tissue-layer segmentation is performed with the shortest path search algorithm. The efficacy and capability of this method are demonstrated by automatically and robustly identifying all five interested layers of guinea pig esophagus from in vivo endoscopic OCT images. Furthermore, thanks to the ultrahigh resolution, high SNR of endoscopic OCT images and the high segmentation accuracy, this method permits in vivo optical staining histology and facilitates quantitative analysis of tissue geometric properties, which can be very useful for studying tissue pathologies and potentially aiding clinical diagnosis in real time.
OCIS codes: (170.4500) Optical coherence tomography, (100.0100) Image processing, (100.5010) Pattern recognition, (170.4580) Optical diagnostics for medicine
1. Introduction
Optical coherence tomography (OCT) is a powerful imaging technology for assessing biological tissue morphology, blood flow, optical and mechanical properties [1–4]. With the help of innovative endoscopes, OCT can provide high resolution 2D and 3D images of internal luminal organs in vivo and in real time [2–7]. To facilitate the extraction and utility of structural and quantitative information from the large amount of OCT imaging data, one important measure is to automatically segment tissue layers of interest from the images. One example of direct clinical relevance is the thickness of retinal layer and nerve fiber layer based on OCT images for glaucoma staging [8, 9].
Various automatic or semi-automatic methods have been proposed for OCT image segmentation [10–17]. The widely-used methods are based on the OCT intensity variation, such as the pixel-level edge detection algorithm [10, 11], the 1-D intensity peak detection procedure for each A-scan [12], and the support vector machine method based on mean intensity of each layer [13, 14]. Furthermore, the intensity variation-based method has been successfully applied to segment retinal layers from 3D OCT data sets [15]. These approaches, however, are intrinsically sensitive to noise and could potentially fail to detect tissue layer boundaries correctly if the boundaries seem to be discontinued in the images due to view blocking, tissue folding, or low contrast resulting from low signal-to-noise ratio (SNR). To overcome the noise issue, graph cut methods have been proposed by taking into account both the edge-based and the region-based terms [16]. However, these methods require a priori knowledge of the tissue structure and their accuracy heavily depends on the choice of the a priori conditions. Active contour segmentation approaches based on the level set theory have also been proposed to find the boundary of each layer by optimizing a cost function [18, 19]; however, they are liable to fall into local optima. Recently, methods based on graph theory were developed to segment the retinal layers, promising results were demonstrated with very high efficiency and accuracy [20–24].
So far, most reported OCT image segmentation methods targeted retinal OCT images. To the best of our knowledge, there is no literature reporting an accurate and robust segmentation method for ultrahigh-resolution endoscopic OCT images of luminal organs, such as esophagus and airway. We hypothesize that accurate segmentation of endoscopic OCT images can help quantitatively study tissue integrity and remodeling of luminal organs associated with various diseases, such as Eosinophilic Esophagitis (EoE) and Barrett's esophagus [25–27]. Segmentation of endoscopic OCT images has to address some common challenges similar to those encountered in segmenting free-space retinal OCT images, including the intrinsic speckle noise, intensity change with depth, and motion artifacts (associated with in vivo imaging). In addition, endoscopic OCT images come with their own challenges, such as steep layer boundary slopes due to tissue folding, view blocking by mucus or some debris (such as food debris in esophagus), and image distortion caused by non-uniform azimuthal scanning speed.
To address these challenges, we propose an automatic and robust layer segmentation approach for endoscopic OCT images. This approach firstly incorporates L1-L0 norm minimization based de-noising and smoothing methods to reduce the image noise and improve the image contrast; then it numerically attenuates the intensity along the image depth and identifies each layer’s boundary by searching for the lowest cost path. This paper is organized as follows: in section 2, the detailed segmentation method is presented; in section 3, the effectiveness and robustness of this method are demonstrated by segmenting in vivo guinea pig esophagus images acquired by our home-built OCT endoscope. Based on the accurate segmentation results, in vivo optical staining histology of guinea pig esophagus is also demonstrated. Finally, a brief discussion is provided along with conclusion in section 4.
2. Methods
Our segmentation method is primarily based on the gradient information and graph theory. As we have pointed out, gradient-based method is generally sensitive to noise. To address this problem, an L1 norm minimization based de-noising technique is firstly applied to reduce the image noise [28]. Secondly, in order to mitigate the influence of gradients resulting from intra-layer structures, the intra-layer fine structures are smoothed out by using an L0 norm minimization based smoothing algorithm [29]. Thirdly, the image signal intensity is numerically attenuated along imaging depth in order to ensure a gradually increasing cost function along depth direction (as elaborated in section 2.3) and facilitate automatic identification of each sequential layer boundaries for later step. Finally, each layer on the image is segmented by calculating the weight of each graph node and searching for the lowest cost path.
Our method is tested on segmenting the endoscopic OCT images of guinea pig esophagus. Figure 1 shows a representative histology image illustrating well-delineated layered structure of guinea pig esophagus [6]. In our method, we firstly segment the stratum corneum (SC) layer and then move on to segment each other layers in sequence (along imaging depth), such as the epithelium (EP), lamina propria (LP), muscularis mucosae (MM), and submucosa (SM), respectively. Since our method does not actually utilize any special property of tissues, it can be generalized for layer segmentation of other luminal organs, such as airway and colon.
Fig. 1.
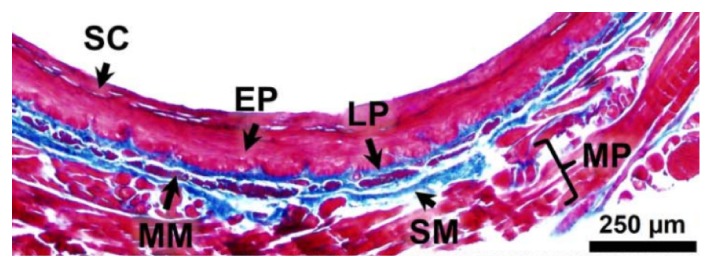
Histology of guinea pig esophagus. SC: stratum corneum; EP: epithelium; LP: lamina propria; MM: muscularis mucosae; SM: submucosa; MP: muscularis propria.
2.1 L1-L0 norm minimization based de-noising and smoothing methods
In order to obtain reliable image intensity gradient for each layer boundary, we firstly reduce the speckle noise of OCT images. However, it is well known that the general low-pass filters, such as the Gaussian or Butterworth filter [30], will blur the feature edges of the image and weaken the strong gradients. To preserve the strong gradients while minimizing the speckle noise, we adopt the total variation minimization algorithm [28]. In essence, the algorithm searches for a desired noise-free (ideal) image (denoted by u) by minimizing the following variant gradient L1 norm as:
| (1) |
where is a regulation parameter to adjust the weight of the total variation,is the original noisy image, denotes the 2D gradient operator, is a stabilization parameter, and represents the 2D image space domain. The explicit image pixel position is omitted in and for simplicity. It is noted that Eq. (1) is slightly different from the classic total variation formulation by the introduction of, which is used to remove potential singularities and stabilize the solution. In our case, we choose. This de-noising procedure is equivalent to seeking for a solution of u that can best resemble the original noisy image g while still maintaining a sparse gradient field. By minimizing the gradient L1 norm in Eq. (1), the solution of u will be:
| (2) |
where is the image boundary of . Equation (2) can be discretized using a fixed point finite difference scheme, which iteratively estimates u and its gradient to obtain the solution, i.e., the desired noise-free image u [31].
Furthermore, we found that the fine structures within each layer have strong gradients, which often interfere severely with the search for the desired inter-layer boundaries. For this end, an L0 norm minimization based smoothing approach is applied to preserve the salient boundary of each layer and blur the fine structures within each layer. The employed L0 norm smooth function is:
| (3) |
where is a weight parameter to adjust the smoothing extent, u is the de-noised image, refers to the expected smooth image, and denotes L0 norm. Here is defined as , is a set operation which counts the number of set elements,andare the partial derivatives of with respect to x and y, respectively. The goal of this optimization procedure is to find the smooth image whose gradients have the minimal L0 norm, while preserving the major features of the noise-free image u.
However, it is well known that Eq. (3) is concave due to the calculation of L0 norm, and thus difficult to optimize [32, 33]. To address this challenge, we introduce an auxiliary vector variable, whereis the partial derivative of with respect to x, and is the partial derivative of with respect to y. By trying to let be as close to as possible, Eq. (3) can be converted into:
| (4) |
whereis a scaling parameter to control the proximity betweenand. Then, the optimization of Eq. (4) can be divided into two sub-problems. One is:
| (5) |
and the other is:
| (6) |
It can be found that Eq. (5) is convex and Eq. (6) can be solved according to Ref [34]. By alternately optimizing Eq. (5) and Eq. (6), the expected smooth image can be obtained [31].
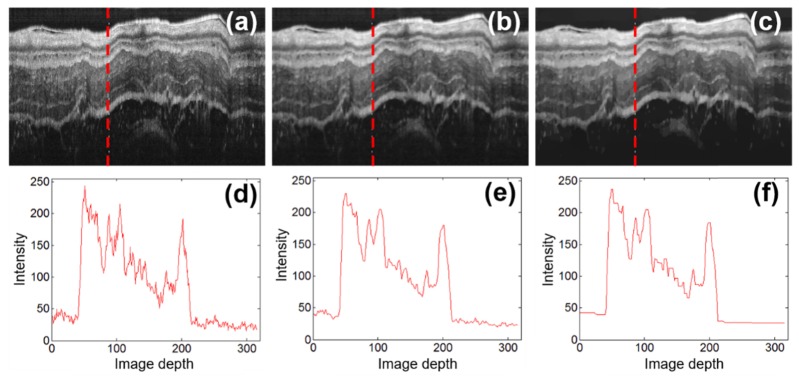
Through the above L1-L0 de-noising and smoothing procedures, we can obtain OCT images with lower noise and higher contrast, as shown in Figs. 2(a)-2(c). As seen from the represetative intensity profiles illustrated in Figs. 2(d)-2(f), the fine structures within each layer are effectivly smoothed while the layer boundraies are well preserved after the de-noising and smoothing procedures.
Fig. 2.
Representative endoscopic OCT images of guinea pig esophagus before and after L1-L0 norm minimization based de-noising and smoothing procedures. (a)-(c) are the original OCT image, image after the de-noising procedure, and image after the de-noising and smoothing procedures, respectively; (d)-(f) are the representative intensity profiles along imaging depth (in the units of pixel) corresponding to the A-scan labeled with red dashed vertical lines in (a)-(c).
2.2 Graph path and layer segmentation
By treating each pixel as a graph node and the relationship between neighboring pixels as edges (here we define the edge weight as the summation of neighboring pixels' gradients), the image after de-noising and smoothing can be represented as a graph G(V, E), where V is the set of vertices of nodes and E is the set of edges. If we weigh the graph edges appropriately, these boundaries between adjacent layers could correspond exactly to the preferred graph paths. Accordingly, the problem of layer segmentation is transformed to a problem of searching for the preferred graph paths, which can be solved by dynamic programming method [35].
In principle, the weight of each edge is crucial to the accuracy of layer segmentation. Owing to the L1-L0 norm minimization based de-noising and smoothing procedures, the resulted layer boundaries of OCT images become more pronounced with high gradients. Therefore, we could simply use the vertical gradients (along the imaging depth) to calculate the weight of each edge. To further improve the robustness of the gradient calculation, we use a vertical gradient operator k [30]:
and the image gradients can be obtained by convolving imagewith k, i.e.,
| (7) |
where denotes convolution operation. To facilitate further processing, the grad matrix of the image can be normalized as:
| (8) |
where and are the minimum and maximum functions, respectively. Based on gradNm, we assign a cost value to each node(i, j), denoted by C(i, j), as:
| (9) |
In this way, the cost value of each node is reversely proportional to its vertical gradient. Then the edge weight between node(i, j) and node(m, n), denoted by W(i,j)-(m,n), can be defined as:
| (10) |
wheredenotes the nearest neighboring pixels of node(i, j). In our method we associate each node with its eight nearest neighbors, i.e.
| (11) |
It can easily be seen that the edge weight is designed to be smaller for edges between two neighboring pixels (nodes) both with larger magnitude of vertical gradients; such two pixels potentially delineate layer boundaries. While for two neighboring pixels within one layer, their vertical gradients tend to be small, and then the edge weight between them tends to be large. Hence, by applying the shortest path search to find the path with minimal weight W(i,j)-(m,n) among its eight neighboring pixels [36–38], the task of identifying layer boundaries can be formulated as a problem of seeking the minimal cost graph path, which could be readily solved via the dynamic programming algorithm [39,40]. It is worth noting that a similar shortest path search method was first introduced by Chiu et al. for segmenting retinal structures [21].
2.3 Numerical attenuation of depth-dependent image intensity
For endoscopic OCT images of luminal organs (such as esophagus), the imaging beam usually focuses inside the tissue instead of on the tissue surface; thus the surface boundary of the first tissue layer does not always have the highest gradient. This results in a compromised accuracy for the identification of the first layer boundary, which in turn affects the effectiveness of sequential search for other layer boundaries. Theoretically, the influence of the depth-dependent effects of the beam profiles can be numerically compensated [41]; however, it is complex for endoscopic OCT imaging. Instead, we numerically attenuate the image intensity along imaging depth so that the first layer boundary will have the highest gradient and then each sequential layer boundary will have a gradient lower than that of its precedent. To do so, we introduce a depth (y)-dependent attenuation function:
| (12) |
where is the attenuation amplitude, and n is the attenuation exponent. For different imaging conditions, these two parameters should be adjusted accordingly. In our case we empirically choose = 0.01 and n = 2. Then the smoothed image is attenuated with this depth-dependent function before calculating the image gradient (i.e., grad):
| (13) |
This intensity attenuation can greatly facilitate the identification of the first boundary by using the shortest path searching algorithm since the first boundary (or the tissue surface) will now have the highest gradient in the image. In order to optimize the searching efficiency, we adopt the same method as reported in [20, 42] to limit the search area for the segmentation of each layer by using the prior knowledge of the tissue layer thickness with a ± 20% tolerance. This prior knowledge was acquired from manual segmentation of the endoscopic OCT images of the same subject that have a good histological correlation.
3. Segmentation and optical staining of esophagus images
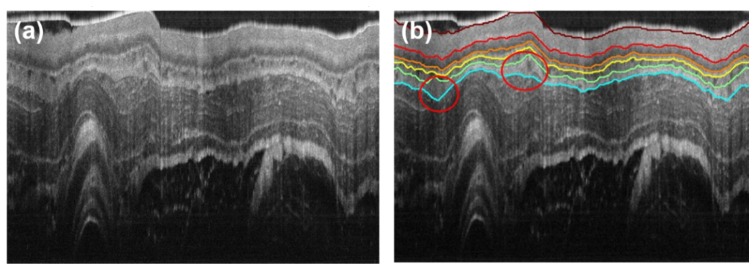
The performance of the above segmentation method is tested on in vivo OCT images of guinea pig esophagus, which were acquired with an 800-nm ultrahigh resolution endoscopic OCT system [6, 7]. Figure 3(a) shows a representative image where some layer boundaries can be visually (but vaguely) identified, such as the boundaries of the epithelium (EP), lamina propria (LP), and muscularis mucosa (MM). In comparison, our segmentation result is shown in Fig. 3(b), where the boundaries of all five layers of interest are successfully identified and the layer thicknesses can be further quantified. Unlike [42] in which the images need to be numerically flattened before segmentation, our method can directly segment original OCT images with undulating layers (and layer boundaries). Furthermore, it can be seen from Fig. 3(b) that even in the presence of dramatic kinks of tissue layers, e.g. the areas marked by red circles, the layer boundaries can still be reliably identified.
Fig. 3.
Segmentation of a representative endoscopic OCT image. (a) Representative cross-section in vivo OCT image of guinea pig esophagus. (b) Segmentation result of (a), with lines of different colors indicating the layer boundaries. Red circles indicate areas of dramatic kinks of tissues layers. Deep red: boundary 1, SC surface; red: boundary 2, SC/EP interface; orange: boundary 3, EP/LP interface; yellow: boundary 4, LP/MM interface; green: boundary 5, MM/SM interface; cyan: boundary 6, SM/MP interface.
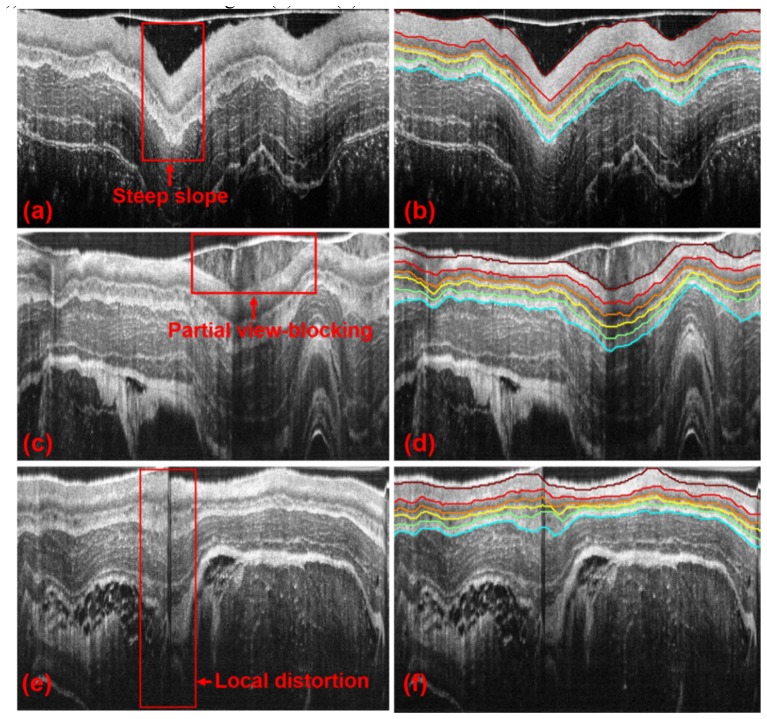
As aforementioned, OCT images possess a set of unique challenges conveyed by endoscopic setting and luminal organs. Shown in Fig. 4 are exemplary challenging images with steep slopes in the layer boundaries (Fig. 4(a)), with partial view-blocking (Fig. 4(c)) and with local distortion (Fig. 4(e)). Specifically, steep boundary slopes are usually caused by luminal tissue folding or sudden change of the endoscope position relative to the lumen wall; partial view-blocking generally results from mucus or blood vessels, or food debris for the case of esophagus; image distortion can occur due to non-uniform rotation speed of the endoscope. We tested our method on these images and the corresponding results are shown in Figs. 4(b), 4(d), and 4(f). As seen from the segmentation results, each tissue layer can be accurately identified for all these ill-posed cases, which therefore demonstrated the robustness of the method. Furthermore, in order to show the reproducibility of the current method, 50 sequential OCT images of guinea pig esophagus have been segmented automatically and illustrated in Visualization 1 (3MB, MPG) in the supplementary materials.
Fig. 4.
Segmentation of the representative ill-posed endoscopic OCT images with different challenges. OCT images of a guinea pig esophagus with steep slopes in layer boundaries, partially blocked view, and local distortions, are shown in (a), (c), and (e), respectively. Areas boxed with red solid lines in (a), (c), and (e) indicate the challenging areas of each image. (b), (d), and (f) show the corresponding segmentation results of (a), (c) and (e), respectively.
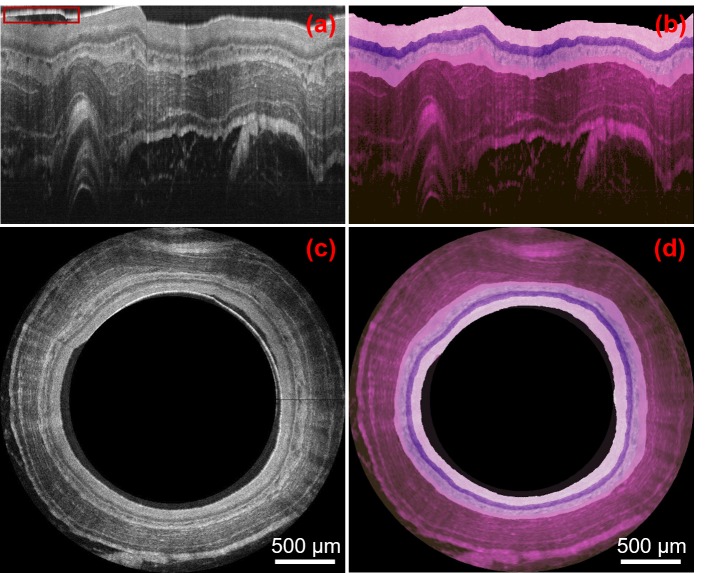
Together with the ultrahigh resolution and high SNR of OCT images, the accuracy afforded by the automatic and robust segmentation method offers a unique opportunity to optically code tissue structures with different color to achieve in vivo optically stained histology-alike images. Various color-coding schemes can be chosen to mimic different histological staining effects. Here we use a color scheme similar to (but not exactly the same as) the widely-used H&E staining as an example. We stain each layer by mapping the gray-scale intensity to a designated RGB color map. Figures 5(b) and 5(d) show the optically stained OCT images in the Cartesian and polar coordinates, respectively. The image area above the tissue surface including the plastic sheath (as boxed with a red rectangle in Fig. 5(a)) is masked out in both Figs. 5(b) and 5(d).
Fig. 5.
Optical staining of representative endoscopic OCT images. (a-b): OCT image of guinea pig esophagus and its optical staining version in Cartesian coordinates. (c-d): OCT image of guinea pig esophagus and its optical staining version in polar coordination. Red box in (a) contains a residual portion of the plastic sheath was exclude from optical staining.
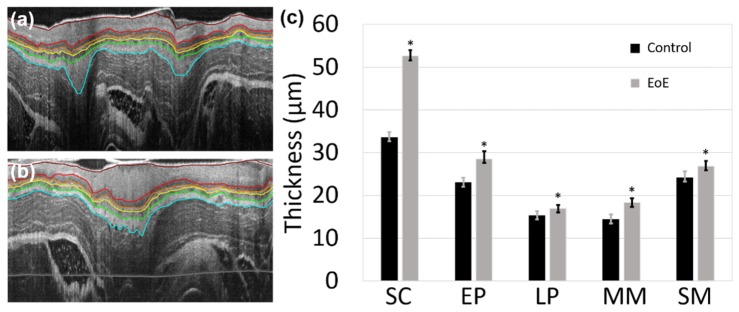
Furthermore, automatic and robust segmentation of OCT images enables an efficient quantitative analysis of the geometric properties of tissues. For example, we can conveniently calculate the average thickness of each layer in terms of optical path length (OPL) for 20 esophagus images acquired from one 10-week old guinea pig, as shown in Table 1. In order to quantitatively validate the accuracy of the proposed method, we recruited two experienced OCT image readers who were blinded to the automatic segmentation results. Both readers manually segmented the same set of 20 OCT images independently using a freeform (drawing) method implemented in MATLAB (The MathWorks Inc.). As shown in Table 1, we found that the automatic method provided similar results as the two readers. In order to demonstrate the clinical potential, our method was deployed to segment two sets of 20 guinea pig esophagus images, including a control and an EoE model. EoE induction with ovalbumin sensitization and challenge was performed following a well-established protocol [43]. Male guinea pigs (Hilltop, Scottsdale, PA) with the same age and roughly the same weight were used. All animals were handled under protocols approved by the Johns Hopkins University Animal Care and Use Committee (ACUC). Two segmented OCT images of esophagus for a guinea pig control and an EoE model were displayed in Figs. 6 (a) and (b), respectively. As shown in Fig. 6 (c), the layer thicknesses can be quantified by our segmentation method and conveniently compared between the control and the EoE model. Together with in vivo optical stained histology-alike images, we believe that an accurate quantitative analysis would potentially facilitate the study of tissue pathologies and aid clinical diagnosis in real time [44,45].
Table 1. Automatic versus manual segmentation of layer thickness for guinea pig esophagus.
|
Layer (μm, OPL) |
SC | EP | LP | MM | SM |
|---|---|---|---|---|---|
|
Automatic Thickness |
33.3 ± 1.1 | 23.1 ± 1.1 | 15.4 ± 0.9 | 14.5 ± 0.9 | 24.3 ± 1.1 |
|
| |||||
|
Manual Thickness Reader 1 Reader 2 |
34.1 ± 1.0 33.0 ± 0.9 |
22.4 ± 1.0 23.5 ± 1.0 |
14.7 ± 0.7 15.0 ± 0.9 |
14.8 ± 1.1 14.1 ± 1.0 |
24.6 ± 1.2 24.0 ± 1.1 |
Fig. 6.
Two representative OCT images of guinea pig esophagus segmented with our method for a control (a) and an EoE model (b). (c) Comparison of the esophageal layer thickness for a guinea pig EoE model and control. SC: stratum corneum; EP: epithelium; LP: lamina propria; MM: muscularis mucosae; SM: submucosa. “*” indicates the thickness difference between the EoE model and control is statistically significant with a P-value less than 1 × 10⁻⁷ for all five layers (based on two-tailed Welch’s t-test, n = 20).
4. Discussions and conclusions
In summary, an automatic segmentation method with high robustness has been proposed and validated for segmenting endoscopic OCT images. By employing an L1-L0 norm minimization based de-noising and smoothing algorithms, our method works well on low-SNR and low-contrast images. By introducing depth-dependent digital attenuation of the image intensity, the tissue surface and other layer boundaries can be accurately and sequentially identified. In addition, accurate segmentation of OCT images of ultrahigh resolution and high SNR enables optical staining of OCT images and facilitates the quantitative analysis of tissue geometric parameters. It is worth mentioning that our method can serve as a generic segmentation method and be conveniently adopted for segmenting other endoscopic OCT images (such as airway and colon) and non-endoscopic OCT images (such as retina). This method can also be potentially used to segment histopathological micrographs for patterns/features extraction and identification.
As one of the limitations, the computational efficiency of current algorithm is suboptimal for real time applications. As a benchmark test, CPU timing was carried out on a personal computer with a Windows 7 operating system, an Intel Core i7 at a base processor frequency of 2.4 GHz and 8GB RAM. Algorithm was implemented in MATLAB. Computational time was measured to be ~6.63 seconds per frame (2048 A-lines/frame and 2048 pixels/A-line). In addition, the current algorithm only segments a predefined number of layers, for example, the first 5 layers of the esophagus tissue in our case. Future work and effort can be concentrated on GPU implementation for improving computational speed and algorithm optimization for adaptive selection of the number of layers for segmentation. It is also worth noting that our current optical staining colormap was mainly used for showing the layers segmented by the reported method. More studies and validations on the color coding methods will be carried out in the near future in order to better reflect the histomorphology of tissues. Furthermore, the MATLAB based source scripts for the reported method are available by emailing request to jhu.bme.bit@gmail.com.
Acknowledgments
We would like to thank Jiefeng Xi and Jessica Mavadia-Shukla for their technical supports in the SD-OCT system. We would also like to acknowledge Xiaoyun Yu for her help in the animal experiments and useful discussions.
Funding
National Institutes of Health (NIH) (HL121788, CA153023); The Wallace H. Coulter Foundation (XDL); Chinese Academy of Sciences (Visiting Fellowship 2013(113)) (JLZ).
References and links
- 1.Huang D., Swanson E. A., Lin C. P., Schuman J. S., Stinson W. G., Chang W., Hee M. R., Flotte T., Gregory K., Puliafito C. A., et, “Optical coherence tomography,” Science 254(5035), 1178–1181 (1991). 10.1126/science.1957169 [DOI] [PMC free article] [PubMed] [Google Scholar]
- 2.Tearney G. J., Brezinski M. E., Bouma B. E., Boppart S. A., Pitris C., Southern J. F., Fujimoto J. G., “In vivo endoscopic optical biopsy with optical coherence tomography,” Science 276(5321), 2037–2039 (1997). 10.1126/science.276.5321.2037 [DOI] [PubMed] [Google Scholar]
- 3.Adler D. C., Zhou C., Tsai T.-H., Schmitt J., Huang Q., Mashimo H., Fujimoto J. G., “Three-dimensional endomicroscopy of the human colon using optical coherence tomography,” Opt. Express 17(2), 784–796 (2009). 10.1364/OE.17.000784 [DOI] [PMC free article] [PubMed] [Google Scholar]
- 4.Liang Y., Yuan W., Mavadia-Shukla J., Li X., “Optical clearing for luminal organ imaging with ultrahigh-resolution optical coherence tomography,” J. Biomed. Opt. 21(8), 081211 (2016). 10.1117/1.JBO.21.8.081211 [DOI] [PMC free article] [PubMed] [Google Scholar]
- 5.Xi J., Huo L., Wu Y., Cobb M. J., Hwang J. H., Li X., “High-resolution OCT balloon imaging catheter with astigmatism correction,” Opt. Lett. 34(13), 1943–1945 (2009). 10.1364/OL.34.001943 [DOI] [PMC free article] [PubMed] [Google Scholar]
- 6.Xi J., Zhang A., Liu Z., Liang W., Lin L. Y., Yu S., Li X., “Diffractive catheter for ultrahigh-resolution spectral-domain volumetric OCT imaging,” Opt. Lett. 39(7), 2016–2019 (2014). 10.1364/OL.39.002016 [DOI] [PMC free article] [PubMed] [Google Scholar]
- 7.Yuan W., Mavadia-Shukla J., Xi J., Liang W., Yu X., Yu S., Li X., “Optimal operational conditions for supercontinuum-based ultrahigh-resolution endoscopic OCT imaging,” Opt. Lett. 41(2), 250–253 (2016). 10.1364/OL.41.000250 [DOI] [PMC free article] [PubMed] [Google Scholar]
- 8.Wessel J. M., Horn F. K., Tornow R. P., Schmid M., Mardin C. Y., Kruse F. E., Juenemann A. G., Laemmer R., “Longitudinal analysis of progression in glaucoma using spectral-domain optical coherence tomography,” Invest. Ophthalmol. Vis. Sci. 54(5), 3613–3620 (2013). 10.1167/iovs.12-9786 [DOI] [PubMed] [Google Scholar]
- 9.Dong Z. M., Wollstein G., Schuman J. S., “Clinical utility of optical coherence tomography in glaucoma,” Invest. Ophthalmol. Vis. Sci. 57(9), OCT556 (2016). 10.1167/iovs.16-19933 [DOI] [PMC free article] [PubMed] [Google Scholar]
- 10.Cabrera Fernández D., Salinas H. M., Puliafito C. A., “Automated detection of retinal layer structures on optical coherence tomography images,” Opt. Express 13(25), 10200–10216 (2005). 10.1364/OPEX.13.010200 [DOI] [PubMed] [Google Scholar]
- 11.Cobb M. J., Chen Y., Underwood R. A., Usui M. L., Olerud J., Li X., “Noninvasive assessment of cutaneous wound healing using ultrahigh-resolution optical coherence tomography,” J. Biomed. Opt. 11(6), 064002 (2006). 10.1117/1.2388152 [DOI] [PubMed] [Google Scholar]
- 12.Bagci A. M., Shahidi M., Ansari R., Blair M., Blair N. P., Zelkha R., “Thickness profiles of retinal layers by optical coherence tomography image segmentation,” Am. J. Ophthalmol. 146(5), 679–687 (2008). 10.1016/j.ajo.2008.06.010 [DOI] [PMC free article] [PubMed] [Google Scholar]
- 13.Zawadzki R. J., Fuller A. R., Wiley D. F., Hamann B., Choi S. S., Werner J. S., “Adaptation of a support vector machine algorithm for segmentation and visualization of retinal structures in volumetric optical coherence tomography data sets,” J. Biomed. Opt. 12(4), 041206 (2007). 10.1117/1.2772658 [DOI] [PMC free article] [PubMed] [Google Scholar]
- 14.Gan Y., Tsay D., Amir S. B., Marboe C. C., Hendon C. P., “Automated classification of optical coherence tomography images of human atrial tissue,” J. Biomed. Opt. 21(10), 101407 (2016). 10.1117/1.JBO.21.10.101407 [DOI] [PMC free article] [PubMed] [Google Scholar]
- 15.Fabritius T., Makita S., Miura M., Myllylä R., Yasuno Y., “Automated segmentation of the macula by optical coherence tomography,” Opt. Express 17(18), 15659–15669 (2009). 10.1364/OE.17.015659 [DOI] [PubMed] [Google Scholar]
- 16.Garvin M. K., Abràmoff M. D., Kardon R., Russell S. R., Wu X., Sonka M., “Intraretinal layer segmentation of macular optical coherence tomography images using optimal 3-D graph search,” IEEE Trans. Med. Imaging 27(10), 1495–1505 (2008). 10.1109/TMI.2008.923966 [DOI] [PMC free article] [PubMed] [Google Scholar]
- 17.Haeker M., Sonka M., Kardon R., Shah V. A., Wu X., Abràmoff M. D., “Automated segmentation of intraretinal layers from macular optical coherence tomography images,” in Medical Imaging, (International Society for Optics and Photonics, 2007), 651214. [Google Scholar]
- 18.Mujat M., Chan R., Cense B., Park B., Joo C., Akkin T., Chen T., de Boer J., “Retinal nerve fiber layer thickness map determined from optical coherence tomography images,” Opt. Express 13(23), 9480–9491 (2005). 10.1364/OPEX.13.009480 [DOI] [PubMed] [Google Scholar]
- 19.Mishra A., Wong A., Bizheva K., Clausi D. A., “Intra-retinal layer segmentation in optical coherence tomography images,” Opt. Express 17(26), 23719–23728 (2009). 10.1364/OE.17.023719 [DOI] [PubMed] [Google Scholar]
- 20.Yang Q., Reisman C. A., Chan K., Ramachandran R., Raza A., Hood D. C., “Automated segmentation of outer retinal layers in macular OCT images of patients with retinitis pigmentosa,” Biomed. Opt. Express 2(9), 2493–2503 (2011). 10.1364/BOE.2.002493 [DOI] [PMC free article] [PubMed] [Google Scholar]
- 21.Chiu S. J., Li X. T., Nicholas P., Toth C. A., Izatt J. A., Farsiu S., “Automatic segmentation of seven retinal layers in SDOCT images congruent with expert manual segmentation,” Opt. Express 18(18), 19413–19428 (2010). 10.1364/OE.18.019413 [DOI] [PMC free article] [PubMed] [Google Scholar]
- 22.Chiu S. J., Izatt J. A., O’Connell R. V., Winter K. P., Toth C. A., Farsiu S., “Validated automatic segmentation of AMD pathology including drusen and geographic atrophy in SD-OCT images,” Invest. Ophthalmol. Vis. Sci. 53(1), 53–61 (2012). 10.1167/iovs.11-7640 [DOI] [PubMed] [Google Scholar]
- 23.Chiu S. J., Allingham M. J., Mettu P. S., Cousins S. W., Izatt J. A., Farsiu S., “Kernel regression based segmentation of optical coherence tomography images with diabetic macular edema,” Biomed. Opt. Express 6(4), 1172–1194 (2015). 10.1364/BOE.6.001172 [DOI] [PMC free article] [PubMed] [Google Scholar]
- 24.Keller B., Cunefare D., Grewal D. S., Mahmoud T. H., Izatt J. A., Farsiu S., “Length-adaptive graph search for automatic segmentation of pathological features in optical coherence tomography images,” J. Biomed. Opt. 21(7), 076015 (2016). 10.1117/1.JBO.21.7.076015 [DOI] [PMC free article] [PubMed] [Google Scholar]
- 25.Yoo H., Kang D., Katz A. J., Lauwers G. Y., Nishioka N. S., Yagi Y., Tanpowpong P., Namati J., Bouma B. E., Tearney G. J., “Reflectance confocal microscopy for the diagnosis of eosinophilic esophagitis: a pilot study conducted on biopsy specimens,” Gastrointest. Endosc. 74(5), 992–1000 (2011). 10.1016/j.gie.2011.07.020 [DOI] [PMC free article] [PubMed] [Google Scholar]
- 26.Pfau P. R., Sivak M. V., Jr, Chak A., Kinnard M., Wong R. C., Isenberg G. A., Izatt J. A., Rollins A., Westphal V., “Criteria for the diagnosis of dysplasia by endoscopic optical coherence tomography,” Gastrointest. Endosc. 58(2), 196–202 (2003). 10.1067/mge.2003.344 [DOI] [PubMed] [Google Scholar]
- 27.Gora M. J., Sauk J. S., Carruth R. W., Gallagher K. A., Suter M. J., Nishioka N. S., Kava L. E., Rosenberg M., Bouma B. E., Tearney G. J., “Tethered capsule endomicroscopy enables less invasive imaging of gastrointestinal tract microstructure,” Nat. Med. 19(2), 238–240 (2013). 10.1038/nm.3052 [DOI] [PMC free article] [PubMed] [Google Scholar]
- 28.Rudin L. I., Osher S., Fatemi E., “Nonlinear total variation based noise removal algorithms,” Physica D 60(1-4), 259–268 (1992). 10.1016/0167-2789(92)90242-F [DOI] [Google Scholar]
- 29.Xu L., Lu C., Xu Y., Jia J., “Image smoothing via L0 gradient minimization,” in ACM Transactions on Graphics (TOG), (ACM, 2011), 174. [Google Scholar]
- 30.Gonzalez R. C., Woods R. E., “Digital Image Processing,” (Prentice Hall, 2002). [Google Scholar]
- 31.Vese L. A., Osher S. J., “Modeling textures with total variation minimization and oscillating patterns in image processing,” J. Sci. Comput. 19(1/3), 553–572 (2003). 10.1023/A:1025384832106 [DOI] [Google Scholar]
- 32.DiBenedetto E., Real Analysis (Springer Science & Business Media, 2012). [Google Scholar]
- 33.Boyd S., Vandenberghe L., Convex Optimization (Cambridge University Press, 2004). [Google Scholar]
- 34.Beck A., Teboulle M., “A fast iterative shrinkage-thresholding algorithm for linear inverse problems,” SIAM J. Imaging Sci. 2(1), 183–202 (2009). 10.1137/080716542 [DOI] [Google Scholar]
- 35.Sonka M., Hlavac V., Boyle R., Image Processing, Analysis, and Machine Vision (Cengage Learning, 2014). [Google Scholar]
- 36.Dijkstra E. W., “A note on two problems in connexion with graphs,” Numer. Math. 1(1), 269–271 (1959). 10.1007/BF01386390 [DOI] [Google Scholar]
- 37.Bellman R., “On a routing problem,” Q. Appl. Math. 16(1), 87–90 (1958). 10.1090/qam/102435 [DOI] [Google Scholar]
- 38.Ford L. R., Jr., Fulkerson D. R., Flows in Networks (Princeton University Press, 2015). [Google Scholar]
- 39.Boykov Y., Veksler O., Zabih R., “Fast approximate energy minimization via graph cuts,” IEEE T. Pattern Anal. 23(11), 1222–1239 (2001). 10.1109/34.969114 [DOI] [Google Scholar]
- 40.Wang Z., Chamie D., Bezerra H. G., Yamamoto H., Kanovsky J., Wilson D. L., Costa M. A., Rollins A. M., “Volumetric quantification of fibrous caps using intravascular optical coherence tomography,” Biomed. Opt. Express 3(6), 1413–1426 (2012). 10.1364/BOE.3.001413 [DOI] [PMC free article] [PubMed] [Google Scholar]
- 41.Thrane L., Frosz M. H., Jørgensen T. M., Tycho A., Yura H. T., Andersen P. E., “Extraction of optical scattering parameters and attenuation compensation in optical coherence tomography images of multilayered tissue structures,” Opt. Lett. 29(14), 1641–1643 (2004). 10.1364/OL.29.001641 [DOI] [PubMed] [Google Scholar]
- 42.Yang Q., Reisman C. A., Wang Z., Fukuma Y., Hangai M., Yoshimura N., Tomidokoro A., Araie M., Raza A. S., Hood D. C., Chan K., “Automated layer segmentation of macular OCT images using dual-scale gradient information,” Opt. Express 18(20), 21293–21307 (2010). 10.1364/OE.18.021293 [DOI] [PMC free article] [PubMed] [Google Scholar]
- 43.Liu Z., Hu Y., Yu X., Xi J., Fan X., Tse C.-M., Myers A. C., Pasricha P. J., Li X., Yu S., “Allergen challenge sensitizes TRPA1 in vagal sensory neurons and afferent C-fiber subtypes in guinea pig esophagus,” Am. J. Physiol. Gastrointest. Liver Physiol. 308(6), G482–G488 (2015). 10.1152/ajpgi.00374.2014 [DOI] [PMC free article] [PubMed] [Google Scholar]
- 44.Baroni M., Fortunato P., La Torre A., “Towards quantitative analysis of retinal features in optical coherence tomography,” Med. Eng. Phys. 29(4), 432–441 (2007). 10.1016/j.medengphy.2006.06.003 [DOI] [PubMed] [Google Scholar]
- 45.Liu Z., Xi J., Tse M., Myers A. C., Li X. D., Pasricha P. J., Yu S., “Allergic inflammation-induced structural and functional changes in esophageal epithelium in a guinea pig model of eosinophilic esophagitis,” Gastroenterology 5(5), 92 (2014). 10.1016/S0016-5085(14)60334-6 [DOI] [Google Scholar]


