Abstract
We demonstrate transcutical structural and functional imaging of neurons labeled with genetically encoded red fluorescent proteins and calcium indicators in the living Drosophila brain with cellular and subcellular resolution.
OCIS codes: (110.1080) Active or adaptive optics, (180.4315) Nonlinear microscopy, (180.2520) Fluorescence microscopy
1. Introduction
Two-photon (2P) microscopy is the leading technique for in vivo optical imaging that is capable of visualizing biological samples with subcellular resolution at larger depths [1, 2]. However, its maximum imaging depth is limited due to refractive aberration, scattering and absorption by the tissue [3]. In order to increase the imaging depth, one can reduce scattering and absorption by selecting long excitation wavelengths in optical windows of low tissue absorption [4, 5]. Refractive aberration increases the focal volume and hence decreases two-photon fluorescence emission. One can use adaptive optics (AO) to correct refractive aberration to increase the imaging depth [6–11]. Three-photon (3P) excitation enables imaging of fluorescent proteins (e.g., mCherry) and neuronal activity sensors (e.g., red calcium indicators) at approximately 3 times the wavelength of their one-photon excitation peaks. The use of longer wavelengths in 3P excitation minimizes tissue scattering and absorption [12]. The third-order nonlinearity in 3P excitation also decreases the out-of-focus background light compared to two-photon (2P) excitation, thereby increasing the imaging depth [12, 13].
Understanding how the action of neurons, synapses, circuits and the interaction between different brain regions underlie brain function and dysfunction is a core challenge for neuroscience. Remarkable advances in brain imaging technologies have been made in the past few decades, opening new avenues for linking neural activity to behavior [12, 14–18]. However, animals from insects to mammals exhibit ever-changing patterns of brain activity in response to the same stimulation, depending on the state of the brain and the body [19, 20]. The action of neuromodulators – biogenic amines, neuropeptides, and hormones – mediates rapid and slow state shifts over a timescale of seconds to minutes or even hours [20]. Thus, there is an urgent need to develop a non-invasive imaging system to maintain an intact neuromodulatory system.
The fruit fly Drosophila melanogaster has, in recent years, become an attractive model organism for studying the neuronal basis of behavior [21], given its genetic tractability [22], sophisticated behavioral repertoire [23], and functional similarities with vertebrate brains [24]. Recent studies demonstrate the importance of neuromodulators in regulating circuit function and behavior. For example, insulin gates olfactory sensory information processing in the periphery through local neuropeptide modulation to regulate food search behavior [25, 26], and a reproductive hormone modulates pheromone sensitivity to regulate courtship motivation [27], and the release of a neuropeptide coordinates food consumption with gut motility [28]. However, most imaging studies in Drosophila require surgical removal of the cuticle to create a window for light penetration [29–31], which may inevitably perturb the neuromodulatory system. Furthermore, many flies do not survive surgery procedures [30] which may also affect the brain state of the surviving flies. A previous study demonstrated that wide-field fluorescence microscopy can be used to monitor neural activity in intact Drosophila through its cuticle [32]. Due to the inherently poor axial resolution of this method, the neurons of interest must be sparsely labeled by genetically encoded activity probes such as GCaMP. Axial resolution can be improved by 2P excitation. Unfortunately, the infrared laser at the wavelengths used for 2P excitation of currently available activity probes is absorbed by the pigmented cuticle, resulting in an increase in the temperature of the fly. Here we demonstrate the ability to monitor neural activity in flies with intact cuticle at cellular and subcellular resolution. The use of 3P excitation provides better axial resolution than wide-field fluorescence microscopy and overcomes the heating problem associated with 2P excitation. We further demonstrate the benefit of AO in transcuticular imaging of the fly brain.
2. Method
2.1 System setup
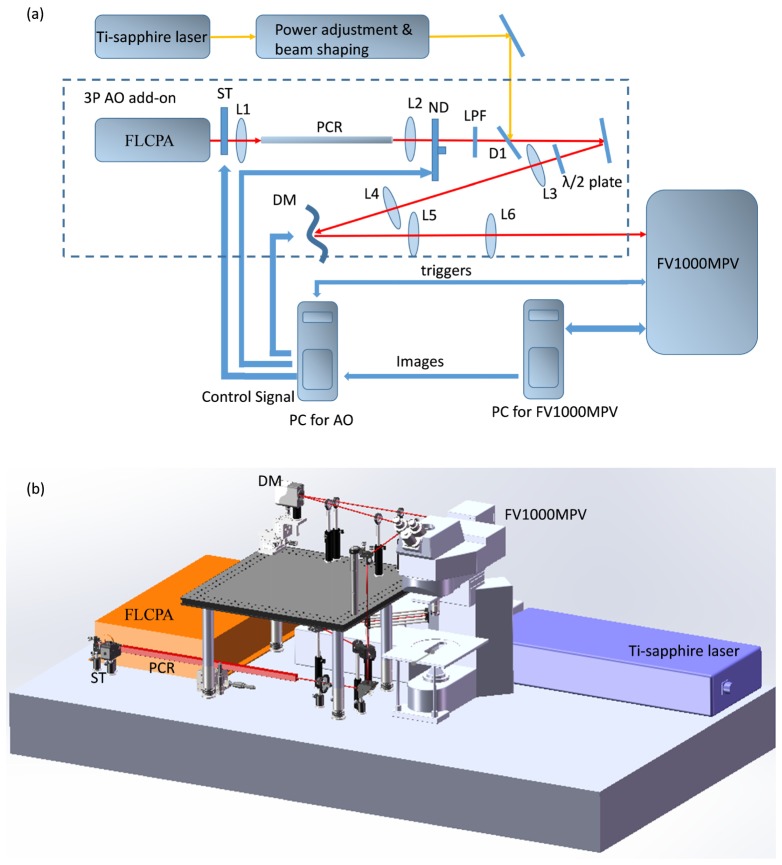
We integrated a 3P-AO add-on system (Fig. 1) into a commercial 2P laser scanning microscope (FV1000MPE, Olympus), so as to take advantage of its user-friendly hardware and software interfaces. The setup retains the option to feed the original tunable Ti:Sapphire laser (Mai Tai DeepSee, Spectra-Physics) for 2P imaging into our AO add-on system through a dichroic mirror (D1, Di02-R1064, Semrock), which provides the ability to conduct simultaneous multiple-excitation multiphoton imaging.
Fig. 1.
(a) System diagram and (b) setup of the 3P-AO add-on. L, lens; DM, deformable mirror; ST, shutter; ND, variable metallic neutral density filter; LPF, long pass filter; D1, dichroic mirror; PCR, photonic crystal rod.
We used a fiber laser-based chirped pulse amplification system (FLCPA) (Cazadero, Calmar) as the 3P excitation light source. The FLCPA delivers up to 900 mW average power at 1550 nm; its repetition rate is tunable from 0.1 MHz to 25 MHz. Although the 1550 nm laser can generate 3P excitation for several fluorescent proteins, thermal damage due to water absorption in the living tissue limits imaging depth and duration. To minimize water absorption, we coupled the laser from the FLCPA into a photonic crystal rod (PCR, NKT Photonics) through the lens L1 (30 mm focal length, Thorlabs) to shift the output wavelength to around 1700 nm by soliton self-frequency shift [12]. Increasing the pulse energy shifts PCR output to longer wavelengths. The PCR confers the additional benefit of pulse compression [12]. The output beam from the PCR is collimated by the lens L2 (100 mm focal length, Thorlabs). The beam intensity can be adjusted with a variable metallic neutral density filter (NDC-50C-2, Thorlabs) installed on a computer-controlled servo. A long-pass filter with cut-on wavelength of 1580 nm (BLP01-1550R-25, Semrock) was used to block the residual pump laser. Second harmonic generation (SHG) and three-photon (3P) fluorescence are detected by channels 2 and 4 of the microscope, respectively. The dichroic mirror with a 570 nm cutoff wavelength in the Olympus filter cube (FV10-MRVGR/XRAC) can separate the emission signals between SHG and mCherry or RCaMP.
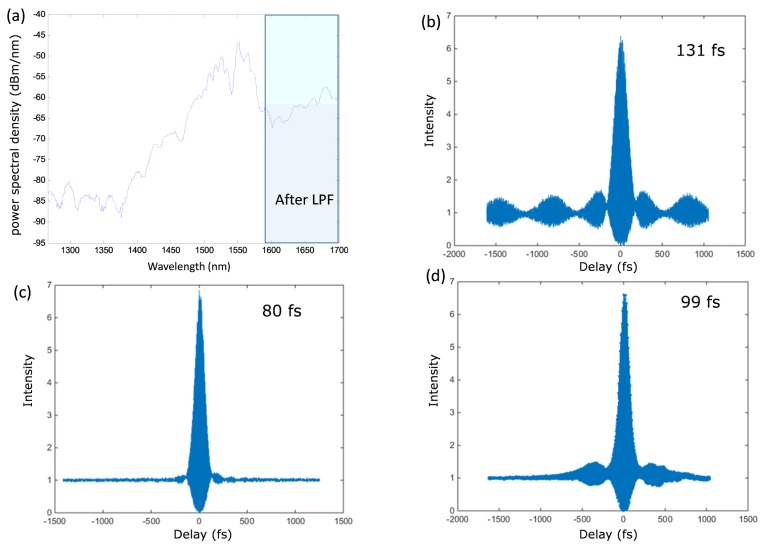
To optimize the wavelength for 3P imaging, we adjusted the pulse energy and the dispersion compensation to maximize signal intensity from fluorescent microspheres with regular water (H2O) as the immersion medium. We measured the spectrum of the PCR output beam with an optical spectrum analyzer (Agilent 86146B), as shown in Fig. 2(a), and the pulse width with a custom-built interferometric autocorrelator (not shown) using a similar design as described in [33]. The setup is based on a Michelson interferometer, where a reference mirror is installed on a nano-stage to scan the pulse separation. A Si detector (818-SL, Newport) in front of an objective lens is used as the nonlinear element to generate second harmonic at the output. A data acquisition card (PCIe-6363, National Instruments) is used to record the signal and generate the autocorrelation trace. The FLCPA repetition rate is set to 2 MHz, which provides 131 fs pulses (Fig. 2(b)), in close agreement with the manufacture’s specification (126 fs pulse width). The pulse width is compressed to 80 fs by the PCR (Fig. 2(c)). After the objective lens the pulse is broadened to 99 fs due to dispersion in the optical system (Fig. 2(d)). We also measured the resolution of the microscope with fluorescent microspheres (diameter = 0.02 μm). The lateral and axial resolution is around 0.8 µm and 3 µm, respectively using the 1700num excitation wavelength.
Fig. 2.
Power spectrum and pulse width measurement of the 3P system. (a) The PCR shifts and broadens the spectrum of the fiber laser. The LPF blocks wavelengths shorter than 1580 nm. (b) Pulse width measured at the output port of the FLCPA, (c) after the PCR, and (d) after the objective lens. All pulse width measurements assume sech2-shaped pulses.
We implemented a sensorless AO scheme in the add-on system. We used a low-order continuous membrane deformable mirror (DM69, ALPAO) as the wavefront corrector. Its 69 actuators with 40 µm stroke can correct most of the low-order refractive aberrations in biological samples. Lenses L3 and L4 resize the incident beam to fit on the deformable mirror (DM). Lenses L5 and L6 conjugate the DM to the scanner in the FV1000MPV microscope frame. Inside the frame, a custom-made dichroic mirror (D2, not shown in Fig. 1) with a cutoff wavelength of 690 nm (Chroma) separates the excitation and emission light. Due to the high polarization dependence of dichroic mirrors, a half-wave plate is installed before the AO system to maximize the excitation power reflected by the dichroic mirror D2. The scanner and the tube lenses of the original Olympus microscope were replaced by lenses with a coating that is optimal around 1700 nm to increase the transmittance of the system. The excitation beam is fed into a 25x water-immersion objective with coating for high transmittance (~75%) around 1600 nm (XLPLN25XWMP2, NA 1.05, Olympus). Overall, the transmittance of the AO add-on is >80%, and the total transmittance of the microscope frame including the objective is around 60%.
The Olympus microscope and the AO add-on system are controlled by two computers. One computer is dedicated to operate the Olympus microscope control and image capturing software (FV10-ASW, Olympus). The other computer is equipped with a data acquisition card (PCIe-6363, National Instruments) to control the AO add-on system. The two computers are connected through an Ethernet cable. A custom software program written in Microsoft Visual C++ 2013 controls the AO system and synchronizes it with the FV1000MPE microscope using trigger signals from the latter.
2.2 System operation
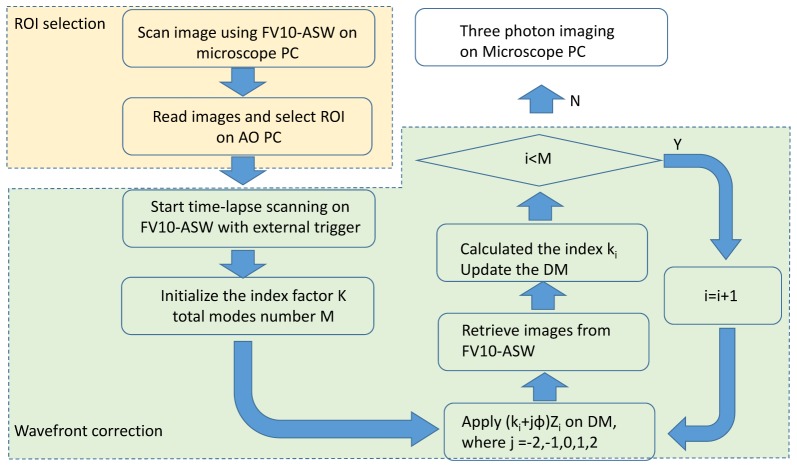
Our 3P-AO add-on uses a simple modal sensorless wavefront correction scheme based on the Zernike modes, similar to the 3N algorithm [34]. In this scheme, phase aberration is represented as a linear combination of Zernike polynomials. Optimization proceeds in two steps: selection of a region-of-interest (ROI), and iterative wavefront correction (Fig. 3). In the ROI selection step, the scanned image is retrieved from the FV10-ASW software (microscope control) into the AO add-on software through the Ethernet connection, and an ROI on the image is selected by the user. A quality metric, defined as the cube root of the average signal intensity in the ROI, is computed. The signal can be either the fluorescence or the third harmonic generation (THG) channel of the image. THG signals can yield more stable results due to the absence of photobleaching. In the wavefront correction step, repeated for every sample, each Zernike mode is corrected sequentially. To increase the stability over a large aberration range, 5N method is applied in the system [34]. For each Zernike mode, five images are taken with the phases displayed on the DM defined as (ki + jφ)Zi, where i indexes the Zernike mode, ki is the index factor of the mode, φ is the search step size, and j indexes the steps from −2 to 2. The quality metrics on the five images are computed and fit with a Gaussian function [34]. Then the phase corresponding to the peak of the quality metric is calculated. Optimization proceeds through all the modes up to order M = 22. Since defocus is coupled with the spherical aberration, additional defocus is applied to compensate for the focal plane shift during the optimization of spherical aberration. Depending on the amplitude of the aberrations, multiple iterations of optimization may be applied. The optimization time is limited by the microscope’s image acquisition software and the file transfer between the two computers. It takes 20 seconds for one iteration. Bypassing the Olympus software could further improve the operation speed. After the final phase is set on the DM, 3P imaging can be performed using the microscope PC. For imaging of a small volume, such as shown in Fig. 8 (118µm × 118µm × 63µm), a single correction is applied for the whole image stack. The corrected volume depends on the isoplanatic patch for specific samples [35]. For larger volume imaging, multiple corrections may be required to achieve a wider correction volume.
Fig. 3.
Flow chart for sensorless wavefront correction.
2.3 Sample preparation
Fluorescent microspheres with 0.02 µm diameter (Invitrogen, 580/605) were used to measure microscope resolution. Fluorescent microspheres with 1.1 µm diameter (Invitrogen, 540/560) were used to test wavefront correction. The microspheres were spread onto a glass slide with mounting medium (Fluoromount-G, Cell Lab) and sealed with a 170 µm cover slip.
Flies were raised on standard fly food at 25°C. For transcutical imaging of brain structures, flies were anesthetized by ice and glued to a coverslip with a dental resin [36]. After curing the resin, the fly’s head was sufficiently constrained to eliminate motion effects in the following measurements. The resin was cured for 30 seconds with a blue LED light source (420-480 nm, 1-2 W/cm2). A drop of heavy water (D2O) was used to immerse the objective lens to minimize heat generation. For structure imaging, several different GAL4 drivers were used to express UAS-mCherry (Bloomington #52267) or UAS-jRCaMP1b (Bloomington #63793) in different neuronal populations: all neurons (syb-GAL4, Bloomington #51941), mushroom body Kenyon cells (OK107-GAL4, Kyoto #106098), olfactory projection neurons (GH146-GAL4, Bloomington #30026), and Or47b olfactory receptor neurons (Or47b-GAL4, Bloomington #9983).
Male flies bearing the OK107-GAL4 and UAS-jRCaMP1b transgenes were used for calcium imaging experiments. Odors were delivered with a custom-built olfactometer described previously [37]. After being anesthetized by cold temperature, the fly was turned upside down and its head was gently pushed into a small drop of resin on a microscope coverglass. Care was taken to avoid covering the antennae with the resin. When the fly was in position that its head and part of the thorax were in contact with the resin, the blue LED light was turned on for 30 second to cure the resin. The coverglass was then rotated and attached to a holder for imaging in the upright 3P microscope. A drop of heavy water was added to the top side of the coverglass. The head of a female fly is usually larger than that of a male. As such, it is possible that brain-cuticle gap is larger in female flies. We noticed that for transcutical imaging of female brains, there was a need to use a small Scotch tape to push the female brain closer to the cuticle (data not shown).
3. Experimental results
3.1 3P-AO imaging of fluorescent microspheres
With 3P excitation, fluorescence emission scales with the cube of excitation intensity. To verify the order of nonlinearity in our system, we measured the fluorescence intensity of microspheres under different excitation power (Fig. 4) at λ = 1550 nm, i.e. without the photonic crystal rod (PCR), which can minimize the crossover between third harmonic generation (516nm) and fluorescence emission (560nm). Fluorescent microspheres with a 1.1 µm diameter (Invitrogen, 540/560) are used here. There was no indication of photobleaching during the fluorescence intensity measurements. Both regular water (H2O) and heavy water (D2O) were tested as immersion medium. A first order polynomial fit for a log-log plot of the data was performed. The results in Fig. 4 verify the third order nonlinearity in the present system. The nonlinearity orders are 3.10 and 3.07 with standard deviation of 0.10 and 0.34 in these two cases. In addition, the same excitation power generated much stronger fluorescence emission when D2O was used instead of H2O as the immersion medium, consistent with the fact that D2O absorbs much less laser light at λ = 1550 nm than H2O [12,13,38].
Fig. 4.
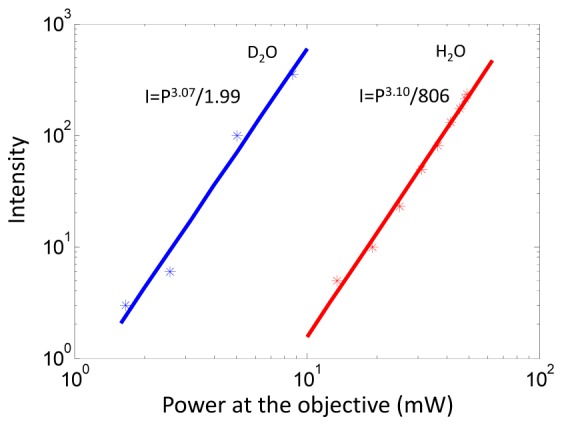
Logarithmic plots of intensity and excitation power at the objective indicating three-photon excitation. A first order polynomial fit is applied to a log-log plot of the data, as shown by the solid curves. The results for using heavy water (D2O) and regular water (H2O) as the immersion medium are indicted by blue and red data points, respectively.
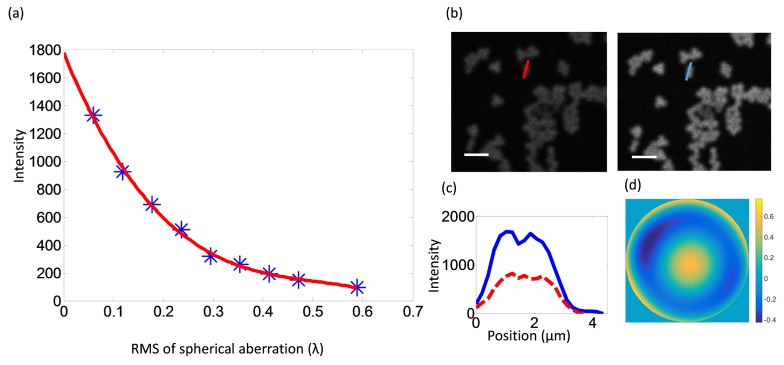
Refractive aberrations affect 3P imaging more severely than 1P or 2P imaging due to the higher order non-linearity [10]. In order to characterize the aberration-induced signal loss, we used the DM to introduce primary spherical aberrations with different amplitudes, and measured the intensity of fluorescence emitted by microspheres. We found a cubic decay with the root mean square (RMS) of the wavefront (Fig. 5(a)). To test the correction ability of the AO system, we then introduced spherical aberration by adjusting the correction collar on the objective lens and corrected it with the DM. The RMS wavefront error due to the collar adjustment was around 0.15λ, which reduced the signal intensity (Fig. 5(b), left panel). The RMS wavefront error is estimated by the final shape of the pre-calibrated DM after optimization. If this error is fully corrected by AO, the signal intensity should be improved by more than two-fold as predicted by the scaling relationship shown in Fig. 5(a). Indeed, AO correction restored the wavefront (Fig. 5(d)) and markedly improved the signal to noise ratio as expected (Fig. 5(b)-5(c)). The excitation wavelength used in this experiment is 1700nm.
Fig. 5.
3P-AO imaging of fluorescent microspheres. (a) Fluorescence intensity decreases as spherical aberration increases. Red line: cubic curve fitting. (b) Images of microspheres before and after AO correction, where the aberration was introduced by adjusting the correction collar of the objective lens. (c) The intensity profiles along the lines in (b). (d) The final phase on the DM. Scale bar, 5 µm.
3.2 3P imaging of the live Drosophila brain
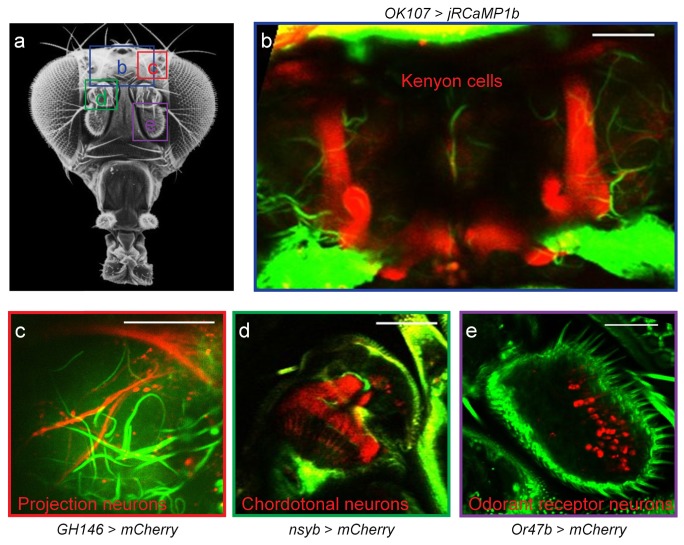
For the typical laser wavelengths useful for multiphoton imaging, longer wavelengths have better penetration through the fly cuticle than shorter wavelengths [39]. Practically, there are only two types of genetically expressed calcium sensors for measuring neural activity, with GCaMP having peak excitation at 485 nm (one-photon excitation) [40] and RCaMP at 580 nm [41]. The wavelength of 1700 nm for three-photon excitation of RCaMP should have markedly better penetration through the fly cuticle than 1100 nm used in two-photon excitation, we therefore decided to test three-photon imaging of brain structure and function in flies with intact cuticle and without surgery (Fig. 6(a)). Indeed, we were able to visualize the entire mushroom body (MB) structure, a higher brain center that processes olfactory information. The vertical and horizontal lobes as well as the peduncle were all clearly identifiable in flies expressing jRCaMP1b by the OK107 driver (Fig. 6(b)). We then tested whether finer neuronal structures could be seen with our three-photon microscope using a variety of different driver lines to express mCherry, a probe of similar excitation and emission properties as RCaMP. Axon terminals of second-order olfactory neurons could be resolved (Fig. 6(c)), the ciliated endings of the auditory chordotonal neurons were clearly visible (Fig. 6(d)) and individual cell bodies of the odorant receptor neurons could be counted (Fig. 6(e)). These results demonstrate that three-photon microscopy is able to resolve fly brain structure at cellular resolution to visualize axons, dendrites and cell bodies through the intact cuticle.
Fig. 6.
Transcutical imaging of Drosophila brain structures. (a) External view of a fly head. Image source: www.sdbonline.org. The four boxes denote imaging regions. The viewing angle may be slightly different for each region. (b) Mushroom body Kenyon cells of a fly bearing the OK107-GAL4 and UAS-jRCaMP1b transgenes. (c) Axon terminals of second-order projection neurons in the lateral horn region. Transgenes: GH146-GAL4 and UAS-mCherry. (e) Cell bodies of the Or47b odorant receptor neurons. Transgenes: Or47b-GAL4 and UAS-mCherry. (b-e) Red color: fluorescence signals from the labeled neurons. Green color: third harmonic signal. Scale bar, 50 µm.
We next tested whether odor-evoked calcium activity could be detected with three-photon microscopy. We used the OK107 driver line to express a red calcium sensor, jRCaMP1b, in MB Kenyon cells. We glued the head of a male fly to a microscope cover glass with a water-immersion objective on top and an odor delivery system underneath (Fig. 7(a)). Images from the third-harmonic signal revealed that adipose tissues and connective tissues are immediately below the surface, and trachea in the brain (Fig. 7(b), left panels). In the fluorescence channel, the tip of the vertical lobes was first seen at a focal plane 21 µm below the surface. At about 70 µm, the MB horizontal lobes and the peduncle were observed (Fig. 7(b), right panels). In response to isoamyl acetate, the entire MB exhibited robust calcium activity with average peak ΔF/F reaching 80% (Fig. 7(c)-7(d)). We noticed that for imaging female brains, it was necessary to bring the brain closer to the cuticle by using a Scotch tape (data not shown). This may be due to the larger brain-cuticle gap in female flies. Nevertheless, these results indicate that three-photon microscopy at 1700 nm excitation has the capability to monitor olfactory response in intact live flies through cuticle.
Fig. 7.
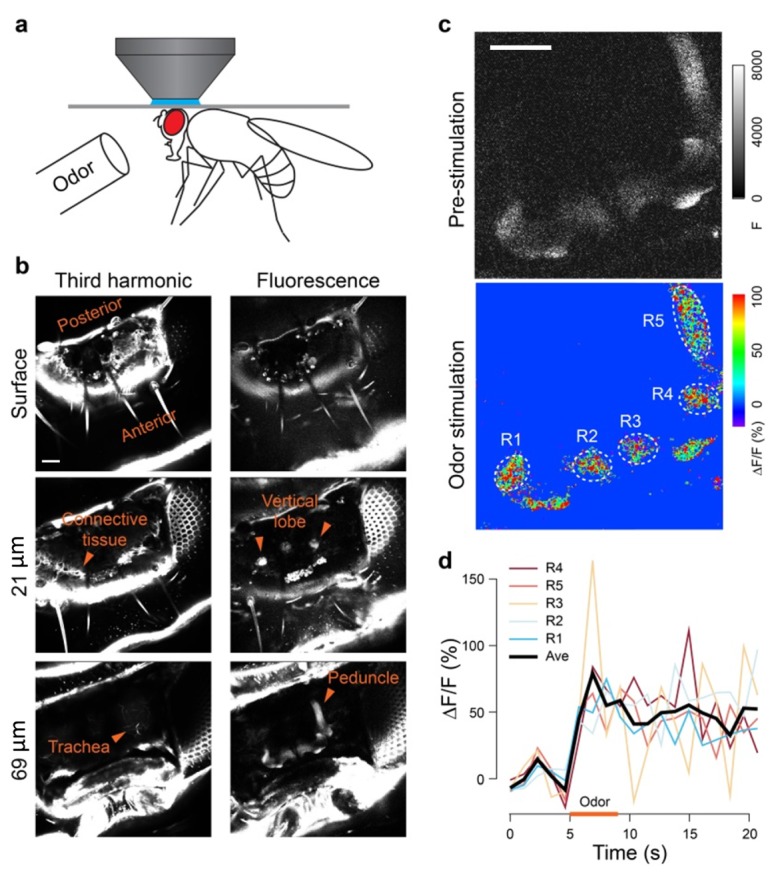
Odor-evoked activity in the fly mushroom body. (a) A fly is glued to a cover glass with light curable resin. (b) Fluorescence and third-harmonic signals at different depths from the fly cuticle. (c) Peak olfactory response of the fly mushroom body. Pseudocolor images show ∆F/F measurement. (d) ∆F/F is plotted against time. Odor: isoamyl acetate at 5% saturated vapor pressure. Fly: OK107-GAL4, UAS-jRCaMP1b. Scale bar, 50 µm.
3.3 3P imaging of live Drosophila brain with wavefront correction
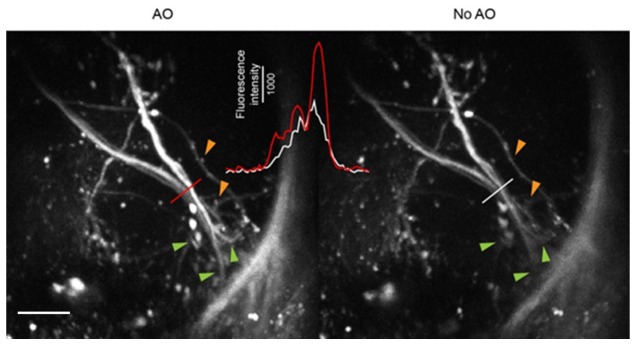
For transcuticle imaging of the fly brain, the excitation laser light has to go through the cuticle, adipose and connective tissues (Fig. 7(b)), therefore aberration may enlarge the focal volume at the structure of interest. We therefore evaluated whether adaptive optics (AO) would allow us to gain better images of neuronal structure. In a higher olfactory center named the lateral horn, projection neurons have presynaptic axonal terminals as small as 1-2 µm [42]. Indeed, AO revealed some small presynaptic boutons that were not visible without using adaptive optics (Fig. 8). Furthermore, the overall fluorescence intensity and contrast were both increased by AO. These results show that adaptive optics will be essential to visualize small neuronal structures in the fly brain and demonstrate that three-photon microscopy, coupled with adaptive optics for aberration correction, has the ability to monitor odor-evoked neural activity in the fly brain.
Fig. 8.
Adaptive optics reveals fine neuronal structures. Axon terminals of the second-order olfactory projection neurons in the lateral horn regions are shown in a fly carrying the GH146-GAL4 and UAS-mCherry transgenes. Line profiles were plotted in the inset. Orange arrowheads: boutons of the projection neurons. Green arrowheads: branches of the projection neurons. Scale bar, 20 µm.
4. Conclusion and discussion
Multi-photon imaging has become indispensable for neurobiology. However, the imaging depth of standard in vivo 2P microscopy is limited by aberration, scattering and absorption, which largely restricts its application for transcutical imaging. Three-photon fluorescence imaging has attracted much research interest because it has the potential to achieve greater imaging depth due to less scattering and absorption of the longer wavelength laser, and better signal-to-background ratio due to higher order nonlinearity. Indeed, a previous study has demonstrated in vivo hippocampal imaging with cellular resolution [12]. However, refractive aberration increases with greater imaging depth. Adaptive optics, which was originally developed for astronomical imaging [43], provides a promising approach to overcome this problem. Previously AO has been successfully applied to widefield, confocal, and 2P fluorescence microscopy both in vitro and in vivo [44–46]. Thus a combination of the two techniques holds the potential to increase imaging depth and quality even further.
In order to apply AO to 3P imaging, we used a low-order DM as the wavefront corrector, and adopted an image-based optimization procedure. Recently, another research group used a micro-electro-mechanical (MEMS) SLM to maximize local 3P fluorescence signal of neurons and blood vessels in a feedback-based optimization scheme [10]. They demonstrated up to 4x increase in relative intensity within a few seconds. However, in this scheme the wavefront correction is effective only within a sample-dependent, isoplanatic region, as the beam was parked over a certain spot. The image-based approach, on the other hand, can correct a wider area by correcting an average of the aberrations within the region of interest, at the cost of lower speed because multiple images must be acquired. Zonal-based wavefront correction methods have been successfully applied to 2P microscopy [7], but they require high signal levels (hence high power) for optimization, and thus may be impractical for in vivo 3P imaging at greater depth. In comparison, the modal-based wavefront correction method is less demanding on signal intensity.
Our DM approach also benefits the power efficiency of the optical system. Compared with the segmented SLM, the DM’s silver-coated continuous surface gives minimal diffraction losses and higher fill-factor. The DM also has higher reflectivity than a liquid crystal SLM. Finally, the low-order DM is much less costly than the high-order segmented MEMS SLM.
In conclusion, we have developed a 3P-AO add-on system on a commercial laser scanning microscope that is equipped with a Ti:Sapphire laser for 2P imaging up to 1060 nm. We added a 1550 nm femtosecond fiber laser chirped pulse amplification system and a photonic bandgap crystal that shifts the wavelength up to 1700 nm for 3P microscopy. The maximum average power and the pulse width after the objective lens of the microscope were measured to be ~100 mW and ~100 fs, respectively. Using this system we have demonstrated 3P structural imaging of labeled neurons in live fly brains, and showed that AO improved the fluorescence intensity and resolution when imaging through the fly cuticle. Small presynaptic boutons were resolved using adaptive optics. We have also demonstrated transcutical functional imaging of neurons labeled with the genetically encoded red calcium indicator jRCaMP1b in live flies. Overall, we have demonstrated the feasibility of in vivo structural and functional imaging in the fly brain with our add-on system, which will help disseminate the use of 3P and AO for biological imaging.
Acknowledgments
We would like to thank Dr. Benjamin Abrams (UCSC Life Sciences Microscopy Center) for technical support; David Kleinfeld, Marc R. Reinig, Qinggele Li, and Samuel W. Novak for helpful discussions.
Funding
This material is based upon work supported by the National Science Foundation under Grant Number 1429810. The multiphoton microscope that was modified was provided by the California Institute for Regenerative Medicine (CIRM) Shared Stem Cell Facility under Grant Number CL1-00506-1.1. The results presented herein were obtained at the W.M. Keck Center for Adaptive Optical Microscopy (CfAOM) at University of California Santa Cruz. The CfAOM was made possible by the generous financial support of the W.M. Keck Foundation. This material is also based upon work supported by the UC Office of the President for the UC Work Group for Adaptive Optics in Biological Imaging, by the Multicampus Research Programs and Initiatives (MRPI), Grant #MR-15-327968. This work was partially supported by an NIH grant (R01DC009597) to J.W.W.
References and links
- 1.Helmchen F., Denk W., “Deep tissue two-photon microscopy,” Nat. Methods 2(12), 932–940 (2005). 10.1038/nmeth818 [DOI] [PubMed] [Google Scholar]
- 2.Svoboda K., Yasuda R., “Principles of two-photon excitation microscopy and its applications to neuroscience,” Neuron 50(6), 823–839 (2006). 10.1016/j.neuron.2006.05.019 [DOI] [PubMed] [Google Scholar]
- 3.Theer P., Hasan M. T., Denk W., “Two-photon imaging to a depth of 1000 microm in living brains by use of a Ti:Al2O3 regenerative amplifier,” Opt. Lett. 28(12), 1022–1024 (2003). 10.1364/OL.28.001022 [DOI] [PubMed] [Google Scholar]
- 4.Kobat D., Durst M. E., Nishimura N., Wong A. W., Schaffer C. B., Xu C., “Deep tissue multiphoton microscopy using longer wavelength excitation,” Opt. Express 17(16), 13354–13364 (2009). 10.1364/OE.17.013354 [DOI] [PubMed] [Google Scholar]
- 5.Shi L., Sordillo L. A., Rodríguez-Contreras A., Alfano R., “Transmission in near-infrared optical windows for deep brain imaging,” J. Biophotonics 9(1-2), 38–43 (2016). 10.1002/jbio.201500192 [DOI] [PMC free article] [PubMed] [Google Scholar]
- 6.Débarre D., Botcherby E. J., Watanabe T., Srinivas S., Booth M. J., Wilson T., “Image-based adaptive optics for two-photon microscopy,” Opt. Lett. 34(16), 2495–2497 (2009). 10.1364/OL.34.002495 [DOI] [PMC free article] [PubMed] [Google Scholar]
- 7.Ji N., Milkie D. E., Betzig E., “Adaptive optics via pupil segmentation for high-resolution imaging in biological tissues,” Nat. Methods 7(2), 141–147 (2010). 10.1038/nmeth.1411 [DOI] [PubMed] [Google Scholar]
- 8.Tang J., Germain R. N., Cui M., “Superpenetration optical microscopy by iterative multiphoton adaptive compensation technique,” Proc. Natl. Acad. Sci. U.S.A. 109(22), 8434–8439 (2012). 10.1073/pnas.1119590109 [DOI] [PMC free article] [PubMed] [Google Scholar]
- 9.Tao X., Norton A., Kissel M., Azucena O., Kubby J., “Adaptive optical two-photon microscopy using autofluorescent guide stars,” Opt. Lett. 38(23), 5075–5078 (2013). 10.1364/OL.38.005075 [DOI] [PubMed] [Google Scholar]
- 10.Sinefeld D., Paudel H. P., Ouzounov D. G., Bifano T. G., Xu C., “Adaptive optics in multiphoton microscopy: comparison of two, three and four photon fluorescence,” Opt. Express 23(24), 31472–31483 (2015). 10.1364/OE.23.031472 [DOI] [PMC free article] [PubMed] [Google Scholar]
- 11.Wang K., Sun W., Richie C. T., Harvey B. K., Betzig E., Ji N., “Direct wavefront sensing for high-resolution in vivo imaging in scattering tissue,” Nat. Commun. 6, 7276 (2015). 10.1038/ncomms8276 [DOI] [PMC free article] [PubMed] [Google Scholar]
- 12.Horton N. G., Wang K., Kobat D., Clark C. G., Wise F. W., Schaffer C. B., Xu C., “In vivo three-photon microscopy of subcortical structures within an intact mouse brain,” Nat. Photonics 7(3), 205–209 (2013). 10.1038/nphoton.2012.336 [DOI] [PMC free article] [PubMed] [Google Scholar]
- 13.Wang K., Horton N. G., Charan K., Xu C., “Advanced Fiber Soliton Sources for Nonlinear Deep Tissue Imaging in Biophotonics,” IEEE J. Sel. Top. Quantum Electron. 20(2), 50–60 (2014). 10.1109/JSTQE.2013.2276860 [DOI] [Google Scholar]
- 14.Suh G. S., Wong A. M., Hergarden A. C., Wang J. W., Simon A. F., Benzer S., Axel R., Anderson D. J., “A single population of olfactory sensory neurons mediates an innate avoidance behaviour in Drosophila,” Nature 431(7010), 854–859 (2004). 10.1038/nature02980 [DOI] [PubMed] [Google Scholar]
- 15.Denk W., Strickler J. H., Webb W. W., “Two-photon laser scanning fluorescence microscopy,” Science 248(4951), 73–76 (1990). 10.1126/science.2321027 [DOI] [PubMed] [Google Scholar]
- 16.Nakai J., Ohkura M., Imoto K., “A high signal-to-noise Ca(2+) probe composed of a single green fluorescent protein,” Nat. Biotechnol. 19(2), 137–141 (2001). 10.1038/84397 [DOI] [PubMed] [Google Scholar]
- 17.Chen T. W., Wardill T. J., Sun Y., Pulver S. R., Renninger S. L., Baohan A., Schreiter E. R., Kerr R. A., Orger M. B., Jayaraman V., Looger L. L., Svoboda K., Kim D. S., “Ultrasensitive fluorescent proteins for imaging neuronal activity,” Nature 499(7458), 295–300 (2013). 10.1038/nature12354 [DOI] [PMC free article] [PubMed] [Google Scholar]
- 18.Wang J. W., Wong A. M., Flores J., Vosshall L. B., Axel R., “Two-photon calcium imaging reveals an odor-evoked map of activity in the fly brain,” Cell 112(2), 271–282 (2003). 10.1016/S0092-8674(03)00004-7 [DOI] [PubMed] [Google Scholar]
- 19.McGinley M. J., Vinck M., Reimer J., Batista-Brito R., Zagha E., Cadwell C. R., Tolias A. S., Cardin J. A., McCormick D. A., “Waking State: Rapid Variations Modulate Neural and Behavioral Responses,” Neuron 87(6), 1143–1161 (2015). 10.1016/j.neuron.2015.09.012 [DOI] [PMC free article] [PubMed] [Google Scholar]
- 20.Bargmann C. I., Marder E., “From the connectome to brain function,” Nat. Methods 10(6), 483–490 (2013). 10.1038/nmeth.2451 [DOI] [PubMed] [Google Scholar]
- 21.Su C. Y., Wang J. W., “Modulation of neural circuits: How stimulus context shapes innate behavior in Drosophila,” Curr. Opin. Neurobiol. 29, 9–16 (2014). 10.1016/j.conb.2014.04.008 [DOI] [PMC free article] [PubMed] [Google Scholar]
- 22.Venken K. J. T., Simpson J. H., Bellen H. J., “Genetic manipulation of genes and cells in the nervous system of the fruit fly,” Neuron 72(2), 202–230 (2011). 10.1016/j.neuron.2011.09.021 [DOI] [PMC free article] [PubMed] [Google Scholar]
- 23.Sokolowski M. B., “Drosophila: Genetics meets behaviour,” Nat. Rev. Genet. 2(11), 879–890 (2001). 10.1038/35098592 [DOI] [PubMed] [Google Scholar]
- 24.Strausfeld N. J., Hirth F., “Deep Homology of Arthropod Central Complex and Vertebrate Basal Ganglia,” Science 340(6129), 157–161 (2013). 10.1126/science.1231828 [DOI] [PubMed] [Google Scholar]
- 25.Ko K. I., Root C. M., Lindsay S. A., Zaninovich O. A., Shepherd A. K., Wasserman S. A., Kim S. M., Wang J. W., “Starvation promotes concerted modulation of appetitive olfactory behavior via parallel neuromodulatory circuits,” eLife 4, 1–17 (2015). 10.7554/eLife.08298 [DOI] [PMC free article] [PubMed] [Google Scholar]
- 26.Root C. M., Ko K. I., Jafari A., Wang J. W., “Presynaptic facilitation by neuropeptide signaling mediates odor-driven food search,” Cell 145(1), 133–144 (2011). 10.1016/j.cell.2011.02.008 [DOI] [PMC free article] [PubMed] [Google Scholar]
- 27.Lin H.-H., Cao D.-S., Sethi S., Zeng Z., Chin J. S. R., Chakraborty T. S., Shepherd A. K., Nguyen C. A., Yew J. Y., Su C.-Y., Wang J. W., “Hormonal Modulation of Pheromone Detection Enhances Male Courtship Success,” Neuron 90(6), 1272–1285 (2016). 10.1016/j.neuron.2016.05.004 [DOI] [PMC free article] [PubMed] [Google Scholar]
- 28.Dus M., Lai J. S., Gunapala K. M., Min S., Tayler T. D., Hergarden A. C., Geraud E., Joseph C. M., Suh G. S., “Nutrient sensor in the brain directs the action of the brain-gut axis in Drosophila,” Neuron 87(1), 139–151 (2015). 10.1016/j.neuron.2015.05.032 [DOI] [PMC free article] [PubMed] [Google Scholar]
- 29.Cohn R., Morantte I., Ruta V., “Coordinated and Compartmentalized Neuromodulation Shapes Sensory Processing in Drosophila,” Cell 163(7), 1742–1755 (2015). 10.1016/j.cell.2015.11.019 [DOI] [PMC free article] [PubMed] [Google Scholar]
- 30.Grover D., Katsuki T., Greenspan R. J., “Flyception: imaging brain activity in freely walking fruit flies,” Nat. Methods 13(7), 569–572 (2016). 10.1038/nmeth.3866 [DOI] [PubMed] [Google Scholar]
- 31.Seelig J. D., Jayaraman V., “Feature detection and orientation tuning in the Drosophila central complex,” Nature 503(7475), 262–266 (2013). [DOI] [PMC free article] [PubMed] [Google Scholar]
- 32.Kamikouchi A., Wiek R., Effertz T., Göpfert M. C., Fiala A., “Transcuticular optical imaging of stimulus-evoked neural activities in the Drosophila peripheral nervous system,” Nat. Protoc. 5(7), 1229–1235 (2010). 10.1038/nprot.2010.85 [DOI] [PubMed] [Google Scholar]
- 33.Horton N. G., Xu C., “Dispersion compensation in three-photon fluorescence microscopy at 1,700 nm,” Biomed. Opt. Express 6(4), 1392–1397 (2015). 10.1364/BOE.6.001392 [DOI] [PMC free article] [PubMed] [Google Scholar]
- 34.Facomprez A., Beaurepaire E., Débarre D., “Accuracy of correction in modal sensorless adaptive optics,” Opt. Express 20(3), 2598–2612 (2012). 10.1364/OE.20.002598 [DOI] [PubMed] [Google Scholar]
- 35.Azucena O., Crest J., Cao J., Sullivan W., Kner P., Gavel D., Dillon D., Olivier S., Kubby J., “Wavefront aberration measurements and corrections through thick tissue using fluorescent microsphere reference beacons,” Opt. Express 18(16), 17521–17532 (2010). 10.1364/OE.18.017521 [DOI] [PMC free article] [PubMed] [Google Scholar]
- 36.Kay A. R., Raccuglia D., Scholte J., Sivan-Loukianova E., Barwacz C. A., Armstrong S. R., Guymon C. A., Nitabach M. N., Eberl D. F., “Goggatomy: A Method for Opening Small Cuticular Compartments in Arthropods for Physiological Experiments,” Front. Physiol. 7, 398 (2016). 10.3389/fphys.2016.00398 [DOI] [PMC free article] [PubMed] [Google Scholar]
- 37.Kim S. M., Wang J. W., “Calcium Imaging of Pheromone Responses in the Insect Antennal Lobe,” Methods Mol. Biol. 1068, 179–187 (2013). 10.1007/978-1-62703-619-1_12 [DOI] [PMC free article] [PubMed] [Google Scholar]
- 38.Wang Y., Wen W., Wang K., Zhai P., Qiu P., Wang K., “Measurement of absorption spectrum of deuterium oxide (D2O) and its application to signal enhancement in multiphoton microscopy at the 1700-nm window,” Appl. Phys. Lett. 108(2), 021112 (2016). 10.1063/1.4939970 [DOI] [Google Scholar]
- 39.Hsiao P.-Y., Tsai C.-L., Chen M.-C., Lin Y.-Y., Yang S.-D., Chiang A.-S., “Non-invasive manipulation of Drosophila behavior by two-photon excited red-activatable channelrhodopsin,” Biomed. Opt. Express 6(11), 4344–4352 (2015). 10.1364/BOE.6.004344 [DOI] [PMC free article] [PubMed] [Google Scholar]
- 40.Chen T.-W., Wardill T. J., Sun Y., Pulver S. R., Renninger S. L., Baohan A., Schreiter E. R., Kerr R. A., Orger M. B., Jayaraman V., Looger L. L., Svoboda K., Kim D. S., “Ultrasensitive fluorescent proteins for imaging neuronal activity,” Nature 499(7458), 295–300 (2013). 10.1038/nature12354 [DOI] [PMC free article] [PubMed] [Google Scholar]
- 41.Dana H., Mohar B., Sun Y., Narayan S., Gordus A., Hasseman J. P., Tsegaye G., Holt G. T., Hu A., Walpita D., Patel R., Macklin J. J., Bargmann C. I., Ahrens M. B., Schreiter E. R., Jayaraman V., Looger L. L., Svoboda K., Kim D. S., “Sensitive red protein calcium indicators for imaging neural activity,” eLife 5, 1–24 (2016). 10.7554/eLife.12727 [DOI] [PMC free article] [PubMed] [Google Scholar]
- 42.Yasuyama K., Meinertzhagen I. A., Schuermann F. W., “Synaptic connections of cholinergic antennal lobe relay neurons in the brain of Drosophila melanogaster,” J. Comp. Neurol. 466, 299–315 (2003). 10.1002/cne.10867 [DOI] [PubMed] [Google Scholar]
- 43.Hardy J. W., Adaptive Optics for Astronomical Telescopes (Oxford University Press, 1998). [Google Scholar]
- 44.Marsh P., Burns D., Girkin J., “Practical implementation of adaptive optics in multiphoton microscopy,” Opt. Express 11(10), 1123–1130 (2003). 10.1364/OE.11.001123 [DOI] [PubMed] [Google Scholar]
- 45.Booth M. J., “Adaptive optics in microscopy,” Philos Trans A Math Phys Eng Sci 365(1861), 2829–2843 (2007). 10.1098/rsta.2007.0013 [DOI] [PubMed] [Google Scholar]
- 46.Kubby J. A., ed., Adaptive Optics for Biological Imaging (CRC Press, Taylor & Francis Group, 2013). [Google Scholar]


