Abstract
Multimodality molecular imaging emerges as a powerful strategy for correlating multimodal information. We developed a pentamodal imaging system which can perform positron emission tomography, bioluminescence tomography, fluorescence molecular tomography, Cerenkov luminescence tomography and X-ray computed tomography successively. Performance of sub-systems corresponding to different modalities were characterized. In vivo multimodal imaging of an orthotopic hepatocellular carcinoma xenograft mouse model was performed, and acquired multimodal images were fused. The feasibility of pentamodal tomographic imaging system was successfully validated with the imaging application on the mouse model. The ability of integrating anatomical, metabolic, and pharmacokinetic information promises applications of multimodality molecular imaging in precise medicine.
OCIS codes: (170.0110) Imaging systems, (170.2655) Functional monitoring and imaging, (170.4580) Optical diagnostics for medicine, (170.6960) Tomography
1. Introduction
Since 1999, molecular imaging proposed by Weissleder [1] has been continuously evolving and contributing to biomedical research and applications [2, 3]. Imaging agents targeting specific biomarkers or molecular processes provide distinctive physiological and pathological information, and they enable imaging modalities and strategies to realize the capability which were impossible several years ago.
Different imaging modalities probe biological processes via harnessing the power of various vehicles of energy: high-energy gamma photons from radionuclide decays and annihilations of positrons, X-ray photons, visual/near infrared photons of luminescence or excited fluorescence, microwaves, and sound waves [4]. Because of the nature of underlying biophysical interactions, each modality has its own advantages and limitations. High tissue penetrating ability of high-energy gamma photons allows us to collect functional information by locating radiopharmaceuticals in the body with single-photon emission computed tomography (SPECT). Further utilizing coincidences of paired gamma photons from annihilations of positrons, positron emission tomography (PET) significantly enhances the imaging sensitivity to nano-/pico-molar magnitude [5]. As attenuation of X-ray is generally related to tissue density and thickness, X-ray computed tomography (CT) has good resolution on bones, but bad on soft tissues compared with magnetic resonance imaging (MRI) [6]. Optical imaging, including bioluminescence imaging/tomography (BLI/BLT), fluorescence molecular imaging/tomography (FMI/FMT), Cerenkov luminescence imaging/tomography (CLI/CLT), radioluminescence imaging (RLI) and so on, provides highly sensitive, high-throughput, non-invasive targeting imaging in vivo [5, 7]. Optical instrument costs much lower and has higher superficial resolutions than others while penetration depth of visual/near infrared photons is limited [5]. MRI provides high spatial resolution, excellent soft tissue contrast, qualitative and partial quantitative functional measurements, while the instrument costs much higher and safety of metal implants must be evaluated [8]. Ultrasound (US) provides excellent time resolution and its instrument is simple and easy to use, while it is not quantifiable and its imaging quality is greatly affected by air and bones [9]. Detailed comparison of different modalities has been conducted in many comprehensive reviews [4, 8, 10].
Therefore, integrating two and even more modalities becomes the trend of developing new imaging instruments [11]. PET/CT has been applied to oncology, neurology, and cardiology [3, 12] and evolved into a mainstay, replacing PET alone, in clinical imaging. Requirement of anatomical information during interpretation of 18F-fluorodeoxyglucose (18F-FDG) imaging and attenuation correction enabled by combining PET and CT made PET/CT a success within 20 years [11]. SPECT/CT shares the advantages of combination of anatomical and molecular information and attenuation correction ability with PET/CT. It is playing a more and more important role in endocrinology, infection, musculoskeletal imaging, and pulmonology [3, 13, 14]. Researchers endeavour to combine PET and MRI, seeking to excel PET-CT with simultaneous soft tissue contrast and functional measurement. This challenge is far greater than PET/CT and SPECT/CT as PET and MRI imaging processes can interfere with each other and attenuation map provided by CT is lost. Scientists have proposed several different integration frameworks [15–17] and solutions to attenuation correction with MRI images [18]. Photoacoustic imaging (PAI) detects ultrasound signals emitted from pulse laser excited haemoglobin or contrast agents. Integrations of PAI with US, Optical Coherence Tomography (OCT) and FMI have been explored [19]. Efforts have also been dedicated to CT/MRI [20–22] and combinations of more modalities, such as PET/SPECT/FMI/CT [23–26]. PET combined with optical tomographies (i.e. BLT, FMT, CLT, etc.) supplemented with structural information provided by CT/MRI will render us to fully capable of imaging a variety of diseases at different scales ranging from molecules level to tissues to whole body at high resolution, sensitivity and specificity [27]. For example: FMT can trace Cy5.5-labelled integrin to assess angiogenesis, BLT can reflect the progression of luciferase-labelled tumor cells, PET can monitor metabolism of tumor via 18F-FDG, while CLT can evaluate the dosimetry of radionuclide therapy using 90Y-labelled tumor targeting peptide. The combination of imaging of these properties provides us a more comprehensive understanding of the theranostic of the tumor.
In this article, we presented a pentamodal tomographic imaging system which can perform PET, CLT, FMT, BLT, and CT sequentially. Performance of subsystems corresponding to different modalities was characterized. In vivo multimodal imaging was performed on an orthotopic hepatocellular carcinoma (HCC) xenograft mouse model. Acquired data were reconstructed with corresponding algorithms and fused data was visualized with our medical imaging processing platform. Lastly, correlation of information obtained from different modalities was analyzed and possible directions of improving the presented system was discussed.
2. Methods
2.1 Instrumentations of the PET/BLT/FMT/CLT/CT pentamodal imaging system
Our pentamodal tomographic imaging system was integrated on a rotating gantry (Fig. 1(a)). In the following, a polar coordinate system was established with its origin locates at the center of the rotating gantry, and the position of each instrument was referred to as polar angle in this system, as shown in Fig. 1(b). An X-ray tube (XTF6011, X-ray Technology, Scotts Valley, CA) was arranged on the direction of 45°. A high-speed, low-noise CMOS X-ray detector (1512, Dexela, London, UK) was placed on the direction of 225°, opposite to the X-ray tube. Four PET block detectors (Raycan Technology, Suzhou, China) [28] were fixed on four electrical linear guideways on the directions of 0°, 90°, 180°, and 270°, respectively. A back-illuminated electron-multiplying charge-coupled device (EMCCD, iXon 888, Andor, Belfast, UK) camera was chosen to collect visual/infrared photons and produce optical images for BLT, FMT, and CLT. The EMCCD camera was coupled to a prime lens (EF 24mm f/1.4L II USM, Canon, Tokyo, Japan) and situated on the direction of 135°. We implemented FMT in trans-illumination mode by positioning an exciting laser source (BWI-780-60E, B&W Tek, Newark, DE) opposite to the EMCCD on the direction of 315°. The laser beam was expanded and collimated to provide a point excitation source in FMT. An animal holder connected to a gas anesthesia vaporizer (Matrx VIP 3000, Midmark, Versailles, OH) could move the imaging subject along the rotation axis of the gantry. A slit was opened in the middle of the animal holder to let the laser beam go through to act as a point excitation source on the back of the mouse. Several holes around the animal holder were drilled for registration of the optical photograph with the CT volume. We made a shield of lead board and lead glass to offer protection to the operators from ionizing radiation. The entire system was set up in a light-shield chamber for removing ambient light to enable accumulation of weak signals and increase signal-to-background ratio (SBR) of optical images. As shown in Fig. 1(c), on the opposite of the rotating gantry, there was an M3 MRI system (Aspect Imaging, Shoham, Israel), for the convenience of conducting MRI successively after other imaging modalities. Here, we used the MRI system as a supplement to our pentamodal system for verification.
Fig. 1.
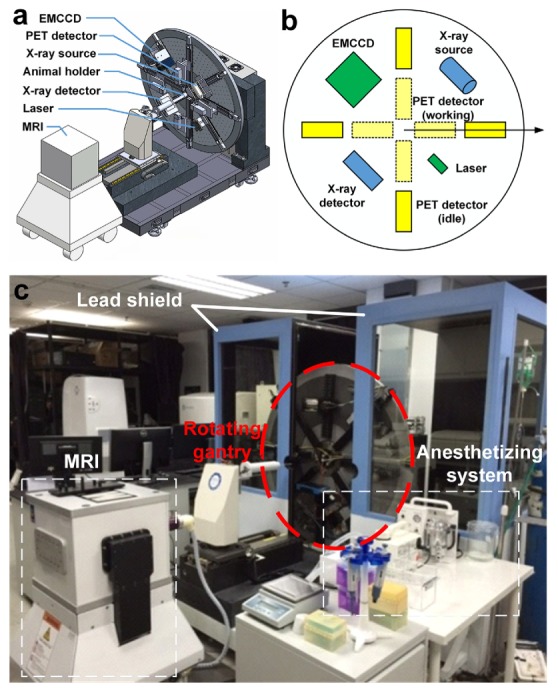
System overview of our pentamodal imaging system. (a) CT, optical and PET imaging instruments were arranged on a rotating gantry. (b)The polar coordinate system indicates the arrangement of instruments in the schematic diagram of our imaging system. Different colors are assigned for different sub-systems: yellow for PET sub-system, green for optical tomographies, and blue for CT sub-system. (c) Photograph of the overview of the system is taken before the assembling of the light shield chamber. An MRI system for verification is placed on the opposite of the rotating gantry.
2.2 System characterization
Ex vivo phantom imaging were performed to investigate the spatial resolution, sensitivity, and linearity of PET and optical tomographies, since CT has been characterized in a previous application [29] and MRI system is a commercial instrument. Two PET block detectors were used for spatial resolution testing of PET subsystem. The definition of spatial resolution of PET was adapted from the National Electrical Manufacturers Association (NEMA) NU 4-2008 standard: Resolution is specified as the full width at half maximum (FWHM) or full width at tenth maximum (FWTM) of the point source response, though our measurement was only conducted at the center of the axial field of view (FOV). 10 µCi (0.37 MBq, 0.16 µL) of 18F-FDG was secreted in a glass capillary of 0.5 mm in diameter and formed approximately a cylinder with a diameter of 0.5 mm and a height of 0.8 mm. The droplet of 18F-FDG was positioned in the middle of the two detectors and aligned with their centers and the detectors were 50 mm apart, corresponding to the setup in in vivo imaging experiment, as shown in Fig. 2(a) and 2(b). Spatial resolutions on three axes, i.e. x, y, and z, were measured from the acquired PET data. Additionally, we have performed a Derenzo phantom (Fig. 2(c) and 2(d)) study to verify the consistency of the result from the previous test. The Derenzo phantom was filled with a total of 50 μCi (1.85 MBq, 600 µL) of 18F-FDG, placed at the center of the FOV between the two PET block detectors, and imaged for five minutes. Ordered subset expectation maximization (OSEM) algorithm [30] was used to reconstruct PET scan data of the Derenzo phantom with 10 iterations and 5 subsets. The absolute system sensitivity of PET sub-system was measured using 4 µCi (0.148 MBq, 0.12 µL) of 18F-FDG, positioned in the middle of four detectors and translated along axial direction in step of 5 mm. At each location, data was acquired with a timing window of 6 ns. Data within an energy window of 250-750 keV were analysed. Counts were corrected for 18F decay based on acquiring time points. Linearity of PET sub-system was tested with various concentrations of 18F-FDG (100 µL) filled in strip wells. Each group of wells were imaged for five minutes. Scan data were reconstructed as previously mentioned. Cylinder regions of interest (ROIs) of 6 mm in diameter and 2 mm in height, of the same geometry of 18F-FDG filled in strip wells, were drawn to calculate statistics of the reconstructed PET value. A cubic polyethylene phantom was used for spatial resolution tests of optical tomographies. The phantom had absorption and scattering coefficients of 0.1 mm−1 and 9 mm−1, respectively. As depicted in Fig. 2(e)-2(g), two cylindrical cavities 3 mm apart were drilled on the phantom. Luminescent liquid for BLI (6.28 µL), indocyanine green (ICG) for FMI (2 µg/mL, 6.28 µL), 29 µCi (1.07 MBq, 6.28 µL) of 18F-FDG for CLI, were injected to the bottom of the cavities, respectively. Therefore, the volumes of the sources were two cylinders with a diameter of 2 mm and a height of 2 mm. As shown in the top view (Fig. 2(f)), optical image was acquired from the front of the phantom. So the depth of the optical sources in the phantom were 2 mm. Displacement of reconstructed source positions was measured to characterize the spatial resolution of the optical imaging subsystem. Data acquisition settings and processing were same as in vivo imaging described in the following. To test the linearity of optical modalities, luciferase labelled mouse breast cancer cells (4T1-luc, 3.3 × 10⁶/mL) for BLI, ICG (16 µM) for FMI, 18F-FDG (30 µCi, 1.11 MBq, 150 µL) for CLI, were pipetted into 96-well plates to form various concentrations of light sources, respectively. For FMI, each well was excited with laser point source of 1 mW separately. Images were acquired from the top of the 96-well plates. Data acquisition settings and processing were same as in vivo imaging described in the following. The detection limit was determined as the measurement of sensitivity of optical modalities. Several marker pairs were selected in PET, CT and photograph, classic iterative closest point algorithm was used to register images acquired from different sub-systems. Registration errors were determined by calculating root mean square of distances between registered marker pairs.
Fig. 2.
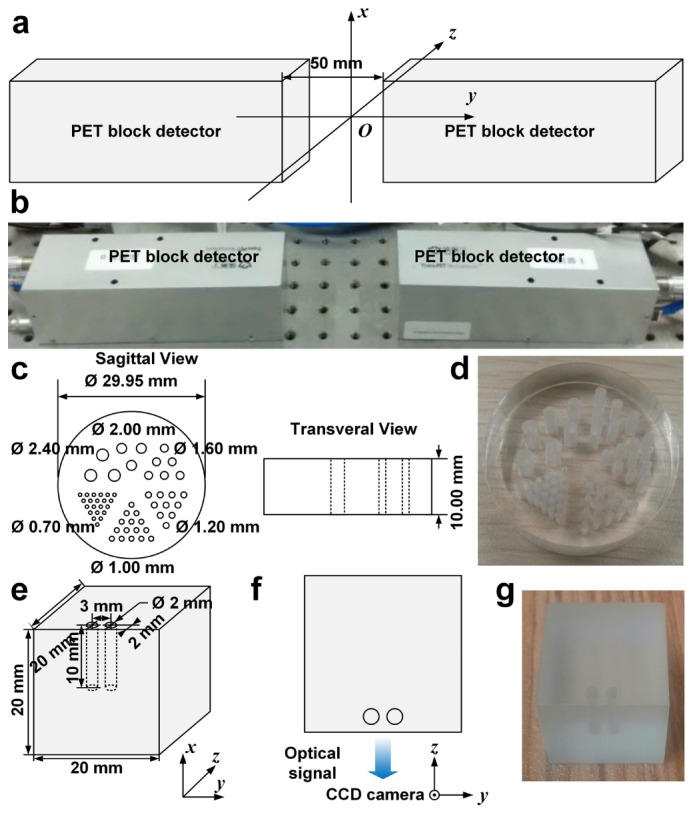
Spatial resolution characterization of PET and optical sub-systems. (a) The droplet of 18F-FDG was positioned at the origin of the coordinate system. (b) The photograph shows the experimental setup of PET block detectors. (c) The schematic diagram shows the dimensions of the Derenzo phantom used in the verification of spatial resolution of PET sub-system. (d) The photograph shows the Derenzo phantom. (e) The schematic diagram shows the dimensions of the cubic optical phantom. (f) The schematic diagram shows top view of optical signal acquisition setup. (g) The photograph shows the cubic phantom used in phantom experiment of optical tomographies.
2.3 Mouse model establishment
An orthotopic HCC mouse model was established for in vivo imaging experiment. Luciferase labelled well-differentiated human HCC cells HepG2-Red-Fluc was purchased (BW134280, PerkinElmer, Waltham, MA) and cultured in Gibco® Dulbecco's Modified Eagle's Medium with high glucose (Life Technologies, Carlsbad, CA) supplemented with 10% fetal bovine serum, 100U/mL penicillin and 10mg/ml streptomycin (Life Technologies, Carlsbad, CA) in a humidified incubator at 37 °C with 5% CO2. A female 6-week-old BALB/c nude mouse was purchased (Vital River, Beijing, China) and used for establishment of the orthotopic mouse model. All animal experiments were conducted in compliance with the guidelines of the Institutional Animal Care and Use Committee of Chinese PLA General Hospital. HepG2-Red-Fluc cells (3 × 10⁷) were harvested, suspended in 25 µL of Matrigel® (Corning, Corning, NY). After anesthetized with 1% isoflurane (Jiupai, Shijiazhuang, China), the mouse received laparotomy. Suspended cells were injected into the left lateral lobe of liver of the mouse with an insulin syringe (BD, Franklin Lakes, NJ). Dissected peritoneum and abdominal skin were stitched separately. Fourteen days later, the mouse was subjected to the in vivo pentamodal tomographic imaging.
2.4 Data acquisition
The multimodal imaging procedure is consisted of injection of imaging contrast agents, multimodal scan, and sub-system switching overhead (Fig. 3(a)). The mouse was injected with indocyanine green (ICG, 100 mg/L, 100 µL) intravenously 24 h prior to the imaging and fasted overnight. Thirty min before PET imaging, the mouse was injected with 224 µCi (8.288 MBq, 50 µL) 18F-FDG. PET block detectors were moved to their working positions, and opposite detectors were 5 cm apart. After anesthetized with 1% isoflurane, the mouse was firstly subjected to a PET scan of 15 min. After retraction of PET block detectors along the linear guideways to their idle positions and adjusting the wiring for optical imaging, CLT images were immediately acquired with a 2 × 2 binning (same for all following optical imaging) and 5-min exposure time setting of EMCCD. Then the laser of 680 nm was turned on and optical image for FMT was acquired with 1 s exposure time and an emission filter of 810 nm (XBPA810, Asahi Spectra, Tokyo, Japan). When FMT imaging was finished and the laser was turned off, the mouse was injected with 75 µL (15 mg/mL) of D-Luciferin (770504, PerkinElmer, Waltham, MA) intraperitoneally and subjected to BLT imaging with 100 s exposure time 10 min later. After all the optical imaging, we turned on the lights in the chamber and acquired a photograph with the EMCCD with 10 ms exposure time. The photograph was used for locating the mouse and helping register optical images with the CT volume. Afterwards, 360 frames of CT projections of the mouse were acquired in cone beam projection mode. Lastly, the mouse was transferred into the imaging bed of MRI and underwent a T2 scan in M3 MRI system to provide soft tissue contrast information and to help verifying the result of functional modalities. The parameters for MRI scan were set as follows: 5578.6 ms of time to repeat (TR) and 66.61 ms of time to echo (TE). Slicing spacing was 1 mm and slice pixel size was 0.23 mm × 0.23 mm. After imaging, we euthanized and dissected the mouse to verify locations of tumors.
Fig. 3.
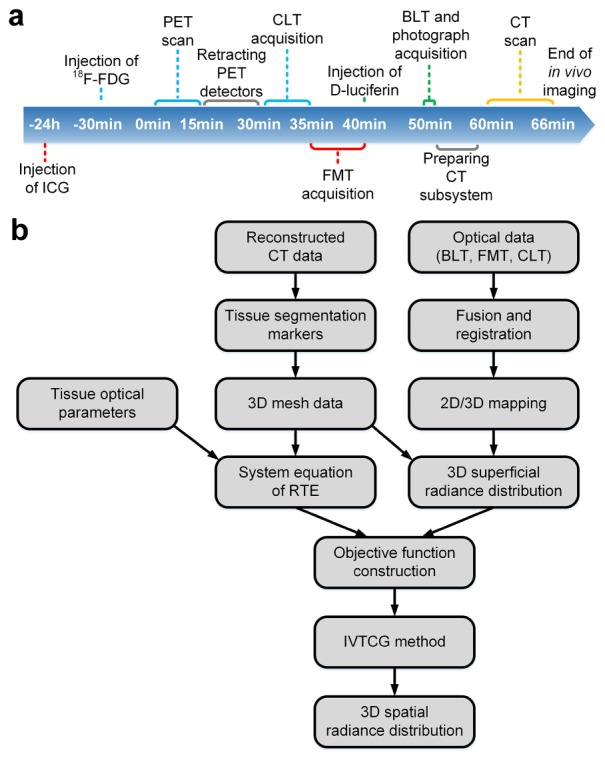
Workflow of data acquisition and optical reconstruction. (a) Workflow of in vivo multimodal imaging is shown with imaging events. Time points begins from starting of PET scan. Injection of contrast agents and corresponding imaging process are indicated with the same color. (b) Reconstruction workflow of optical tomographies (BLT, FMT, and CLT) is shown.
2.5 Reconstruction
Ordered subset expectation maximization (OSEM) algorithm was used to reconstruct PET scan data with 15 iterations and 20 subsets. Reconstruction of X-ray CT was performed with our previous implementation of fast Katsevich algorithm based on GPU for helical cone-beam computed tomography [31] integrated in our medical imaging processing platform-MITK & 3DMed [32]. MRI data were processed with Aspect Imaging software (Aspect Imaging, Shoham, Israel).
As shown in Fig. 3(b), the reconstruction workflow of optical tomographies, including BLT, FMT, and CLT, was as follows: Reconstructed CT data was segmented with semi-automated algorithms integrated in MITK & 3DMed. Segmented CT data was used to reconstruct three-dimensional (3D) mesh data. Incorporated with tissue optical parameters, 3D mesh data was utilized to construct the system equation of radiation transport equation (RTE) for finite element method (FEM). Meanwhile, acquired optical signals were fused with the photograph and registered to reconstructed CT data via markers visible on both modalities. Then we obtained 3D superficial radiance distribution via mapping registered optical signals onto 3D mesh data. Combining the system equation and 3D superficial radiance distribution, we constructed the objective function. Finally, incomplete variables truncated conjugate gradient (IVTCG) method [33] was used to solve the reconstruction problem and 3D spatial radiance distribution was reconstructed.
2.6 Multimodal volume data processing and visualization
Reconstructed optical data was rasterized and mapped onto the CT volume with ITK image processing toolkit [34]. Tetrahedrons consisted of nodes with intensity over 10% of the max intensity in the mesh were rasterized as ellipsoids in the volume [35]. As the voxels of CT data were of single-precision float point type ranging from −1.00 to 1.00, the voxel values of ellipsoids corresponding to BLT, FMT and CLT were −0.75, −0.50 and −0.25, respectively. Reconstructed PET data was mapped to the range from −0.90 to −0.10 in another copy of CT data. For CLT/PET overlay display, PET data was mapped to the range from −0.8 to 0.0, voxels corresponding to CLT were set to −0.9 and rendered as green tetrahedrons to avoid confusion with blue signals in GE color map of PET. Checkerboard overlay was used when CLT and PET rendered the same voxel. GPU full volume rendering module in 3DMed was used to visualize fused volumes. MRI data was displayed in gray and rainbow color map by the slice viewer in 3DMed.
3. Results
3.1 System characteristics
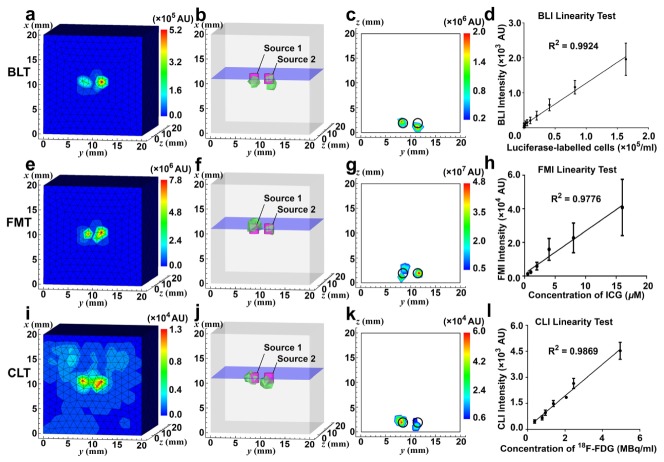
Shown in a previous application of the CT subsystem [29], resolution and slice thickness of CT frames were 0.012 mm. By plotting the profiles through the center of reconstructed source in PET image along x, y, and z axis respectively and measuring the full-width at half maximum (FWHM) of the peaks, the resolutions of PET block detectors along x, y, and z axis were 1.139 mm, 1.750 mm, and 2.959 mm, respectively, as shown in Fig. 4(a)-4(c). Full-width at tenth maximum (FWTM) of the peaks along x, y, z axis were 1.914 mm, 3.036 mm, and 6.072 mm. In the reconstructed Derenzo phantom image (Fig. 4(d)), sources of 1.6 mm in diameter could be clearly separated while some sources of 1.2 mm failed to be separated. Peak absolute sensitivity at center of FOV was 67.738 cps/kBq, as shown in Fig. 4(e). PET sub-system showed good linearity (R2 = 0.9962) in the range from 0.1 µCi/mL (3.7 kBq/mL) to 225µCi/mL (8.325 MBq/mL) of 18F-FDG (Fig. 4(f)). The CCD counts of acquired BLI, FMI, and CLI image were mapped onto the frontal surface of the meshed cube (Fig. 5(a), 5(e), and 5(i)), respectively. Reconstructed optical signal above 10% of maximum power was delineated with bounding green polyhedrons, while the magenta cylinders indicated the actual positions of the sources (Fig. 5(b), 5(f), and 5(j)). Slice over the centers of the sources at x = 11 mm (blue plane in Fig. 5(b), 5(f), and 5(j)) was extracted to depict the displacement of the reconstructed sources (Fig. 5(c), 5(g), and 5(k)). Error of reconstruction was measured by both the distances from the centers of the actual sources to the point of the maximum reconstructed power (0.235 mm and 1.145 mm for BLT, 0.235 mm and 1.072 mm for FMT, 0.508 mm and 1.037 mm for CLT) and reconstructed power-weighted centroids [36] (1.145 mm and 0.885 mm for BLT, 0.239 mm and 0.703 mm for FMT, 0.468 mm and 0.939 mm for CLT). All optical tomographies separated sources 3 mm apart at the depth of 2 mm. As shown in Fig. 5(d), 5(h) and 5(l), linearity tests showed BLI was able to detect 1600 /mL to 1.65 × 10⁵ /mL of luciferase-labelled 4T1-luc cells while still maintaining good linearity (R2 = 0.9924), FMI could image 0.5 µM to 16 µM of ICG (R2 = 0.9776), and CLI observed linear (R2 = 0.9869) Cerenkov luminescence from 10 µCi/mL (0.37 MBq/mL) to 150 µCi/mL (5.55 MBq/mL) of 18F-FDG, respectively. Root mean squares of distances between point pairs of PET and CT, 3D-mapped photograph and CT were calculated to determine registration error of PET-CT and optical tomographies-CT. General performance parameters (including spatial resolution, sensitivity, linearity, and registration error) were summarized in Table 1. The complete specification of the system is presented in Table 2.
Fig. 4.
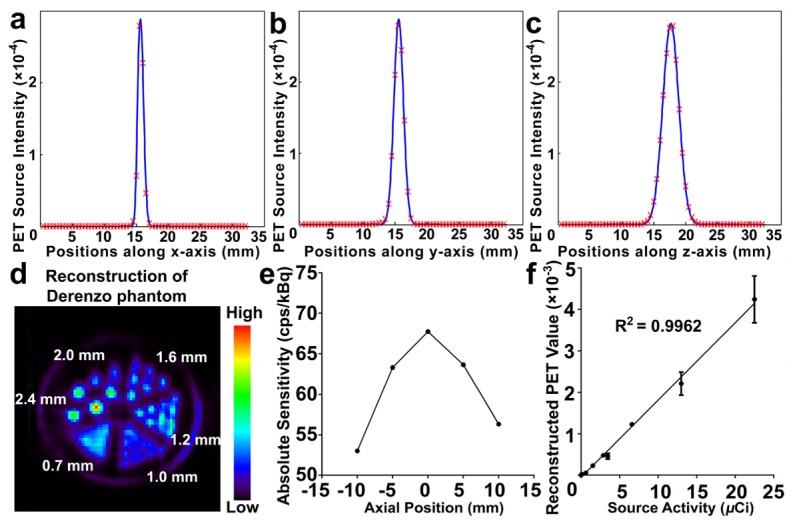
Results of performance tests of PET. (a)-(c). PET source intensity profiles along x, y, and z axis respectively. (d) Reconstruction of Derenzo phantom. (e) Absolute sensitivity profile along axial direction between the two block detectors. (f) Linear regression of source radioactivity correlated with reconstructed PET values.
Fig. 5.
Results of performance tests of optical tomographies. (a, e, i) CCD counts of acquired BLI, FMI, and CLI image in arbitrary units (AU) were mapped on the cubic phantom, respectively. (b, f, j) BLT/FMT/CLT reconstruction of the two sources in the phantom, respectively. Reconstructed signals above 10% of the maximum reconstructed power is delineated with bounding green polyhedrons. Magenta cylinders center at the positions of the actual sources. (c, g, k) The slice taken from x = 11 mm, i.e. the blue plane in (b, f, j) respectively, shows reconstructed power intensity distribution in AU and displacement from actual sources. Positions of the actual sources are indicated by black circles. (d, h, l) The result of linearity tests of BLI, FMI, and CLI, respectively.
Table 1. General performance parameters of sub-systems.
| Sub-systems | Spatial resolution (mm) | Registration error (mm) | Sensitivity | Linearity (R2) |
|---|---|---|---|---|
| PET |
1.2 mm ~1.6 mm |
1.255 mm |
67.738 cps/kBq |
0.9962 |
| BLT |
< 3 mm | 1.406 mm | 1600 cells/mL |
0.9924 |
| FMT |
0.5 μM |
0.9776 |
||
| CLT | 10 μCi/mL (0.37 MBq/mL) |
0.9869 |
Table 2. System specifications of the pentamodal imaging system.
| Subsystems | Specifications | Values |
|---|---|---|
| CT subsystem |
Voxel Size | 12 µm × 12 µm × 12 µm |
| Acquisition Duration | 1 s / frame | |
| Maximum X-ray Tube Voltage | 130 kV | |
| Maximum X-ray Tube Current | 0.3 mA | |
| Focal Spot Size | 5 µm | |
| X-ray Detector Size | 140 mm × 110 mm | |
| X-ray Detector Resolution | 1655 × 1300 | |
|
| ||
| Optical Subsystem |
Field of View | 140 mm × 140 mm |
| Image Size | 1024 × 1024 | |
| Quantum Yield | 92.5% | |
|
| ||
| PET Subsystem |
Effective Detecting Size | 53 mm × 53 mm |
| Time Resolution | 1.5 ns | |
| Energy Window | 472.6 keV ~550 keV | |
3.2 In vivo optical tomographies fused with CT imaging
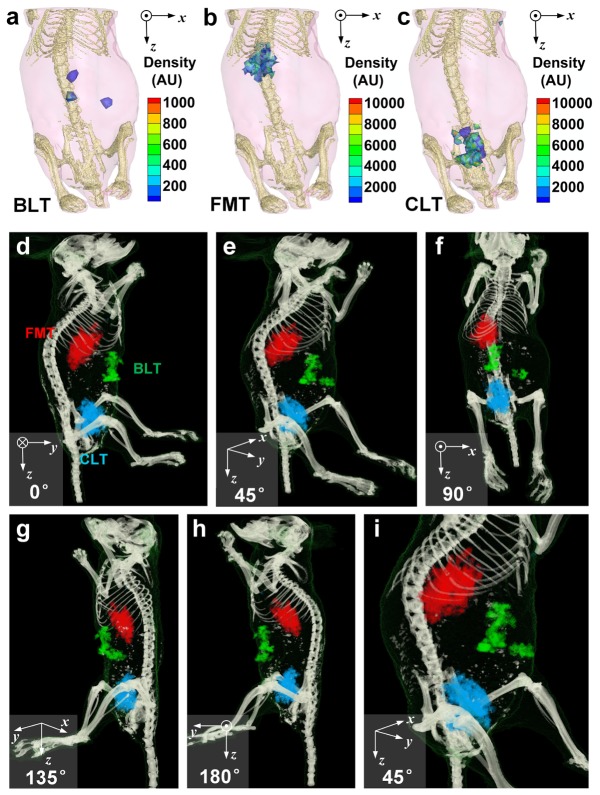
Figure 6(a)-6(c) show the distribution of reconstructed bioluminescence, fluorescence, and Cerenkov luminescence signals, respectively. Signals of BLT came from luciferase-labelled tumor cells, signals of FMT were emitted from concentrated ICG, and signals of CLT were generated from the Cerenkov photon of 18F-FDG. None of these modalities provides enough structural information. Therefore, three modalities of optical imaging were fused with CT volume and bioluminescence, fluorescence, and Cerenkov luminescence signals were mapped as green, red, and blue ellipsoids, respectively. Viewed from different angles in Fig. 6(d)-6(i), the optical sources can be localized: tumor cells, corresponding to green signals of bioluminescence, situated near mucosa peritoneum and dorsal liver lobes (left lateral lobe or right medial lobes); ICG, corresponding to red signals of fluorescence, located mainly in the liver; 18F-FDG, corresponding to blue signals of Cerenkov luminescence, distributed dominantly in the bladder.
Fig. 6.
Reconstruction of in vivo optical tomographies and fusion with reconstructed CT volume. (a)-(c) 3D distribution of reconstructed BLT, FMT, and CLT are shown, respectively. Skeletons are also shown to help localize of reconstructed signals. (d)-(h) Fusion of BLT, FMT, and CLT with CT are viewed from different angles. BLT, FMT, and CLT signals are mapped as green, red, and blue tetrahedra, respectively. (i) Zoom-in view of abdominal area provides a closer look at the distribution of optical signals.
3.3 PET imaging fused with CT imaging
In accordance with CLT results, PET signals were mostly concentrated in the bladder, as shown in Fig. 7(a)-7(e). It is consistent with the expectation that the result of CLT. In addition, some signals in the abdomen (inside the yellow circle in Fig. 7(f)), which were missing in CLT, could be found on the PET image located in the kidneys. After fusing PET and CLT in the same volume data, localization of 18F-FDG in CLT was closed to the surface of the mouse compared with PET and the distribution of reconstructed sources was more concentrated in CLT than that in PET, as shown in Fig. 7(g)-7(i).
Fig. 7.
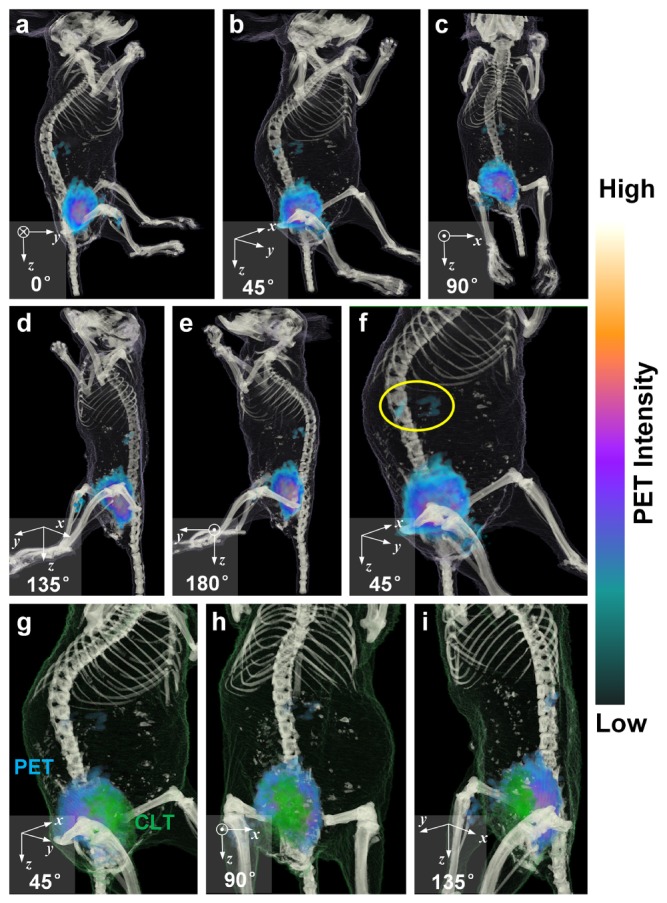
Fusion of reconstructed PET and CT. (a)-(e) Fusion of PET with CT are viewed from different angles. GE PET color map is used for PET data, as shown on the right of the figure. (f) Zoom-in view of abdominal area provides a closer look at the distribution of PET signals. Some signals located in the kidneys are indicated with the yellow circle. (g)-(i) Fusion of PET and CLT with CT are viewed from different angles. GE PET color map is still used for PET data. CLT signals were rendered as green tetrahedra.
3.4 MRI imaging verification
As shown in Fig. 8(a), gallbladder (red circle) and hepatic portal vein (yellow circle) are top two brightest regions in the liver area (delineated in white dashes) in the sagittal slice of T2 weighted MRI image. After the MRI image was enhanced with rainbow color map (Fig. 8(b)), a suspected tumor could be figured out near the mucosa peritoneum on the dorsal side of the liver. Besides, compared to CT, much more anatomical details, e. g. the heart (H) and lumen of colon (C), could be clearly delineated on MRI image.
Fig. 8.
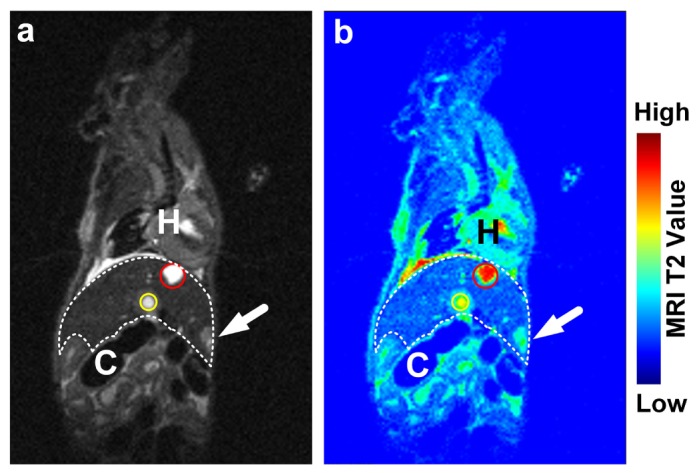
(a) A sagittal slice of T2 weighted MRI image is shown. Gallbladder (red circle) and hepatic portal vein (yellow circle) are two brightest regions in the liver (delineated with white dashes). Compared with CT, MRI image reveals much more detailed anatomical information, e. g. the heart (H) and lumen of colon (C). (b) After enhanced in rainbow color map, a suspected tumor could be figured out near mucosa perineum on the dorsal side of the liver.
4. Discussion
Herein, we presented a pentamodal tomographic imaging system. With the system, we successfully acquired and fused anatomical, viability, metabolic, and pharmacokinetic information from PET, BLT, FMT, CLT and CT, and this system made multimodal imaging more convenient.
Results of the system characterization shows that subsystem has comparable performance with corresponding single-modal imaging system. According to the manufacturer of PET block detector, 1.0 mm-diameter rods can be clearly resolved [28], while FWHMs along x, y, and z axis at the center of FOV of our PET sub-system are 1.139 mm, 1.750 mm, and 2.959 mm, respectively. The reconstructed Derenzo phantom image showed consistency with the results calculated from FWHM, which verified the spatial resolution of PET sub-system was between 1.2 mm and 1.6 mm. Sensitivity test of PET showed that 6.77% of decay events could be detected at the center of FOV. Compared with our previous work on CLT, our CLT subsystem has smaller reconstruction error (0.508 mm and 1.037 mm) than CLT single-modal system reported in 2010 (2.15 mm) [37], but larger error than the multispectral hybrid version reported in 2015 (0.29 mm and 0.37 mm) [38]. That previous work utilized a multi-spectral strategy which requires 3-times longer acquisition duration and a more complicated algorithm to solve the equation. There is a trade-off between imaging complexity and reconstruction error. It was not required to change filters and prolong the acquisition duration in this system, therefore the errors increased. Reconstruction error of BLT and FMT is smaller than that of CLT, this should due to the greater intensity of BLI and FMI signals, as our light shielding chamber is still leaking photons.
The timepoint of injecting ICG was arranged at 24 hours prior imaging to wait for the excretion of ICG in the bowel [39], though it might not be the optimal time point for FMT of HCC tumor. In this paper, our goal is to demonstrate fusion of multimodal optical signals clearly, FMT provide pharmacokinetics information of fluorescent dyes, not limited to ICG. Based on similar considerations, we selected the imaging timepoint of PET and CLT after the excretion of 18F-FDG. Injection of luciferin was arranged after FMT to avoid interference of bioluminescence. The mouse was anesthetized on the animal holder in supine position to help injection of luciferin without changing the position of the animal.
Some of reconstructed distribution of optical signals are consistent to the expectations based on the distribution of optical sources. BLT signals generated from luciferase labels of tumor cells indicate the viability and location tumor cells resided, which is according with postmortem dissection. Cerenkov luminescence dominantly distributed in the bladder, as predicted by the renal clearance of 18F-FDG [40]. CT volume provides not only the mesh for optical reconstruction, but also anatomical information for localization of reconstructed optical sources.
FMT signals emitted by excited ICG concentrated in the liver, which seems to be contradict with known distribution of ICG at 24 hours time point: more ICG should retain in hepatic cancer tissues than in normal hepatic tissues. We proposed the explanation that the strong signal in the upper liver was caused by biliary obstruction induced by injection of HepG2 cells into the left lateral lobe of liver when establishing the othotopic tumor model.
PET image reveals more precise details on the distribution of 18F-FDG. Besides the strong component of signals in the bladder, some additional signals could be found in the kidneys. Missing of renal signals on CLT image should be ascribed to acquisition method of optical signals and deep location of the kidney in mouse. Optical image was only acquired from dorsal side of the mouse, therefore optical signals from the kidneys was absorbed by tissues. If multi-angular optical acquisition strategy was adopted, CLT should be able to detect signals from the kidneys while the acquisition duration would be prolonged. Fusion of CLT and PET shows that CLT localization of bladder seems closer to the surface of the mouse than that of PET. This was caused by the ill-conditioning of optical reconstruction, and advanced algorithms may improve the situation. The “concentrated” looking of CLT should be caused by threshold setting for representation of result of reconstruction: a lower threshold will lead to more “expanded” looking.
As the mouse must be transferred into the imaging coil and re-anesthetized to undergo a MRI scan currently, MRI data couldn’t be fused with other modalities yet. We have been working on manufacturing a new animal holder, which is compatible with the MRI imaging coil and the pipes to the gas anesthesia vaporizer of the rotating gantry. With this animal holder, MRI can be correlated with other imaging modalities.
Currently, modalities using different detectors are acquired sequentially in our system. If multimodality data could be acquired simultaneously, multimodal imaging duration would be much shortened, registration errors caused by breathing and heart palpitations could be eliminated and applications in stroke and coronary artery disease would be enabled [17, 21]. Merging some of the modalities into simultaneous multimodal imaging is a promising direction to improve our system.
5. Conclusion
We presented a pentamodal tomographic imaging system integrating PET, BLT, FMT, CLT, and CT. Results showed the feasibility of pentamodal tomographic imaging of living subjects. Fusion of multimodalities correlated and integrated anatomical, metabolic, viability and pharmacokinetic information from a single subject. It is anticipated that the proposed system has a variety of potential applications in precise medicine.
Acknowledgments
The authors would like to express their gratitude of Dr. Xiaojun Zhang from Chinese PLA General Hospital, Beijing, China for his help with providing the radionuclide used in the research and guidance of animal care. The authors also would like to thank Xiao Liang and Yu An from Key Laboratory of Molecular Imaging of Chinese Academy of Sciences, Beijing, China for their assistance in adjusting the settings of our multimodal system. The authors also would like to thank Dr. Shouping Zhu, Fanzhen Meng, Liang Li, and Xuezhou Cao from Engineering Research Center of Molecular and Neuro Imaging of Ministry of Education & School of Life Science and Technology, Xidian University, Xi’an, China for their assistance in conducting the experiments of characterizing PET sub-systems.
Funding
National Natural Science Foundation of China (NSFC) (81227901, 81527805, 61231004, 61622117, 81671759); National Key Research and Development Program of China (2016YFC0102600).
References and links
- 1.Weissleder R., “Molecular imaging: exploring the next frontier,” Radiology 212(3), 609–614 (1999). 10.1148/radiology.212.3.r99se18609 [DOI] [PubMed] [Google Scholar]
- 2.Gammon S. T., Foje N., Brewer E. M., Owers E., Downs C. A., Budde M. D., Leevy W. M., Helms M. N., “Preclinical anatomical, molecular, and functional imaging of the lung with multiple modalities,” Am. J. Physiol. Lung Cell. Mol. Physiol. 306(10), L897–L914 (2014). 10.1152/ajplung.00007.2014 [DOI] [PubMed] [Google Scholar]
- 3.Martí-Bonmatí L., Sopena R., Bartumeus P., Sopena P., “Multimodality imaging techniques,” Contrast Media Mol. Imaging 5(4), 180–189 (2010). 10.1002/cmmi.393 [DOI] [PubMed] [Google Scholar]
- 4.Cherry S. R., “Multimodality in vivo imaging systems: twice the power or double the trouble?” Annu. Rev. Biomed. Eng. 8(1), 35–62 (2006). 10.1146/annurev.bioeng.8.061505.095728 [DOI] [PubMed] [Google Scholar]
- 5.James M. L., Gambhir S. S., “A molecular imaging primer: modalities, imaging agents, and applications,” Physiol. Rev. 92(2), 897–965 (2012). 10.1152/physrev.00049.2010 [DOI] [PubMed] [Google Scholar]
- 6.Patton J. A., Townsend D. W., Hutton B. F., “Hybrid imaging technology: from dreams and vision to clinical devices,” Semin. Nucl. Med. 39(4), 247–263 (2009). 10.1053/j.semnuclmed.2009.03.005 [DOI] [PubMed] [Google Scholar]
- 7.Liu J., Wang Y., Qu X., Li X., Ma X., Han R., Hu Z., Chen X., Sun D., Zhang R., Chen D., Chen D., Chen X., Liang J., Cao F., Tian J., “In vivo quantitative bioluminescence tomography using heterogeneous and homogeneous mouse models,” Opt. Express 18(12), 13102–13113 (2010). 10.1364/OE.18.013102 [DOI] [PMC free article] [PubMed] [Google Scholar]
- 8.Koba W., Kim K., Lipton M. L., Jelicks L., Das B., Herbst L., Fine E., “Imaging devices for use in small animals,” Semin. Nucl. Med. 41(3), 151–165 (2011). 10.1053/j.semnuclmed.2010.12.003 [DOI] [PubMed] [Google Scholar]
- 9.Hedrick W. R., Hykes D. L., Starchman D. E., Ultrasound Physics and Instrumentation (Elsevier; Mosby, 2005). [Google Scholar]
- 10.Fine E. J., Herbst L., Jelicks L. A., Koba W., Theele D., “Small-animal research imaging devices,” Semin. Nucl. Med. 44(1), 57–65 (2014). 10.1053/j.semnuclmed.2013.08.006 [DOI] [PubMed] [Google Scholar]
- 11.Hricak H., Choi B. I., Scott A. M., Sugimura K., Muellner A., von Schulthess G. K., Reiser M. F., Graham M. M., Dunnick N. R., Larson S. M., “Global trends in hybrid imaging,” Radiology 257(2), 498–506 (2010). 10.1148/radiol.10100579 [DOI] [PubMed] [Google Scholar]
- 12.Hu Z., Yang W., Liu H., Wang K., Bao C., Song T., Wang J., Tian J., “From PET/CT to PET/MRI: advances in instrumentation and clinical applications,” Mol. Pharm. 11(11), 3798–3809 (2014). 10.1021/mp500321h [DOI] [PubMed] [Google Scholar]
- 13.Huellner M. W., Strobel K., “Clinical applications of SPECT/CT in imaging the extremities,” Eur. J. Nucl. Med. Mol. Imaging 41(S1), S50–S58 (2014). 10.1007/s00259-013-2533-5 [DOI] [PubMed] [Google Scholar]
- 14.Mortensen J., Gutte H., “SPECT/CT and pulmonary embolism,” Eur. J. Nucl. Med. Mol. Imaging 41(S1), S81–S90 (2014). 10.1007/s00259-013-2614-5 [DOI] [PMC free article] [PubMed] [Google Scholar]
- 15.Ng T. S. C., Bading J. R., Park R., Sohi H., Procissi D., Colcher D., Conti P. S., Cherry S. R., Raubitschek A. A., Jacobs R. E., “Quantitative, simultaneous PET/MRI for intratumoral imaging with an MRI-compatible PET scanner,” J. Nucl. Med. 53(7), 1102–1109 (2012). 10.2967/jnumed.111.099861 [DOI] [PMC free article] [PubMed] [Google Scholar]
- 16.Veit-Haibach P., Kuhn F. P., Wiesinger F., Delso G., von Schulthess G., “PET-MR imaging using a tri-modality PET/CT-MR system with a dedicated shuttle in clinical routine,” MAGMA 26(1), 25–35 (2013). 10.1007/s10334-012-0344-5 [DOI] [PubMed] [Google Scholar]
- 17.Judenhofer M. S., Wehrl H. F., Newport D. F., Catana C., Siegel S. B., Becker M., Thielscher A., Kneilling M., Lichy M. P., Eichner M., Klingel K., Reischl G., Widmaier S., Röcken M., Nutt R. E., Machulla H. J., Uludag K., Cherry S. R., Claussen C. D., Pichler B. J., “Simultaneous PET-MRI: a new approach for functional and morphological imaging,” Nat. Med. 14(4), 459–465 (2008). 10.1038/nm1700 [DOI] [PubMed] [Google Scholar]
- 18.Lee J. S., Kim J. H., “Recent advances in hybrid molecular imaging systems,” Semin. Musculoskelet. Radiol. 18(2), 103–122 (2014). 10.1055/s-0034-1371014 [DOI] [PubMed] [Google Scholar]
- 19.James J., Murukeshan V. M., Woh L. S., “Integrated photoacoustic, ultrasound and fluorescence platform for diagnostic medical imaging-proof of concept study with a tissue mimicking phantom,” Biomed. Opt. Express 5(7), 2135–2144 (2014). 10.1364/BOE.5.002135 [DOI] [PMC free article] [PubMed] [Google Scholar]
- 20.Xi Y., Zhao J., Bennett J. R., Stacy M. R., Sinusas A. J., Wang G., “Simultaneous CT-MRI reconstruction for constrained imaging geometries using structural coupling and compressive sensing,” IEEE Trans. Biomed. Eng. 63(6), 1301–1309 (2016). 10.1109/TBME.2015.2487779 [DOI] [PMC free article] [PubMed] [Google Scholar]
- 21.Wang G., Kalra M., Murugan V., Xi Y., Gjesteby L., Getzin M., Yang Q., Cong W., Vannier M., “Vision 20/20: Simultaneous CT-MRI--Next chapter of multimodality imaging,” Med. Phys. 42(10), 5879–5889 (2015). 10.1118/1.4929559 [DOI] [PubMed] [Google Scholar]
- 22.Wang G., Zhang J., Gao H., Weir V., Yu H., Cong W., Xu X., Shen H., Bennett J., Furth M., Wang Y., Vannier M., “Towards omni-tomography--grand fusion of multiple modalities for simultaneous interior tomography,” PLoS One 7(6), e39700 (2012). 10.1371/journal.pone.0039700 [DOI] [PMC free article] [PubMed] [Google Scholar]
- 23.Lu Y., Yang K., Zhou K., Pang B., Wang G., Ding Y., Zhang Q., Han H., Tian J., Li C., Ren Q., “An integrated quad-modality molecular imaging system for small animals,” J. Nucl. Med. 55(8), 1375–1379 (2014). 10.2967/jnumed.113.134890 [DOI] [PubMed] [Google Scholar]
- 24.Hu Z., Qu Y., Wang K., Zhang X., Zha J., Song T., Bao C., Liu H., Wang Z., Wang J., Liu Z., Liu H., Tian J., “In vivo nanoparticle-mediated radiopharmaceutical-excited fluorescence molecular imaging,” Nat. Commun. 6, 7560 (2015). 10.1038/ncomms8560 [DOI] [PMC free article] [PubMed] [Google Scholar]
- 25.Lv Y., Tian J., Cong W., Wang G., Luo J., Yang W., Li H., “A multilevel adaptive finite element algorithm for bioluminescence tomography,” Opt. Express 14(18), 8211–8223 (2006). 10.1364/OE.14.008211 [DOI] [PubMed] [Google Scholar]
- 26.Leng C., Tian J., “Mathematical method in optical molecular imaging,” Sci. China Inf. Sci. 58(3), 031101 (2015). 10.1007/s11432-014-5222-5 [DOI] [Google Scholar]
- 27.Kyriazi S., Kaye S. B., deSouza N. M., “Imaging ovarian cancer and peritoneal metastases--current and emerging techniques,” Nat. Rev. Clin. Oncol. 7(7), 381–393 (2010). 10.1038/nrclinonc.2010.47 [DOI] [PubMed] [Google Scholar]
- 28.Xie Q., Chen Y., Zhu J., Liu J., Wang X., Liu W., Chen X., Niu M., Wu Z., Xi D., Wang L., Xiao P., Chen C.-T., Kao C.-M., “Implementation of LYSO/PSPMT block detector with all digital DAQ system,” IEEE Trans. Nucl. Sci. 60(3), 1487–1494 (2013). 10.1109/TNS.2013.2245771 [DOI] [Google Scholar]
- 29.Yi Z., Li X., Xue Z., Liang X., Lu W., Peng H., Liu H., Zeng S., Hao J., “Remarkable NIR enhancement of multifunctional nanoprobes for in vivo trimodal bioimaging and upconversion optical/T-2-weighted MRI-guided small tumor diagnosis,” Adv. Funct. Mater. 25(46), 7119–7129 (2015). 10.1002/adfm.201503672 [DOI] [Google Scholar]
- 30.Hudson H. M., Larkin R. S., “Accelerated image reconstruction using ordered subsets of projection data,” IEEE Trans. Med. Imaging 13(4), 601–609 (1994). 10.1109/42.363108 [DOI] [PubMed] [Google Scholar]
- 31.Yan G., Tian J., Zhu S., Qin C., Dai Y., Yang F., Dong D., Wu P., “Fast Katsevich algorithm based on GPU for helical cone-beam computed tomography,” IEEE Trans. Inf. Technol. Biomed. 14(4), 1053–1061 (2010). 10.1109/TITB.2009.2036368 [DOI] [PubMed] [Google Scholar]
- 32.Tian J., Xue J., Dai Y., Chen J., Zheng J., “A novel software platform for medical image processing and analyzing,” IEEE Trans. Inf. Technol. Biomed. 12(6), 800–812 (2008). 10.1109/TITB.2008.926395 [DOI] [PubMed] [Google Scholar]
- 33.He X., Liang J., Wang X., Yu J., Qu X., Wang X., Hou Y., Chen D., Liu F., Tian J., “Sparse reconstruction for quantitative bioluminescence tomography based on the incomplete variables truncated conjugate gradient method,” Opt. Express 18(24), 24825–24841 (2010). 10.1364/OE.18.024825 [DOI] [PubMed] [Google Scholar]
- 34.Yoo T. S., Ackerman M. J., Lorensen W. E., Schroeder W., Chalana V., Aylward S., Metaxas D., Whitaker R., “Engineering and algorithm design for an image processing API: A technical report on ITK - the insight toolkit,” in Medicine Meets Virtual Reality 02/10: Digital Upgrades: Applying Moores Law to Health, Westwood J. D., Hoffman H. M., Robb R. A., Stredney D., eds. (2002), pp. 586–592. [PubMed] [Google Scholar]
- 35.Liu J., Fan W., Liu M., Lin X., Wang Y., Wang F., Chen X., Cao F., Liang J., “Spatial vascular volume fraction imaging for quantitative assessment of angiogenesis,” Mol. Imaging Biol. 16(3), 362–371 (2014). 10.1007/s11307-013-0694-z [DOI] [PubMed] [Google Scholar]
- 36.Godavarty A., Eppstein M. J., Zhang C., Theru S., Thompson A. B., Gurfinkel M., Sevick-Muraca E. M., “Fluorescence-enhanced optical imaging in large tissue volumes using a gain-modulated ICCD camera,” Phys. Med. Biol. 48(12), 1701–1720 (2003). 10.1088/0031-9155/48/12/303 [DOI] [PubMed] [Google Scholar]
- 37.Hu Z., Liang J., Yang W., Fan W., Li C., Ma X., Chen X., Ma X., Li X., Qu X., Wang J., Cao F., Tian J., “Experimental Cerenkov luminescence tomography of the mouse model with SPECT imaging validation,” Opt. Express 18(24), 24441–24450 (2010). 10.1364/OE.18.024441 [DOI] [PubMed] [Google Scholar]
- 38.Liu H., Yang X., Song T., Bao C., Shi L., Hu Z., Wang K., Tian J., “Multispectral hybrid Cerenkov luminescence tomography based on the finite element SPn method,” J. Biomed. Opt. 20(8), 086007 (2015). 10.1117/1.JBO.20.8.086007 [DOI] [PubMed] [Google Scholar]
- 39.Ogawa M., Kosaka N., Choyke P. L., Kobayashi H., “In vivo molecular imaging of cancer with a quenching near-infrared fluorescent probe using conjugates of monoclonal antibodies and indocyanine green,” Cancer Res. 69(4), 1268–1272 (2009). 10.1158/0008-5472.CAN-08-3116 [DOI] [PMC free article] [PubMed] [Google Scholar]
- 40.Gallagher B. M., Ansari A., Atkins H., Casella V., Christman D. R., Fowler J. S., Ido T., MacGregor R. R., Som P., Wan C. N., Wolf A. P., Kuhl D. E., Reivich M., “Radiopharmaceuticals XXVII. 18F-labeled 2-deoxy-2-fluoro-d-glucose as a radiopharmaceutical for measuring regional myocardial glucose metabolism in vivo: tissue distribution and imaging studies in animals,” J. Nucl. Med. 18(10), 990–996 (1977). [PubMed] [Google Scholar]


