Abstract
In the present paper we show the optoacoustic (OA) response of two solutions of gold nanorods dispersed in distilled water (0.8 mg/ml) and hosted in tissue-like phantoms by using small arrays of HPDLs at 870 and 905 nm as excitation sources. The HPDLs are coupled to a 7-to-1 optical fiber bundle with output diameter of 675 μm. Each solution of gold nanorods exhibits an absorption peak close to the operating wavelength, i.e. ~860 nm and ~900 nm, respectively, to optimize the generation of OA signals. The phantoms are made of agar, intralipid and hemoglobin to simulate a soft biological tissue with reduced properties of scattering. Three 3-mm diameter tubes done in the phantoms at different depths (0.9 cm, 1.8 cm, and 2.7 cm) have been filled with gold nanorods. In this way, OA signals with appreciable SNR are generated at different depths in the phantoms. The high OA response exhibited by gold nanorods suggests their application in OA spectroscopy as exogenous contrast agents to detect and monitor emerging diseases like metastasis and arteriosclerotic plaques.
OCIS codes: (140.2010) Diode laser arrays; (060.2310) Fiber optics; (140.3298) Laser beam combining; (140.3510) Lasers, fiber; (110.5125) Photoacoustics
1. Introduction
The detection of cancer at early stages is necessarily important for preventing the growth of the cancer cell population within the corporeal organs in successive stages. Among all cancers, some of them are more statistically diffused and harmful. Breast cancer is one of the most diffused and differentiated kind of cancer in the world existing in a wide variety of forms [1]. This diversity makes the breast cancer detection and treatment very challenging for a future biomedical employment. Despite the many efforts for early detection of tumors, there is still inadequate technology for immediate application [2]. The most classical x-ray mammography does not provide an adequate differentiation between benign and malign tumors and is also risky for the health of the patients since it uses ionizing radiation [3]. Ultrasonic and optical imaging techniques have been successfully demonstrated a high specificity in differential diagnosis of malignant and benign tumors and are absolutely harmless to human body [4,5]. Ultrasonic imaging has high resolution combined with a high penetration depth, but the contrast between the tumor and the healthy tissues is not appropriately enough [6]. Optical imaging offers good spatial resolution but is limited to a few millimeters in biological tissues [7]. In this regard, optoacoustic tomography (OAT) and microscopy (OAM) have been developed as non-invasive alternatives to the existing imaging techniques, due to their ability of acquiring high-resolution images from deep tissues by using non-ionizing laser radiation [8,9]. They combine the good spatial resolution and the high penetration depth of ultrasonic imaging with the strong optical absorption contrast of optical imaging for functional cancer detection at early stages [10–13]. OA techniques exploit the detection of ultrasound waves generated from a biological chromophore (such as hemoglobin, deoxyhemoglobin, melanin, fat and water) that absorbs laser energy at a specific wavelength, normally in the near-infrared (NIR) window where the water absorption and tissue scattering are low. The strength of the OA techniques is the ability to obtain physiological information of the sample under study by means of a differential spectral characterization of the absorbance of the chromophores [14]. Techniques based on OA effect can provide 3D images of optical absorption maps in biological tissues in-vivo [15,16].
The support of contrast agents targeted to specific tissues of human body is necessary to enhance the OA imaging (OAI) efficiency for cancer diagnostics. For this purpose, contrast agents based on nanoparticles are potentially beneficial for improving biomedical in-vivo diagnostics and their synthetization has ascended in the biotechnology industry. The growing interest in the use of nanostructures for biomedical applications has stimulated the development of new techniques for the synthesis of gold nanoparticles (GNPs), allowing them to be manipulated in both size and geometry with the aim to achieve certain optical properties [17–20]. Gold nanorods with high optical density (O.D.) are considered as a potential contrast agent for discrimination and targeting of cancer and other diseases in OAI [21–25], since their absorption peaks can be adjusted to the emission wavelength of the laser source by varying their dimensions at nanoscale. Generally, the characteristics of nanoparticles allow a preferential accumulation within cancerous tissues instead of healthy tissues, with the aim of providing enhanced image contrast.
Commonly, most OAI systems utilize expensive and bulky lasers for optical excitation, such as passively Q-switched Nd:YAG lasers. Additionally, to realize functional imaging, complex wavelength-tunable laser sources such optical parametric oscillators (OPO) are usually employed as additional instruments. Pulsed HPDLs are very attractive for OAI applications for their advantages compared to solid state lasers, such as passively Q-switched Nd:YAG lasers and OPO systems. In fact, they offer higher repetition rates (KHz vs. a few Hz) for functional OAI, more compact sizes which enable reduction of OA instrumentation to a portable size, reduced costs, and compatibility with optical fibers [26–29]. The main issue of HPDLs is their peak power limitation, normally in the range of ~100 W, which limits the energy per pulse in the ns range to a few tens of µJ, compared to mJ level in the case of solid state lasers. This in turn limits the strength of the OA signal and the depth of three-dimensional OAI.
Previous study [30] reported a spectroscopic investigation between 410 nm and 1000 nm of gold nanorods located in a highly scattering medium using a tunable laser source based on Q-switched Nd:YAG-pumped optical parametric oscillator (OPO).
In previous work [31] we calculated the absorption coefficient of some graphene-based solutions with a concentration of 25 mg/mL and we measured the OA signals using HPDLs sources at 905 nm. In that case, the main issue was the high concentration of the abovementioned solutions that requires reduction for real OA applications to biological in-vivo samples. Analogously, in this work we give particular emphasis to the OA response of two colloidal solutions of gold nanorods with low concentration (0.8 mg/ml in distilled water) and O.D. of 20 at ~860 nm and ~900 nm, respectively. We first measure their absorbance spectrum between 400 nm and 1100 nm using a commercial spectrophotometer and in a second stage we use a dual-wavelength laser system based on two triplets of HPDLs at 870 nm and 905 nm coupled to a 675-nm fiber bundle to generate detectable OA signals from 3-mm inclusions of gold nanorods hosted in tissue-like phantoms at different depths (i.e. 0.9 cm, 1.8 cm, and 2.7 cm) from the surface of the phantom exposed to laser radiation. At each wavelength we use a solution of gold nanorods with absorption peak close to the operating wavelength (i.e. ~860 nm and ~900 nm) for a better OA signal generation. The phantoms are composed of agar, intralipid and hemoglobin to simulate the optical behavior of a soft tissue. OA signals with appreciable SNR are generated from the different inclusions in the phantoms. Results indicate a reduction of ~58% and ~59% of the OA signal at 870 nm and 905 nm, respectively, from the inclusion located at 2.7 cm to the inclusion located at 0.9 cm of depth. The OA signal of the 0.9-cm deep inclusion is still significant with respect to the noise level, i.e. 10.9 dB and 14.9 dB at 870 nm and 905 nm, respectively. In a real scenario, the gold nanorods represent an exogenous contrast agent applied in a specific biological tissue to detect and monitor diseases like metastasis and arteriosclerotic plaques, or chromophores such as oxyhemoglobin, deoxyhemoglobin, melanin or lipid.
The paper is organized as follows: Section 2 describes the characteristics of gold nanorods and the OA setup used in our experiments, Section 3 discusses the results and Section 4 the conclusions.
2. Materials and methods
In this section we describe the characteristics of the gold nanorods solutions and the OA setup used in our experiments, reporting the details of each single element.
2.1. Absorbance spectrum of gold nanorods
We characterized the absorbance spectrum of two pure solutions of gold nanorods with absorbance peak (O.D. = 20) at ~860 nm and ~900 nm, respectively, over the spectral range between 410 and 1100 nm by using a Lambda 14P, Perkin Elmer (Fig. 1).
Fig. 1.
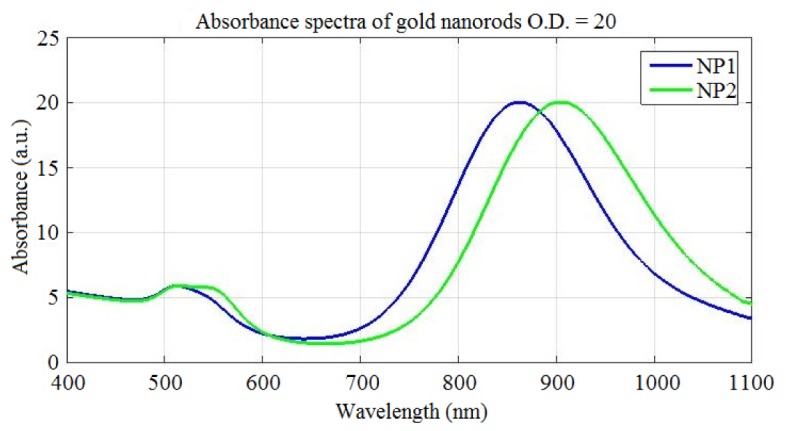
Absorbance spectra of two colloidal solutions of gold nanorods (O.D. = 20) with peak at: ~860 nm (in blue) and ~900 nm (in red). The solutions have been diluted with a factor of 20 before measurements.
The main characteristics of the gold nanorods are reported in Table 1. We call “NP1” the gold nanorods with absorbance peak at ~860 nm, and “NP2” the gold nanorods with absorbance peak at ~900 nm. At 870 nm and 905 nm the corresponding absorption coefficients are ~19.89 and ~19.97, respectively. The corresponding absorption coefficients can be calculated by the following equation:
| (1) |
which in our case are ~45.81 cm−1 and ~45.99 cm−1 at 870 nm and 905 nm, respectively. In order to avoid the liquid leakage that would alter the measurements, the bottles of gold nanorods have been sealed up with parafilm after every usage.
Table 1. Main characteristics of the gold nanorods.
| Characteristics | NP1 | NP2 |
|---|---|---|
| Width | 10.8 ± 0.9 nm | 11.7 ± 0.8 nm |
| Length | 49.6 ± 3.2 nm | 56.3 ± 4.2 nm |
| Aspect ratio | 4.6 | 4.8 |
| Longitudinal peak | 858 nm | 900 nm |
| Transverse peak | 513 nm | 516 nm |
| Particle concentration | 1.3 x 10¹³ per ml | 9.9 x 10¹³ per ml |
| Mass concentration (Au) | 0.9 mg/mL | 0.8 mg/mL |
| Total volume | 10 mL | 10 mL |
2.2. Optoacoustic setup
The excitation system is composed of two triplets of pulsed HPDLs: one with central wavelength at 870 nm (L11348-330-04, Hamamatsu Photonics) and the other one at 905 nm (SPL PL90_3, OSRAM Opto Semiconductors GmbH), driven by the corresponding diode laser drivers PCO-7120 (IXYS Colorado). Table 2 summarizes the characteristics of HPDLs used in the experiments. The optical pulses emitted by each triplet of HPDLs are perfectly synchronized. The output of each HPDL is combined side-by-side to a 675-μm fiber bundle produced in-house, composed of seven multimode optical fibers (FT200EMT from Thorlabs) disposed in hexagonal configuration, each with a 200-μm-core diameter and a numerical aperture of 0.39 (Fig. 2). Light emitted by each HPDL is conveyed in the corresponding small lens system formed by a collimating lens (focal length f1 = 6.24 mm) and a focusing lens (focal length f2 = 3.1 mm) with anti-reflecting coatings and then is coupled to one of the 200-μm-core-diameter optical fibers using an xyz translation mount (Thorlabs) for optimal alignment (Figs. 3 and 4), since they have different beam active areas that affect the beam divergence.
Table 2. Characteristics of the 870-nm and 905-nm HPDLs.
| Characteristics | 870-nm HPDL | 905-nm HPDL |
|---|---|---|
| Peak power (max) | 90 W | 90 W |
| Forward current (max) | 35 A | 40 A |
| Pulse width (max) | 100 ns | 100 ns |
| Duty cycle (max) | 0.075% | 0.1% |
| Wavelength (typ.) | 870 nm | 905 nm |
| Aperture size | 300 µm × 10 µm | 200 µm × 10 µm |
| Divergence angles | 10°, 24° | 9°, 25° |
Fig. 2.
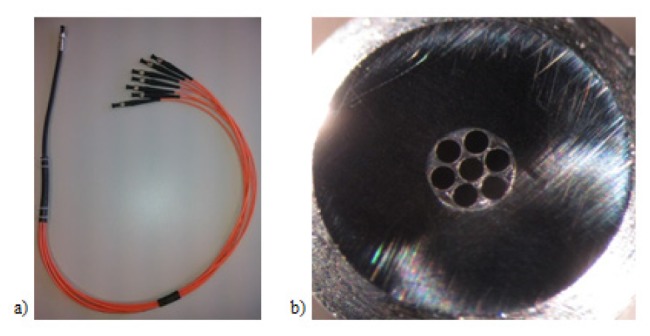
A 675-μm-diameter fiber bundle composed of seven 200-μm-core-diameter optical fibers: (a) Top view; (b) Output end of the fiber bundle seen under a microscope.
Fig. 3.
Light emitted by each diode laser is coupled to a 200-μm optical fiber by collimating and focusing lenses in an xyz translator mount: (a) Front view; (b) Top view.
Fig. 4.
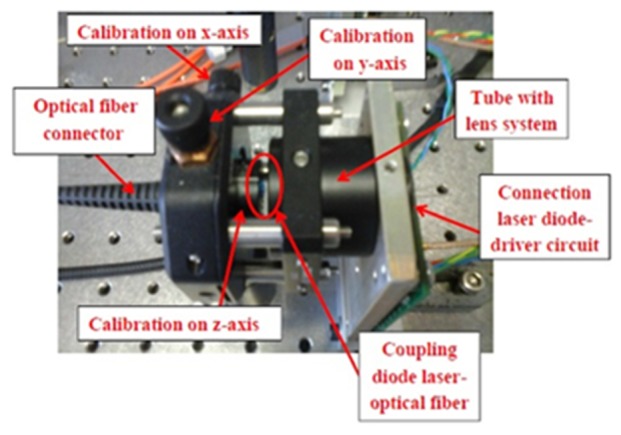
The beam emitted by the HPDL is coupled to an optical fiber using a three-axial translator to optimize the light transfer into the optical fiber.
The characteristics of the lens systems used in the OA setup are summarized in Table 3.
Table 3. Characteristics of the lens systems used in the OA setup with the corresponding magnifications.
| Component | Focal length | Magnification |
|---|---|---|
| Collimating lens 1 | 6.24 mm | 0.5 |
| Focusing lens 1 | 3.1 mm | |
| Collimating lens 2 | 2 mm | 12.7 |
| Focusing lens 2 | 25.4 mm |
Therefore, the optical magnification is M1 = f2/f1 ≈0.5. In order to uniformly collimate the output of the fiber bundle, a secondary lens system is used to properly focus the light beam into a spot (Fig. 5). This lens system has been chosen to minimize the power losses (collimating lens f3 = 2 mm, focusing lens f4 = 25.4 mm). Consequently, the circular light spot emerging from the fiber bundle is magnified, with M2 = f4/f3 ≈12.7.
Fig. 5.
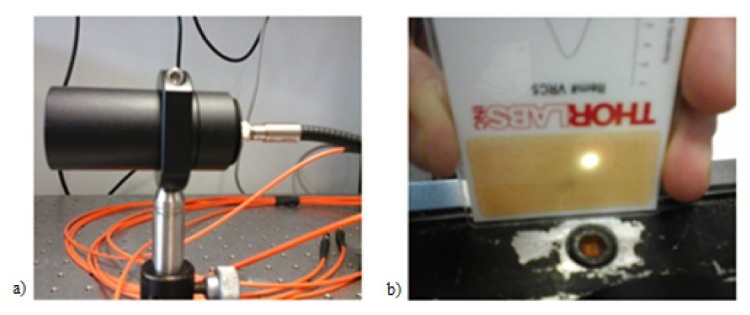
(a) A secondary lens system used to focus the light beam into a spot; (b) Image of the light spot (3 mm2) in the focal plane.
The OA signals generated are detected by a 1-MHz piezoelectric transducer and then amplified by a 40-dB amplifier to be visualized on the oscilloscope. For all the OA measurements, we use a pulse width of 95 ns and a repetition rate of 1 kHz (duty cycle of 0.0095%). Assuming rectangular 95 ns pulses, the two triplets of HPDLs provide total pulse energies of ~12.45 µJ and ~12.17 µJ at 870 nm and 905 nm, respectively, to the gold nanorods solutions chosen as samples. We used pulses of 95 ns to optimize the energy per pulse delivered to the sample, since it is proportional to the pulse width. A higher energy per pulse contribution would mean a better OA signal generation.
The average power measured at the output of the second lens system is ~12.45 mW and ~12.17 mW at 870 nm at 905 nm, respectively. The light spot area is 3 mm2 in both cases. Accordingly, the respective total pulse energy densities are ~4.15 μJ/mm2 and ~4.06 μJ/mm2, and the total peak power delivered to the sample is ~131 W at 870 nm and ~128 W at 905 nm.
Table 4 summarizes the characteristics of the optical pulses used for excitation of OA signals. The alignment between the light output, the phantom, and the piezoelectric transducer is necessary to efficiently generate OA signals from the gold nanorods inclusions (Fig. 6). One important aspect to consider prior to OA measurements is the characterization of the optical scattering of the phantom. Table 5 shows the physical characteristics of the phantoms and Table 6 reports their scattering coefficients at 870 nm and 905 nm, calculated by the following equation:
| (2) |
where is the average power transmitted through the phantom and is the direct average power at the output of the second lens system (see Table 4). The estimated spatial resolution limit for OAI would be , where is the speed of sound in the phantom (~0.9 mm/) and is the pulse width [32,33].
Table 4. Characteristics of optical pulses used for excitation of OA signals at 870 nm and 905 nm, respectively.
| Parameter | 870-nm HPDLs | 905-nm HPDLs |
|---|---|---|
| Pulse width | 95 ns | 95 ns |
| Repetition frequency | 1 kHz | 1 kHz |
| Duty cycle | 0.0095% | 0.0095% |
| Total pulse energy | 12.45 µJ | 12.17 µJ |
| Total average power | 12.45 mW | 12.17 mW |
| Light spot area | 3 mm2 | 3 mm2 |
| Total pulse energy density | 4.15 μJ/mm2 | 4.06 μJ/mm2 |
| Total peak power delivered to sample | 131 W | 128 W |
Fig. 6.
Alignment between the light output, the phantom, and the piezoelectric transducer.
Table 5. Geometrical characteristics of the phantoms used in the measurements.
| Characteristics | Value |
|---|---|
| Material | Agar, intralipid and hemoglobin |
| Size | 2.2 × 3.6 × 2.2 cm3 (thickness x width x height) |
| Volume of the hole filled with gold nanorods (0.8 mg/mL in distilled water) | 134 mm3 |
| Hole diameter | 3 mm |
Table 6. Scattering coefficients of the phantoms at 870 nm and 905 nm. The values are 10-100 times less than in the biological tissues [34].
| Wavelength | Scattering coefficient of phantoms |
|---|---|
| 870 nm | 1.03 cm−1 |
| 905 nm | 1.18 cm−1 |
In principle, the combination of multiple HPDLs improves the OA signal-to-noise ratio (SNR), following the formula:
| (3) |
where SNRT is the total signal-to-noise ratio, SNRS is the signal-to-noise ratio of a single HPDL, and N is the number of devices. In our case N = 3 for each wavelength. To calculate the SNR of the OA signals detected, we use the following equation:
| (4) |
3. Results
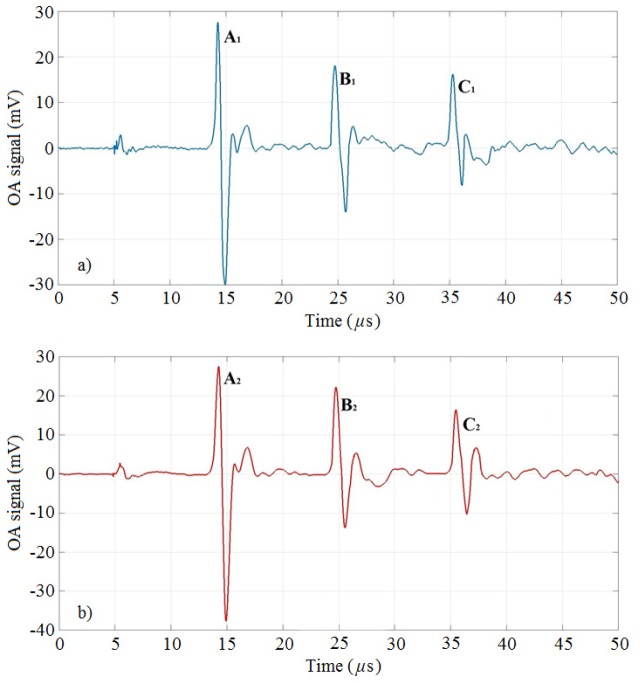
To demonstrate the possibility of generation of detectable OA signals, three 3-mm diameter tubes (called A, B, C) done in tissue-like phantoms at different depths (2.7 cm, 1.8 cm, and 0.9 cm) have been filled with gold nanorods with absorption peak at ~860 nm and ~900 nm, respectively (see Section 2.1). The phantoms have been made of agar, intralipid and hemoglobin to mimic a soft biological tissue. Two sets of three HPDLs operating at 870 nm and 905 nm (see Section 2.2) have been used as excitation sources to detect OA signals from the gold nanorods NP1 and NP2, respectively. Figure 7 depicts the OA signals generated from NP1 at 870 nm and the OA signals generated from NP2 at 905 nm, considering the conditions reported in Table 4. The amplitudes of the OA signals generated at each wavelength are reported in Table 7 for each inclusion. In parenthesis are reported the reductions of the OA signals with respect to the signals from inclusion A, expressed in percentile. The reduction is significant in both cases (~58% and ~59%) because of the distance of inclusion C from the transducer, but the signals keep an appreciable SNR, i.e. 10.9 dB and 14.9 dB, respectively (Table 9). Table 8 shows the maximum noise amplitude at each wavelength. The role of gold nanorods is to show their properties of contrast agent in a real OA scenario to help the detection of chromophores.
Fig. 7.
OA signals from gold nanorods inclusions of 3-mm diameter hosted in the phantoms. The signals are labeled with the letters A, B, C for each case: a) NP1 at 870 nm, b) NP2 at 905 nm.
Table 7. Optoacoustic signals from gold nanorods in each tube. The tubes are labeled with letters A, B, and C.
| OA signal | |||
|---|---|---|---|
| Inclusion | Depth | 870-nm | 905-nm |
| A | 2.7 cm | 57.56 mV | 65.15 mV |
| B | 1.8 cm | 32.11 mV (- 44.2%) |
35.91 mV (- 44.9%) |
| C | 0.9 cm | 24.33 mV (−58%) |
26.55 mV (−59%) |
Table 9. Signal-to-noise ratio calculated for each OA signal.
| Signal-to-noise ratio from gold nanorods inclusions | |||
|---|---|---|---|
| Wavelength | Inclusion A | Inclusion B | Inclusion C |
| 870-nm | 18.4 dB | 13.4 dB | 10.9 dB |
| 905-nm | 22.7 dB | 17.5 dB | 14.9 dB |
Table 8. Maximum noise amplitude detected at 870 nm and 905 nm with gold nanorods hosted in phantoms.
| Wavelength | Maximum noise amplitude |
|---|---|
| 870 nm | 6.9 mV |
| 905 nm | 4.8 mV |
The proposed dual-wavelength OA system based on small arrays of HPDLs is demonstrated to produce detectable OA signals from gold nanorods hosted in small phantoms by applying relatively low optical power (see Table 4). Since the amplitude of the OA signal is almost linearly proportional to the amount of optical power applied, by increasing the number of the emitters we should be able to detect OA signals using phantoms with higher scattering coefficient and larger size. Additionally, Eq. (4) would return larger values that would consent an efficient optoacoustic imaging. Figure 8 plots the amplitude of the OA signals in function of the depth (see Table 7 as reference) at 870 nm and 905 nm.
Fig. 8.
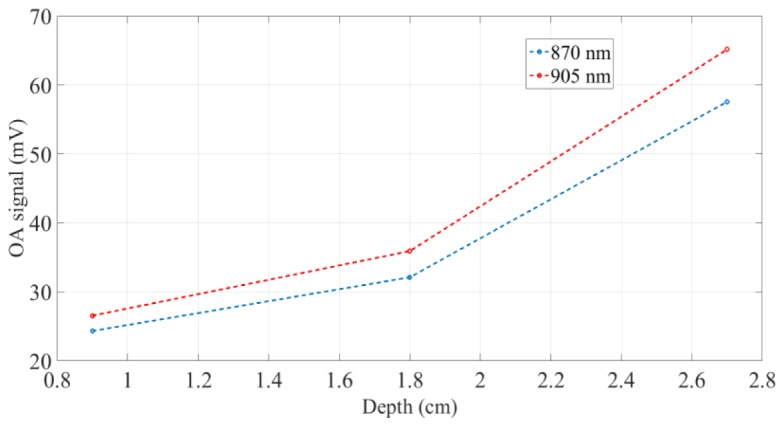
Amplitude of the OA signals at 870 nm and 905 nm in function of the depth in the phantom.
The amplitudes of the OA signals present two slopes: between 0.9 cm and 1.8 cm of depth they exhibit a slow increase, while between 1.8 cm and 2.7 cm their intensification is significantly higher.
4. Conclusions
We have presented the optoacoustic response of small inclusions of gold nanorods hosted at different depths in tissue-like phantoms exposed to laser light. We used a dual-wavelength laser system based on small arrays of high-power diode lasers at 870 and 905 nm to generate optoacoustic signals. The high-power diode lasers have been coupled to 200-μm optical fibers collected in a 7-to-1 675-μm fiber bundle. Results have showed that the gold nanorods presented in this paper, combined with the high-power diode laser radiation, are able to generate detectable optoacoustic signals with significant SNR compared to the noise level. By increasing the power level with the addition of more high power diode lasers sources, we should be able to achieve higher optoacoustic signals. In such a way, an optoacoustic system based on large arrays of high power diode lasers would be functional for optoacoustic imaging applications, but the compactness and the costs of the system would be negatively affected. In this regard, future research developments should be addressed to add new near-infrared wavelengths to the diode laser-based systems for optoacoustic spectroscopy applications (i.e. 808, 940, and 980 nm), but the major issue is represented by their physical implementation. However, the size and the cost of the optoacoustic systems can be optimized using diode laser bars and stacks, since they collect large numbers of diode laser emitters in a small space (~1 cm) with a significant amount of optical power generated, but they require complex optical systems to collimate and focus the beam in small spots. The high optoacoustic response of the gold nanorods makes them potential candidates for optoacoustic detection and mapping of metastasis, molecules and microorganisms. These biomedical applications require a multi-spectral imaging of the targets with a consistent quantity of optical power.
Acknowledgments
This research is part of OILTEBIA project (Optical Imaging and Laser TEchniques for BIomedical Applications), whch is an Initial Training Network (ITN) funded by the European Community's Seventh Framework Programme, Grant Agreement Number 317526.
References and links
- 1.Sun K., Chen X., Chai W., Fei X., Fu C., Yan X., Zhan Y., Chen K., Shen K., Yan F., “Breast cancer: diffusion Kurtosis MR imaging—diagnostic accuracy and correlation with clinical-pathologic factors,” RSNA Radiology 277(1), 46 (2015). [DOI] [PubMed] [Google Scholar]
- 2.Priya M., Rao B. S. S., Chandra S., Ray S., Mathew S., Datta A., Nayak S. G., Mahato K. K., “Photoacoustic spectroscopy based investigatory approach to discriminate breast cancer from normal: a pilot study,” Proc. SPIE 9689, 968943 (2016). [Google Scholar]
- 3.Raftery J., Chorozoglou M., “Possible net harms of breast cancer screening: updated modelling of Forrest report,” British Dental Journal 212(129), 8 (2012). [DOI] [PMC free article] [PubMed] [Google Scholar]
- 4.Wells P. N. T., “Ultrasonic imaging of the human body,” Rep. Prog. Phys. 62(5), 671–722 (1999). 10.1088/0034-4885/62/5/201 [DOI] [Google Scholar]
- 5.Leff D. R., Warren O. J., Enfield L. C., Gibson A., Athanasiou T., Patten D. K., Hebden J., Yang G. Z., Darzi A., “Diffuse optical imaging of the healthy and diseased breast: a systematic review,” Breast Cancer Res. Treat. 108(1), 9–22 (2008). 10.1007/s10549-007-9582-z [DOI] [PubMed] [Google Scholar]
- 6.Herment A., Guglielmi J. P., Dumee P., Peronneau P., Delouche P., “Limitations of ultrasound imaging and image restoration,” Ultrasonics 25(5), 267–273 (1987). 10.1016/0041-624X(87)90048-5 [DOI] [PubMed] [Google Scholar]
- 7.Kozacki T., Kujawińska M., Kniażewski P., “Investigation of limitations of optical diffraction tomography,” Opto-Electron. Rev. 15(2), 102–109 (2007). 10.2478/s11772-007-0006-8 [DOI] [Google Scholar]
- 8.Filimonova T. A., Volkov D. S., Proskurnin M. A., Pelivanov I. M., “Optoacoustic spectroscopy for real-time monitoring of strongly light-absorbing solutions in applications to analytical chemistry,” Photoacoustics 1(3-4), 54–61 (2013). 10.1016/j.pacs.2013.08.002 [DOI] [PMC free article] [PubMed] [Google Scholar]
- 9.Zhang H. F., Maslov K., Stoica G., Wang L. V., “Functional photoacoustic microscopy for high-resolution and noninvasive in vivo imaging,” Nat. Biotechnol. 24(7), 848–851 (2006). 10.1038/nbt1220 [DOI] [PubMed] [Google Scholar]
- 10.L. V. Wang, “Photoacoustic tomography: high-resolution imaging of optical contrast in vivo at new depths,” IEEE LEOS Annual Meeting Conference Proceedings 343 (2009). 10.1109/LEOS.2009.5343227 [DOI] [Google Scholar]
- 11.Xia J., Yao J., Wang L. V., “Photoacoustic tomography: principles and advances,” Electromagn Waves (Camb) 147, 1–22 (2014). 10.2528/PIER14032303 [DOI] [PMC free article] [PubMed] [Google Scholar]
- 12.Yao J., Wang L. V., “Photoacoustic Microscopy,” Laser Photonics Rev. 7(5), 758–778 (2013). 10.1002/lpor.201200060 [DOI] [PMC free article] [PubMed] [Google Scholar]
- 13.Wang L. V., “Multiscale photoacoustic microscopy and computed tomography,” Nat. Photonics 3(9), 503–509 (2009). 10.1038/nphoton.2009.157 [DOI] [PMC free article] [PubMed] [Google Scholar]
- 14.Ball D. W., “Photoacoustic spectroscopy,” Spectroscopy (Springf.) 21(9), 1975 (2006). [Google Scholar]
- 15.Lutzweiler C., Razansky D., “Optoacoustic Imaging and Tomography: Reconstruction Approaches and Outstanding Challenges in Image Performance and Quantification,” Sensors (Basel) 13(6), 7345–7384 (2013). 10.3390/s130607345 [DOI] [PMC free article] [PubMed] [Google Scholar]
- 16.Kruger R. A., Kuzmiak C. M., Lam R. B., Reinecke D. R., Del Rio S. P., Steed D., “Dedicated 3D photoacoustic breast imaging,” Med. Phys. 40(11), 113301 (2013). 10.1118/1.4824317 [DOI] [PMC free article] [PubMed] [Google Scholar]
- 17.Li W., Chen X., “Gold nanoparticles for photoacoustic imaging,” Nanomedicine (Lond.) 10(2), 299–320 (2015). 10.2217/nnm.14.169 [DOI] [PMC free article] [PubMed] [Google Scholar]
- 18.Huang X., El-Sayed M. A., “Gold nanoparticles: Optical properties and implementations in cancer diagnosis and photothermal therapy,” J. Adv. Res. 1(1), 13–28 (2010). 10.1016/j.jare.2010.02.002 [DOI] [Google Scholar]
- 19.Kim J., Park S., Lee J. E., Jin S. M., Lee J. H., Lee I. S., Yang I., Kim J.-S., Kim S. K., Cho M.-H., Hyeon T., “Designed fabrication of multifunctional magnetic gold nanoshells and their application to magnetic resonance imaging and photothermal therapy,” Angew. Chem. Int. Ed. Engl. 45(46), 7754–7758 (2006). 10.1002/anie.200602471 [DOI] [PubMed] [Google Scholar]
- 20.Huang X., El-Sayed I. H., El-Sayed M. A., “Applications of gold nanorods for cancer imaging and photothermal therapy,” Methods in Molecular Biology 624, 343–357 (2010). [DOI] [PubMed] [Google Scholar]
- 21.Zharov V.P., Galanzha E.I., Shashkov E.V., Kim J.W., Khlebtsov N.G., Tuchin V.V., “Photoacoustic flow cytometry: Principle and application for real-time detection of circulating single nanoparticles, pathogens, and contrast dyes in vivo,” J. Biomed. Opt. 12(5), 051503 (2007). [DOI] [PubMed] [Google Scholar]
- 22.Galanzha E. I., Shashkov E. V., Tuchin V. V., Zharov V. P., “In vivo multispectral, multiparameter, photoacoustic lymph flow cytometry with natural cell focusing, label-free detection and multicolor nanoparticle probes,” Cytometry A 73(10), 884–894 (2008). 10.1002/cyto.a.20587 [DOI] [PMC free article] [PubMed] [Google Scholar]
- 23.Galanzha E. I., Kokoska M. S., Shashkov E. V., Kim J. W., Tuchin V. V., Zharov V. P., “In vivo fiber photoacoustic detection and photothermal purging of metastasis targeted by nanoparticles in sentinel lymph nodes at single cell level,” J. Biophotonics 2, 528–539 (2009). 10.1002/jbio.200910046 [DOI] [PMC free article] [PubMed] [Google Scholar]
- 24.Song K. H., Kim C., Cobley C. M., Xia Y., Wang L. V., “Near-infrared gold nanocages as a new class of tracers for photoacoustic sentinel lymph node mapping on a rat model,” Nano Lett. 9(1), 183–188 (2009). 10.1021/nl802746w [DOI] [PMC free article] [PubMed] [Google Scholar]
- 25.Song K. H., Kim C., Maslov K., Wang L. V., “Noninvasive in vivo spectroscopic nanorod-contrast photoacoustic mapping of sentinel lymph nodes,” Eur. J. Radiol. 70(2), 227–231 (2009). 10.1016/j.ejrad.2009.01.045 [DOI] [PMC free article] [PubMed] [Google Scholar]
- 26.Kolkman R. G. M., Steenbergen W., van Leeuwen T. G., “In vivo photoacoustic imaging of blood vessels with a pulsed laser diode,” Lasers Med. Sci. 21(3), 134–139 (2006). 10.1007/s10103-006-0384-z [DOI] [PubMed] [Google Scholar]
- 27.Allen T. J., Beard P. C., “Pulsed near-infrared laser diode excitation system for biomedical photoacoustic imaging,” Opt. Lett. 31(23), 3462–3464 (2006). 10.1364/OL.31.003462 [DOI] [PubMed] [Google Scholar]
- 28.Zeng L.M., Liu G.D., Yang D.W., Ji X.R., “Portable optical-resolution photoacoustic microscopy with a pulsed laser diode excitation,” Appl. Phys. Lett. 102(5), 053704 (2013). [Google Scholar]
- 29.Daoudi K., van den Berg P. J., Rabot O., Kohl A., Tisserand S., Brands P., Steenbergen W., “Handheld probe integrating laser diode and ultrasound transducer array for ultrasound/photoacoustic dual modality imaging,” Opt. Express 22(21), 26365–26374 (2014). 10.1364/OE.22.026365 [DOI] [PubMed] [Google Scholar]
- 30.Cunningham V., Lamela H., “Laser optoacoustic spectroscopy of gold nanorods within a highly scattering medium,” Opt. Lett. 35(20), 3387–3389 (2010). 10.1364/OL.35.003387 [DOI] [PubMed] [Google Scholar]
- 31.L. Leggio, D. C. Gallego, S. B. Gawali, E. Dadrasnia, M. Sánchez, S. Rodríguez, M. González, G. Carpintero, M. Osiński, and H. Lamela, “Optoacoustic response from graphene-based solutions embedded in optical phantoms by using 905-nm high-power diode-laser assemblies,” SPIE Proc. 9708, 97083M (12 pp.), (2016). [Google Scholar]
- 32.Wang L. V., Hu S., “Photoacoustic tomography: in vivo imaging from organelles to organs,” Science 335(6075), 1458–1462 (2012). 10.1126/science.1216210 [DOI] [PMC free article] [PubMed] [Google Scholar]
- 33.Xu M., Wang L. V., “Photoacoustic imaging in biomedicine,” Rev. Sci. Instrum. 77(4), 041101 (2006). 10.1063/1.2195024 [DOI] [Google Scholar]
- 34.Jacques S. L., “Optical properties of biological tissues: a review,” Phys. Med. Biol. 58(11), R37–R61 (2013). 10.1088/0031-9155/58/11/R37 [DOI] [PubMed] [Google Scholar]


