

Abstract
Application of nanotechnology for biomedicine in cancer therapy allows for direct delivery of anticancer agents to tumors. An example of such therapies is the nanoparticle-mediated near-infrared hyperthermia treatment. In order to investigate the influence of nanoparticle properties on the spatial distribution of heat in the tumor and healthy tissues, accurate simulations are required. The Geant4 Application for Emission Tomography (GATE) open-source simulation platform, based on the Geant4 toolkit, is widely used by the research community involved in molecular imaging, radiotherapy and optical imaging. We present an extension of GATE that can model nanoparticle-mediated hyperthermal therapy as well as simple heat diffusion in biological tissues. This new feature of GATE combined with optical imaging allows for the simulation of a theranostic scenario in which the patient is injected with theranostic nanosystems that can simultaneously deliver therapeutic (i.e. hyperthermia therapy) and imaging agents (i.e. fluorescence imaging).
OCIS codes: (170.0170) Medical optics and biotechnology, (170.3660) Light propagation in tissues, (170.4580) Optical diagnostics for medicine, (350.0350) Other areas of optics, (350.5340) Photothermal effects, (160.0160) Materials, (160.4236) Nanomaterials
1. Introduction
Standard cancer therapy is invasive, painful and its side effect and toxicity impact patient’s life [1]. An ideal therapy assumes that the anticancer agent only destroys the tumor cells allowing for normal tissue to remain unaffected. Unfortunately, cumulative toxicity in healthy tissue cannot be avoided. An innovative application of nanotechnology for biomedicine in cancer therapy [2] allows researchers to deliver anticancer agents directly to tumors and target treatments to individual cancer cells. Cancer cells show signs of apoptosis when they are exposed to temperatures that reach 41–47°C; for temperatures above 50°C cell proteins are denaturated [3]. This fact is put into practice in hyperthermal therapy using light-absorbing nanoparticles preferentially localised inside the tumor. This minimally invasive approach to cancer treatment uses nanoparticles that will induce a temperature increase in the tumor when light (i.e. laser) is applied. There have been many in vivo demonstrations of the use of nanoparticles in hyperthermal therapy and diagnostic imaging leading to promising results. Popp et al. [4] have shown that the average mice murine melanoma tumor volume decreases after gold nanorods injection and near-infrared light treatment. Gold nanorods are promising hyperthermia agents for in vivo photothermal ablation of solid tumors in xenografted mouse tumor model [5] or deep-tissue malignancies [6]. Hirsch et al. [7] have shown that exposure to low doses of near-infrared light in solid tumors treated with metal nanoshells reached temperatures capable of inducing irreversible tissue damage. Gobin et al. [8] reported that the use of near-infrared nanoshells significantly increases optical contrast in mice tumors for optical coherence tomography and allows photothermal ablation of tumors with increased survival. A clinical trial for nanoparticle-mediated hyperthermia has already been conducted [9] and involved magnetic nanoparticles combined with radiation therapy for treatment of patients with recurrent malignant glioma. Patients were exposed to an alternating magnetic field to induce particle heating. A human clinical pilot study of commercialized gold nanoshells (AuroShell) is currently ongoing [10]. Patients with refractory and/or recurrent head and neck tumors have been enrolled and will be treated with an infusion of AuroShell particles followed by laser illumination for photothermal ablation of target lesions. Despite the numerous cellular (in vitro) and animal (in vivo) studies that have been performed (see [11] for a gastrointestinal cancer review), conducting clinical trials regarding photothermal therapy using nanoparticles remains very challenging because quantitation and control of hyperthermal effects depend on many factors such as the nanoparticle optical and thermal properties, the biodistribution within the tumor [12] and the biological tissues and light illumination properties. In order to investigate the influence of these parameters on the spatial distribution of heat in the tumor and healthy tissues, simulations are required, similarly to their use in dosimetry and treatment planning for radiative approaches. One of the main risks of nanoparticle-mediated near-infrared laser ablation in the treatment of tumor is damaging the healthy tissue around the tumor. Experimental data are mandatory in order to validate simulations of the temperature increase within the tumor and surrounding tissues and select the most promising laser settings and gold nanoparticle concentration [13,14]. Several thermal simulation tools have been developed in software packages for clinical hyperthermia [15]. The visualizer for electromagnetic dosimetry and optimization software (VEDO) [16] has been designed to simulate realistic electromagnetic thermal therapy for cancer [17, 18]. Available simulation softwares for ultrasound hyperthermia planning include Field II [19, 20], Focus [21] and k-wave [22]. A physics interface for the bioheat equation is provided in the heat transfer module of the licence based COMSOL Multiphysics [23] simulation code in which the light propagation is modeled using the finite element method; therefore the result precision and computing time depend on the grid size. The propagation of photons in COMSOL is described using the diffusion approximation of the radiation transport equation, which is limited to systems where reduced scattering coefficients are much larger than their absorption coefficients. Diffusion approximation and Kubelka-Munk model (propagation of light through a diffuse scattering medium with no absorpion) are based on assumptions that are often not true for light scattering in tissues during phototherapy [24]. Light propagation in biological tissues using Monte-Carlo simulation could provide more accurate results than the analytical method using diffusion approximation if we consider multi-layered systems with non negligible absorption coefficients. The Geant4 Application for Emission Tomography (GATE) open-source simulation platform, based on the Geant4 toolkit, has been developed since 2001 [25–27] by the OpenGATE collaboration (www.opengatecollaboration.org) and is currently widely used by the research community involved in molecular imaging, radiotherapy and optical imaging. We present an extension of GATE so that it can model nanoparticle-mediated hyperthermal therapy as well as simple heat diffusion in any material or biological tissue assigned with optical and thermal properties. The advantage of using GATE is the possibility to simultaneously model accurate optical photon transport in tissues (using precise scattering models such as Rayleigh and Mie and boundary effects in complex geometries) and thermal therapy. In addition to these new developments, the modeling of theranostic scenario using GATE is implicit as nanoparticles can be described as a hyperthermia agent as well as a diagnostic probe (i.e. fluorophore, positron emitter) which can be used for tumor imaging (i.e. optical imaging, Positron Emission Tomography). There is currently no integrated software platform allowing for the in silico simulation of theranostic scenarios involving hyperthermia that could help for designing, optimizing, testing and validating protocols targeting different realistic clinical applications.
2. Theory
Hyperthermia is a cancer therapy in which the tumor is heated in the temperature range of 40–50°C. It has been demonstrated that cancer cells within the tumoral environment are more vulnerable to heat than healthy cells [28]. Nanoparticles as hyperthermia agents allow for a controlled distribution of heat within a target tissue avoiding damage to surrounding healthy tissues. They can also deliver anticancer agents directly to the tumor because these objects can encapsulate drugs in the same manner as other theranostic particles such as liposomes, dendrimers, micelles or coloidal particles. When gold nanoparticles (GNPs) are excited at their plasmonic frequency by near-infrared (NIR) photons, electrons of their metallic surface oscillate collectively. This phenomenon called surface plasmon resonance induces a strong absorption of the incident light which can be measured using a UV-Visible absorption spectrometer (for an example of nanoparticle absorbance spectrum, see Fig. 1 in [29]). One drawback of phototherapy is the limited penetration depth of light in tissue. In order to maximize it, one needs to work in the NIR window which is limited by the light absorption of blood at short wavelengths and the light absorption of water at long wavelengths, i.e. range of wavelengths from 650 to 1350 nm. Nanotechnology for biomedicine offers the ability to tailor GNPs such that their peak plasmonic (or extinction) wavelength is located within the NIR biological window and that they possess the largest yield of photon absorption to heat generation.
Fig. 1.

Procedure implemented in GATE in order to account for the diffusion of heat during illumination. In this schema, the n seconds simulation is sampled into p 3D photon absorption maps; each simulation sample corresponds to a laser illumination duration time of n/p seconds.
2.1. Nano material and photon extinction: a Monte-Carlo simulation
For in vivo nanoparticle-mediated hyperthermal therapy, approximately 108 particles are injected for a 1 cm diameter tumor [7]. Consequently, modeling each individual nanoparticle-photon interaction within a tumor is not reasonable and would clearly be computationally demanding. Here, we propose another approach that relies on the definition of a material with a property called NanoAbsorptionLength (La) and an optical photon physics process called NanoAbsorption. In GATE, each optical photon is transported following a step length which is randomly sampled using the mean free path (or interaction length) of each physics process associated to the optical photon (i.e. Rayleigh/Mie scattering, fluorescence, physics processes at the interface between two media), including the NanoAbsorption process. The mean free path of the optical photon interaction with the nanoparticle-infused medium is La. It represents the average distance an optical photon can travel in the nanoparticle-infused medium before being absorbed. The inverse of the absorption length is referred to as the absorption coefficient (µa). This coefficient is a function of the density of nanoparticles in the medium (N in number of NPs/m3) and the nanoparticle absorption cross-section area (Cabs in m2):
| (1) |
Nanoparticle properties (i.e. Cabs) are usually wavelength dependent and can be found in the literature [30]. The nanoparticle-infused material absorption length values are added by the GATE user in the material definition XML file. Other properties of the nanoparticle-infused tissue can be added, such as scattering or fluorescence if a theranostic scenario is considered.
2.2. Heat generated by nanoparticles
The GATE code simulates the absorption of optical photons by the nanoparticle-infused tissue and the diffusion of the deposited photon energy (or heat) in biological tissues. The code provides a voxelized energy map (photon deposited energy in eV). The deposited energy is then converted (in an automated post-processing step) into heat following the work from Qin and Bischof [30]. In their review, they focused on the thermophysical and biological responses of media heated by laser activated gold nanoparticles. With a concentration N (number of NPs/m3) of nanoparticles, the heat generation [30] is given by:
| (2) |
where QNP is the heat generated by a single nanoparticle, Cabs is the nanoparticle absorption cross-section area and I is the local laser irradiance (in W·m−2) within the nanoparticle-infused tissue. The temperature increase at the center of the tumor is given by the following equation [30]:
| (3) |
where R is the tumor radius and k is the thermal conductivity of the nanoparticle-infused tissue in W·m−1·K−1. The 3D energy map is voxelized (the voxel size is a parameter of the simulation) and therefore Eq. (3) can be scaled to reflect the heat increase in temperature per tumor volume unit (i.e. per voxel). In that case, R is replaced by the voxel half-size and I becomes the light irradiance per voxel (Ivoxel):
| (4) |
where voxel is the GATE simulation energy map voxel value in electronvolts, tlaser is the light (i.e. laser) illumination duration in seconds, areavoxel is the voxel surface in m2 and 1.6 × 10⁻¹⁹ is the conversion factor between electronvolts and joules.
2.3. Heat diffusion in biological tissues: an analytical simulation
The mathematical model that best describes the thermal behavior in biological perfused tissues is the Pennes bioheat model [31,32]:
| (5) |
The first term of the equation describes the transfer of energy between objects in contact (i.e. conduction); the second term accounts for the effects of blood perfusion in tissues. As the blood leaves the biological tissue, it carries away the heat and therefore acts as an energy sink in hyperthermia therapy. k, ρ and c are the biological tissue thermal conductivity, density and specific heat. Values for blood are given by ρb and cb; wb is the tissue blood perfusion rate which represents the volume of fluid (i.e. blood) that passes per unit time and per tissue volume. It is given in . Q represents the energy deposition by any external heat source such as the metabolic heat production in tissues. In this work, we consider Q = 0. Ta is the temperature of blood in the main arteries which is assumed constant and equal to 37.3°C. T is the local tissue temperature, which is a function of the spatial position and the time. To model the heat diffusion in biological tissues, Eq. (5) is solved analytically via Fourier transformations and convolution theorem. After taking the Fourier transform of the spatial variable of Eq. (5) with Q set to 0, we obtain:
| (6) |
Using basic properties of the Fourier transform, Eq. (6) becomes an ordinary differential equation:
| (7) |
ω is the Fourier transformation variable and K1 is the tissue thermal diffusivity in m2·s−1. Equation (7) is equivalent to:
| (8) |
whose solution via partial integration with respect to t yields
| (9) |
c(ω) is the Fourier transform of T (x,y,z,0) − Ta with T (x,y,z,0) being the initial temperature distribution or initial condition. Taking the inverse Fourier transform of Eq. (9) and applying the convolution theorem for Fourier transformations, we obtain the analytical solution to the Pennes bioheat equation (Eq. (5)):
| (10) |
As a summary, the solution of the diffusion equation is equivalent to convolving the initial conditions (3D energy map) with a Gaussian with a standard deviation . The blood perfusion term appears as an exponential function. The implementation of the heat diffusion in GATE is performed using the Insight Segmentation and Registration Toolkit (ITK) which is an open-source, cross-platform system that provides developers with an extensive suite of tools for image analysis [33]. GATE and ITK are linked.
2.4. Hybrid Monte-Carlo and analytical simulation: a dynamic process
During NIR light illumination of a biological tissue, the thermal heat produced by the optical photons deposited energy does not accumulate locally in the tissue; it diffuses in biological tissues. This dynamic effect has been taken into account in the GATE code following the procedure described in Fig. 1. The biological tissue is illuminated for a duration of n seconds. The simulation of the optical photons absorption by the tissue produces an absorption map in which optical photons deposited energy is accumulated and does not take into account the fact that the heat diffuses during light illumination. This accumulated absorption map is sampled (discretized) into p time frame images by setting the simulation parameter setNumberOfTimeFrames to p. Each of the p sample images is diffused for a duration of [1, 2, …, p −1] × n/p seconds. The final voxelized image illustrating the heat distribution in the tissues at the end of the illumination time is obtained by adding all diffused images to the last n/p seconds illumination image. This heat map will then diffuse in the biological tissues by setting the simulation parameter setDiffusionTime to the value of interest. At a certain point in time after the initial temperature boost induced by nanoparticles, the temperature of the tissues will go back to its initial value due to diffusion. This boundary condition is taken into account in a post processing-step of the GATE simulation.
3. Methods
3.1. Validation of the heat diffusion in GATE versus an analytical simulation code
In this section, the heat diffusion implemented in GATE is compared to an analytical code that solves the diffusion equation via the finite difference method where continuous derivatives are replaced by their finite difference approximations. This method is applied on the following general convection-diffusion heat transfer equation [34]:
| (11) |
where u is the blood velocity (in m·s−1) considered as uniform. Q represents the thermal capacity of external sources. The Pennes model from Eq. (5) can be derived from Eq. (11) in which the second term, describing the heat transfer in blood vessels, is modeled to be proportional to the difference between the arterial temperature and the temperature at a given location [35]. The partial differential Eq. (11) is discretized in space (i) and time (t) in order to find an approximate solution that satisfies initial and boundary conditions:
| (12) |
The benchmark used to validate the heat diffusion process between the two analytical simulation codes is shown in Fig. 2 and consisted of a cubic phantom of 42×42×42 mm3 made of a material defined with a NanoAbsorptionLength La = 30 mm. The phantom is illuminated during 1000 s by a 0.2 mm radius cylindrical source of 690 nm wavelength optical photons with a photon flux of 1000 counts per second. The source direction is set perpendicular and positioned towards the phantom surface. At the end of the illumination time, the absorbed photon map (voxelized image) is used as a static image of the initial energy distribution within the phantom (initial conditions). After setting the simulation parameter setDiffusionTime to 100 s and using a thermal diffusivity of 1 mm2·s−1, the new energy distribution within the phantom is derived from the initial conditions. Taking into account the symmetry of the problem, the solution to the heat diffusion equation via finite difference method was implemented in MATLAB allowing for diffusion only along one dimension (x axis) for simplicity. This numerical method approximates the temperature at given grid points with a spacing of Δx = 2.1 mm and the time evolution is computed with a time step of Δt = 0.1 s. 1000 time steps were computed to follow the diffusion of heat up to 100 s post illumination start. The blood velocity u was set to 31.75 cm·s−1 [36]. Boundary conditions were set to the values obtained following the GATE simulation (i.e. the minimum voxel value in the GATE output image).
Fig. 2.
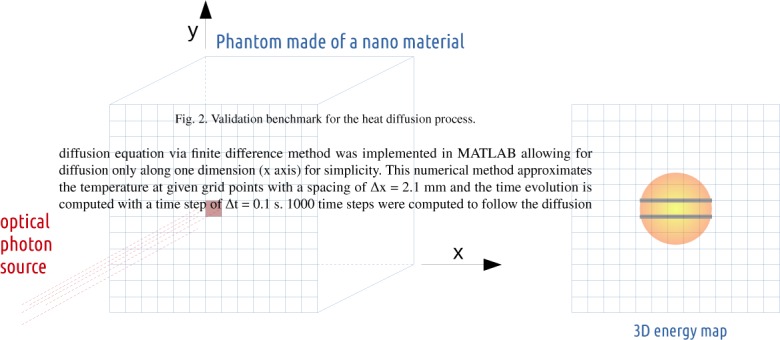
Validation benchmark for the heat diffusion process.
3.2. Thermal diffusivity in biological tissues
Thermal diffusivity is a material specific property that measures its ability to conduct heat. Human biological tissues thermal diffusivities were calculated from their corresponding thermal conductance, density and heat capacity extracted from the IT’IS material parameter database [37]. Figure 3 shows the range of human biological tissues thermal diffusivity. The dashed-dotted line represents the diffusivity mean value (0.131 mm2·s−1) and the two dashed lines are the standard deviations (± 0.013 mm2·s−1). Most biological tissues have a thermal diffusivity value close to the mean except skin/fat, connective tissue, breast gland and pancreas which are more than one standard deviation away from the mean value. The validation benchmark from Fig. 2 is used to evaluate the effect of an underestimate or overestimate of the thermal diffusivity on the biological tissue heat (in eV).
Fig. 3.

Thermal diffusivity values of human biological tissues.
3.3. Validation of heat diffusion with experimental data
Figure 4 shows the benchmark used to validate GATE against experimental data. It consisted of a parallelepipedic phantom of 4×4×1 cm3 made of a common thermoplastic polymer, the acrylonitrile butadiene styrene (ABS), whose density is 1.05 g·cm−3. Illumination was achieved using a 633 nm laser coupled to a 0.96 mm diameter fiber and a 0.48 numerical aperture (NA). The maximal half-angle (θ) of the light cone that can exit the fiber is given by:
| (13) |
where n is the ABS refraction index (i.e. 1.4 [38]). It was inserted 1 mm under the surface of the phantom, which pointed towards a Gobi 640 low noise thermal camera (Xenics, Louvain, Belgium) recording 3 images per second. This camera, which has a resolution of 0.1°C, provides an accurate measurement of temperature at the surface of the phantom (within 100 µm). The total power at the fiber exit was measured to be 150 mW. The experimental acquisition started with images of the phantom recorded for 10 seconds, followed by 30 seconds laser illumination. When the laser was switched off, images were recorded for 1 more minute. The phantom initial temperature, measured from the data using a 2D region of interest (ROI) of 0.5×0.5 mm2 positioned at the center of the phantom surface, was 26.9°C. The phantom thermal diffusivity (K1), extracted from the data using Eq. (12), was 0.32 mm2·s−1. The phantom absorption coefficient was also extracted from the data using the thermal image recorded before the laser was switched on (image 1) and the thermal image recorded one second later (image 2). A 0.96 mm diameter fiber coupled laser, delivering a power of 150 mW, generates 6.6 × 10¹⁹ photons per second per cm2. The heat added to the ABS phantom after one second of laser illumination is given by:
| (14) |
where m is the mass of ABS material between the laser fiber and the phantom surface, Cp is the ABS heat capacity (1280 J·kg−1·K−1 [39]) and ΔT is the change in temperature between images 1 and 2 (i.e. 0.44 °C at the center of the image). Q is found to be equal to 0.936 J. Knowing that the energy of a 633 nm photon is 3.1 × 10⁻¹⁹ J, the number of photons absorbed by the ABS material after one second illumination is 3.02 × 10¹⁸. Finally, the ABS absorption coefficient (µa) is calculated using the Beer-Lambert law:
| (15) |
where N0 corresponds to the number of photons generated by one second laser illumination and x is the distance traveled by the photons (i.e. 1 mm). The phantom absorption coefficient at 633 nm wavelength was found to be 3.08 mm−1 which corresponds to an absorption length of 0.32 mm. The ABS refractive index is 1.4 [38] and the Mie scattering coefficient µs is set to 4.625 mm−1 ([40] with the ABS optical anisotropy parameter (g) set to 0.6). As the GATE simulation output is a 3D matrix of the optical photon deposited energy, a conversion to temperature is done in a post-processing step. From Eq. (14), the voxelwise conversion factor to obtain the 3D matrix of temperature is:
| (16) |
where , the mass of ABS in a 0.5×0.5×0.5 mm3 voxel, is equal to 0.131×10⁻³ g and the ABS heat capacity is equal to 1280 J·kg−1·K−1. In this section, the diffusion of heat within the phantom is due to thermal conduction only; no perfusion term is considered. After the laser light is turned off, the temperature difference in the phantom decreases over time until a thermal equilibrium is reached. At the end of the experiment, the phantom temperature is uniform and equal to its initial temperature (i.e. 26.9° C extracted from the experimental data). This is the boundary condition that is taken into account in the post-processing step of the GATE simulation. In the simulation, we modeled the laser fiber as a photon beam generating 6600 photons per second with a light cone half-angle θ of 20°. This corresponds to a photon flux of 9.12×10⁵ photons per second per cm2. In order to reproduce the experiment (i.e. 6.6×10¹⁹ photons per second per cm2) a photon flux scaling factor of 7.2×10¹³ is used in a post-processing step. The ABS total scaling factor is 7.2×10¹³ × fconversion, which is equal to 0.07. The GATE simulation provides a voxelised map of the heat distribution inside the 3D phantom and the experiment provides a serie of thermal images. The comparaison between both outputs is not immediate because we do not simulate the thermal camera nor its response. To provide an absolute comparison of both results (thermal camera and heat distribution in the phantom), the simulation result was calibrated using the data (i.e. after 5 seconds of illumination, 1eV would correspond to 31.52°C/eVGATE). In replacement to the ABS total scaling factor (i.e. 0.07), a calibration factor of 0.05 was used.
Fig. 4.
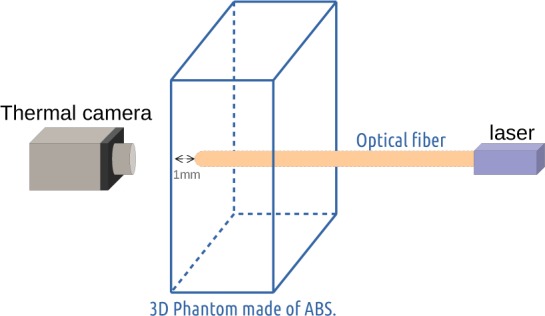
The experimental benchmark consists of a phantom made of acrylonitrile butadiene styrene in which an optical fiber is introduced 1 mm under the phantom surface pointing towards a thermal camera.
3.4. Validation of the nanoparticle mediated hyperthermal therapy with in vivo mouse data
In this section, we compare our simulation results to the experimental results obtained by Hirsch et al. [7]. In their work, 5 mice were inoculated with canine transmissible venereal tumor cells. The cells were grown until the tumor reached a diameter of approximately 1 cm. Then, NIR-absorbing gold-silica nanoshells (20–50 µl) were injected into the tumor volume. Control tumor sites received a saline injection. After injection, tumor sites were exposed to NIR light (820 nm) using an optical fiber with a 5 mm spot diameter and an irradiance of 4 W·cm−2. Temperature profiles were monitored using a phase-sensitive, fast-spoiled gradient-echo MRI. Figure 5 shows the measured temperature rise obtained by Hirsch et al. in a region of interest at 0, 1, 3 and 6 minutes post illumination start, for nanoshell treatment (a) and control treatment (b). The GATE simulation benchmark consisted of the MOBY digital mouse phantom [41] in which a 1 cm diameter spherical tumor was inserted under 1 mm of mouse skin tissue. The phantom tumor was infused with 35 µl (middle value in the range of 20–50 µl from [7]) of NIR-absorbing gold-silica nanoshells (55 nm core radius and 10 nm thick shell); which corresponds to a density of 8.7×10²⁰ nanoparticles per m3. The absorption cross-section area (Cabs) is equal to 3.8×10⁻¹⁴ m2. Following Eq. (1), the nanoparticle-infused tumor absorption coefficient is found to be 0.167 mm−1, which corresponds to an absorption length of 6 mm. The mouse skin tissue has a scattering coefficient of 2 mm−1 [42] and a scattering anisotropy of 0.8. The literature quotes an absorption coefficient around 0.08 mm−1 for the mouse skin [43] at 820 nm wavelength. Considering a mouse phantom thermal conductivity of 0.5·W·m−1 K−1 [44,45], a specific heat of 3000 J·kg−1·K−1 [46] and a density of 1 g·cm−3, the mouse thermal diffusivity is set to 0.17 mm2·s−1. The mouse is illuminated during 60, 180 and 360 seconds by a NIR light (820 nm) fiber of 5 mm diameter. For each simulation, the number of time frames are set to 60, 180 and 360 in order to account for the diffusion of heat during illumination (see section 2.4). In the Hirsch et al. study, the NIR light irradiance was set to 4 W·cm−2, which corresponds to a photon flux of 3.2×10¹⁸s−1·cm−2. In these simulations, we modeled a 5 mm diameter photon beam generating 20000 optical photons per second, which corresponds to a photon flux of 105 photons per second per cm2. A photon flux scaling factor of 3.2×10¹³ is applied in a post-processing stage to avoid the generation and tracking of more than 1018 photons. The simulation images voxel size is set to 0.25×0.25×0.25 mm3. The voxel values in these images are in the unit of the photon deposited energy (eV). Therefore, in addition to the photon flux scaling factor, a conversion factor, given by Eqs. (3) and (4), is needed:
| (17) |
The value of the blood perfusion rate is highly dependant on the tissue type and state. From the literature, one can extract a range of perfusion values, such as a blood perfusion rate in the mouse tissue (0.004 s−1) and in the mouse tumor (0.0004 s−1). The simulation was performed for both values of the blood perfusion rate.
Fig. 5.

Figure extracted from Hirsch et al. [7] showing the measured temperature rise in a region of interest at 0, 1, 3 and 6 minutes for nanoshell treatment (a) and control treatment (b) plotted as a function of depth from skin surface.
4. Results
4.1. Validation of the heat diffusion in GATE versus an other analytical simulation code
This validation concerns the heat diffusion process only and was performed by comparing two analytical simulation codes which solve the heat diffusion equation respectively via Fourier transformations and convolution theorem (GATE implementation) and via finite difference method (MATLAB implementation). Figure 6 shows the radiant energy (in eV) in the voxels located in the middle of the XY plane of the phantom from Fig. 2 for both simulation codes. There is a good agreement between both implementations. The relative error between both simulations ranges from −1.31 to 4.0%. This validates our approach of using the Fourier transformations and convolution theorem to solve the heat diffusion equation analytically.
Fig. 6.

Validation of the heat diffusion in GATE versus MATLAB. (A) Radiant energy (in eV) in the voxels located in the middle of the XY plane of the phantom from Fig. 2 for both simulation codes. (B) Relative error in % between GATE and MATLAB.
4.2. Thermal diffusivity effect in biological tissues
In this section, we study the effect of the thermal diffusivity value on the biological tissue heat. Figure 3 shows that most human biological tissues have a thermal diffusivity value close to a mean value except for a few outliers: skin/fat, connective tissue, breast gland and pancreas. Following the same benchmark as for the previous section (Fig. 2), the effect of the thermal diffusivity value on the tissue heat has been estimated by comparing the simulation using the true or a mean diffusivity value for the outliers. Figure 7 compares the heat as a function of the diffusion time for the voxel located at the center of the XY plane of the phantom from Fig. 2 when using the true or the mean value of the thermal diffusivity. The relative differences in heat for skin/fat, connective tissue, breast gland and pancreas are 13.5%, −10.5%, 9.6% and −6% respectively. These relative errors are systematic errors which can be considered as a measure of accuracy. The maximum systematic error is 13.5% and is obtained when the tissue thermal diffusivity value in the simulation is 34% greater than its true value (that corresponds to skin/fat tissue). Figure 8 shows the linear relationship between the relative change in heat and the relative change in the biological tissue thermal diffusivity value. For most of the biological tissues from Fig. 3, using a mean value for the thermal diffusivity induces a systematic error on the heat below 5% as shown by the dashed region in Fig. 8. In the GATE simulation code, the thermal diffusivity of the organ of interest (i.e. healthy tissue plus a tumor) will be set to a value that would best represent the mixture of a tumor tissue surrounded by healthy tissues. The systematic error associated with the diffusivity value used in the simulation can be estimated from Fig. 8.
Fig. 7.

Heat (in eV) as function of the diffusion time at the center of the XY plane of the phantom when using the true or a mean value for the tissue thermal diffusivity.
Fig. 8.
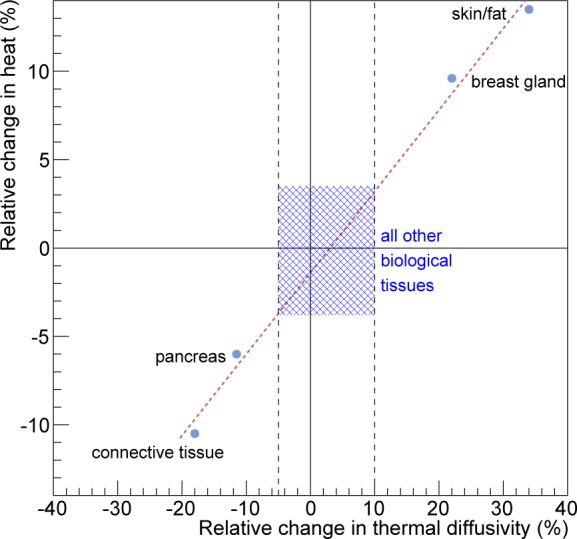
Relative change in heat as function of the relative change in the biological tissue thermal diffusivity. For most of the biological tissues, the associated relative change in heat is below 5% and is shown by the dashed region.
4.3. Validation of the heat diffusion with experimental data
Figure 9 shows the phantom heat as a function of the acquisition time and the relative error between the experimental data and the simulation. The GATE simulation and the experimental data are in good agreement. The relative error between the data and the GATE simulation ranges from −0.86 to 5.15%.
Fig. 9.

Validation of the heat diffusion with experimental data. (A) Temperature kinetics in the ABS phantom described in Fig. 4 as function of the experiment acquisition time. (B) Relative error between the simulation and the experimental data.
4.4. Validation of the nanoparticle mediated hyperthermal therapy with in vivo mouse data
Biological tissues are perfused with blood vessels. The effect of thermal heat dissipation by blood is considered in this section. In GATE, the analytical solution to the heat diffusion follows Eq. (10) with the presence of a blood perfusion term. Figure 10 shows the temperature rise as a function of the depth from skin for a region of interest at the center of the tumor site for 1, 3 and 6 minutes of nanoshell-mediated near-infrared thermal therapy treatment. Thermal profiles show a good qualitative agreement between the simulation and the experimental data published by Hirsch et al. [7]. The dashed lines correspond to the simulation results with a thermal diffusivity of 0.17 mm2·s−1 and no blood perfusion. The hashed bands illustrate the effect of the blood perfusion term. The band upper limit correponds to the tumor blood perfusion rate value (0.0004 s−1) and the lower limit corresponds to the tissue blood perfusion rate value (0.004 s−1). The agreement between the GATE simulation and the mouse in vivo data is good, all the more as most of the simulation parameters (mouse absorption and scattering coefficients, thermal conductivity, specific heat and blood perfusion rates in tissue or tumor) were taken from the literature and not specified in [7].
Fig. 10.
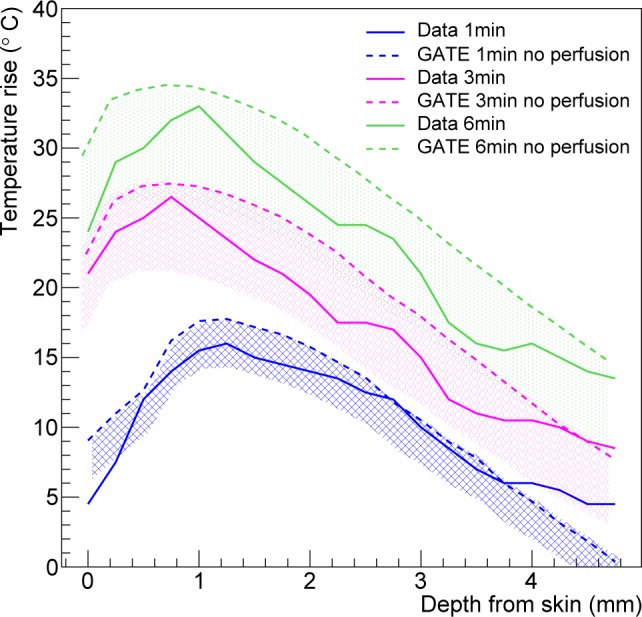
Temperature rise as a function of the depth from skin for a region of interest at the center of the tumor site at 1, 3 and 6 minutes of nanoshell-mediated near-infrared thermal therapy treatment.
5. Discussion
Hyperthermal therapy has been developed as a new module of the GATE open-source simulation platform. This new hybrid Monte-Carlo and analytical simulation module allows for a wide range of applications going from localized hyperthermia (i.e. skin hyperthermia or direct heating with a fiber coupled laser) to more complex nano-mediated near-infrared hyperthermal therapy. The Monte-Carlo simulation models the absorption and scattering of optical photons by the medium of interest (i.e. biological tissue). The analytical simulation models the diffusion of heat in the biological tissue by solving the Pennes bioheat equation. The solution to this equation, obtained via Fourier transformations and convolution theorem, was found to be equivalent to the convolution of the initial conditions with a Gaussian function whose standard deviation is related to the tissue thermal diffusivity. The blood perfusion term appears as an exponential function in the solution as described in Eq. (10). The validation of this solution (see Fig. 6) was performed by comparing GATE to an other analytical simulation code in which the solution of the diffusion equation was obtained via the finite difference method where continuous derivatives are replaced by their finite difference approximations. The maximum relative error between both analytical simulation codes was found to be 4%. The tissue thermal diffusivity plays an important role in the simulation of the heat diffusion. In GATE, the thermal diffusivity of the organ of interest (i.e. healthy tissue plus a tumor) is set to a value that best represents the mixture of a tumor surrounded by healthy tissues. This value depends on the light wavelength and is difficult to find in the literature. Figure 3 has shown that most human biological tissues have a thermal diffusivity value close to a mean value (i.e. 0.131 mm2·s−1) except for some outliers (skin/fat, connective tissue, breast gland and pancreas) which are·more than one standard deviation away from the mean value. We studied the effect of overestimating or underestimating the tissue thermal diffusivity by looking at the heat in the region of interest obtained when using the true value of the tissue thermal diffusivity or the mean value. Figure 8 shows that for most of human biological tissues the relative change in heat as function of the relative change in the thermal diffusivity value is below 5% except for the outliers for which the relative change in heat is between −10.5% and 13.5%. Figure 3 shows that a systematic error exists when one does not use the true value of the thermal diffusivity. When the thermal diffusivity value is overestimated (underestimated) by 34% (18%), i.e. skin (connective tissue), the relative change in heat is 13.5% (−10.5%). When local hyperthermia is used for cancer near or on the skin, the region of interest can be associated to the true skin thermal diffusivity. In nanoparticle-mediated hyperthermia therapy, the treatment heats a larger part of the body such as an entire organ and the illumination light is delivered directly at the tumor site using an interstitial laser. In this application, it is reasonnable to use a mean value of the thermal diffusivity for a region of interest composed of the tumor and surrounding tissues. Localised hyperthermal therapy has been first demonstrated in a phantom made of acrylonitrile butadiene styrene (ABS). As shown in Fig. 9, the GATE simulation code was able to reproduce the relative temperature changes as a function of the acquisition time. The maximum relative error between the data and the GATE simulation was found to be 5.15%. This discrepancy could be explained by the metallic part at the extremity of the laser fiber which could serve as a heat reservoir. This was not implemented in the GATE simulation. The thermal camera provides an accurate measurement of temperature at the surface of the phantom. Measuring the temperature inside the phantom (or biological tissues) with a thermocouple is invasive and limited to a few located points. It may suffer from a poor spatial resolution due to the diameter of the thermocouple and the uncertainty of its location within the phantom. This underlines the great interest of a coupled optical-thermal simulation tool for the estimation of temperature changes distribution inside tissue volumes. In vivo nanoshell-mediated near-infrared thermal therapy of tumors in mice (work from Hirsch et al. [7]) has been simulated using GATE. Figure 10 shows the simulated and measured temperature rise in the mouse tumor as a function of the depth from skin at 1, 3 and 6 minutes of nanoshell-mediated near-infrared thermal therapy treatment. The simulation results are reported in terms of temperature rise bands which are obtained by varying the mouse blood perfusion rate in a range of [0.0004, 0.004] s−1. The lower (upper) bound corresponds to the temperature rise obtained when the blood perfusion rate is equal to the tissue (tumor) blood perfusion rate. In the Hirsch et al. study, temperature profiles were monitored using a phase-sensitive, fast-spoiled gradient-echo MRI and the temperature dependence of the proton resonance frequency shift [47]. They reported that the average temperature increase of the nanoshell-treated tumors was 37.4 ± 6.6 °C on near-infrared exposure of 4–6 minutes, which leads to an accuracy of 17.6% in the value of the temperature rise. They also explained that observed variances in temperature change could be due to different nanoshell distributions within the tumor, the source-to-skin distance of the laser fiber as well as the placement of the MR plane for observation. Despite several sources of experimental systematic errors, the GATE code reproduces the experimental data published by Hirsch et al. [7] reasonably well. The experimental data are within the blood perfusion rate bands representing the range of simulated temperature rise (see Fig. 10).
6. Conclusion
We have extended the GATE Monte-Carlo simulation platform so that it can model the diffusion of heat in perfused biological tissues. We have demonstrated that a nanoparticle-mediated near-infrared thermal therapy could be accurately simulated with GATE and reproduced experimental data published elsewhere [7]. This new feature of GATE combined with optical imaging (i.e. fluorescence) allows for the simulation of a theranostic scenario in which the patient is injected with theranostic nanosystems (iron oxide nanoparticles, quantum dots, carbon nanotubes, gold nanoparticles and silica nanoparticles) that can simultaneously deliver therapeutic (i.e. hyperthermia therapy) and imaging functions (i.e. fluorescence imaging). To our knowledge, GATE is the first theranostics in silico modeling platform. It includes the ability to model multimodal imaging (PET, CT, SPECT, optical imaging) and therapy protocols (hyperthermia, radiation therapy) and their interactions within the same modeling framework, based on the development of a hybrid modeling approach combining Monte-Carlo and analytical simulations. These new GATE features will certainly play a major role in designing, optimizing and assessing the efficacy of theranostics protocols.
Funding
This work was funded by the French National Research Agency through the tGATE project (ANR-14-CE23-0008).
References and links
- 1.Plenderleith I. H., “Treating the treatment: toxicity of cancer chemotherapy,” Can. Fam. Physician 36, 1827–1830 (1990). [PMC free article] [PubMed] [Google Scholar]
- 2.Douglas S. J., Davis S. S., Illum L., “Nanoparticles in drug delivery,” CRC Critical Reviews in Therapeutic drug carrier systems 3(3), 233–261 (1987). [PubMed] [Google Scholar]
- 3.Hildebrandt B., Wust P., Ahlers O., Dieing A., Sreenivasa G., Kerner T., Felix R., Riess H., “The cellular and molecular basis of hyperthermia,” Crit Rev Oncol Hematol. 43(1), 33–56 (2002). 10.1016/S1040-8428(01)00179-2 [DOI] [PubMed] [Google Scholar]
- 4.Popp M. K., Oubou I., Shepherd C., Nager Z., Anderson C., Pagliaro L., “Photothermal therapy using gold nanorods and near-infrared light in a murine melanoma model increases survival and decreases tumor volume,” Journal of Nanomaterials 2014, 1–8 (2014). 10.1155/2014/450670 [DOI] [Google Scholar]
- 5.Ming-Fong T., Shih-HuiGilbert C., Fong-Yu C., Vijayakumar S., Yu-Sheng C., Chia-Hao S., Chen-Sheng Y., “Au nanorod design as light-absorber in the first and second biological near-infrared windows for in vivo photothermal therapy,” ACS Nano 7(6), 5330–5342 (2013). 10.1021/nn401187c [DOI] [PubMed] [Google Scholar]
- 6.Dickerson E. B., Dreaden E. C., Huang X., El-Sayed I. H., Chu H., Pushpanketh S., McDonald J.F., El-Sayed M. A., “Gold nanorod assisted near-infrared plasmonic photothermal therapy (PPTT) of squamous cell carcinoma in mice,” Cancer Lett. 269(1), 57–66 (2008). 10.1016/j.canlet.2008.04.026 [DOI] [PMC free article] [PubMed] [Google Scholar]
- 7.Hirsch L. R., Stafford R. J., Bankson J. A., Sershen S. R., Rivera B., Price R. E., Hazle J. D., Halas N. J., West J. L., “Nanoshell-mediated near-infrared thermal therapy of tumors under magnetic resonance guidance,” Proc. Natl. Acad. Sci. USA 100(23), 13549–13554 (2003). 10.1073/pnas.2232479100 [DOI] [PMC free article] [PubMed] [Google Scholar]
- 8.Gobin A. M., Lee M. H., Halas N. J., James W. D., Drezek R. A., West J. L., “Near-infrared resonant nanoshells for combined optical imaging and photothermal cancer therapy,” Nano Lett. 7(7), 1929–1934 (2007). 10.1021/nl070610y [DOI] [PubMed] [Google Scholar]
- 9.Maier-Hauff K., Rothe R., Scholz R., Gneveckow U., Wust P., Thiesen B., Feussner A., von Deimling A., Waldoefner N., Felix R., Jordan A., “Intracranial thermotherapy using magnetic nanoparticles combined with external beam radiotherapy: results of a feasibility study on patients with glioblastoma multiforme,” J. Neurooncol. 81(1), 53–60 (2007). 10.1007/s11060-006-9195-0 [DOI] [PubMed] [Google Scholar]
- 10.ClinicalTrials.gov , “Pilot study of auroLaseTM therapy in refractory and/or recurrent tumors of the head and neck,” https://clinicaltrials.gov/ct2/show/NCT00848042.
- 11.Singh M., Harris-Birtill D. C. C., Markar S. R., Hanna G. B., Elson D. S., “Application of gold nanoparticles for gastrointestinal cancer theranostics: A systematic review,” Nanomedicine: Nanotechnology, Biology and Medicine 11(8), 2083–2098 (2015). [DOI] [PubMed] [Google Scholar]
- 12.Zhao J., Lee P., Wallace M. J., Melancon M. P., “Gold Nanoparticles in Cancer Therapy: Efficacy, Biodistribution, and Toxicity,” Curr Pharm Des. 21(29), 4240–4251 (2015). 10.2174/1381612821666150901103032 [DOI] [PubMed] [Google Scholar]
- 13.Mooney R., Schena E., Zhumkhawala A., Aboody K. S., Berlin J. M., “Internal temperature increase during photothermal tumour ablation in mice using gold nanorods,” in Proceedings of IEEE Conference of the Engineering in Medicine and Biology Society (IEEE, 2015), pp. 2563–2566. [DOI] [PubMed] [Google Scholar]
- 14.Mooney R., Schena E., Zhumkhawala A., Aboody K. S., Berlin J. M., “Gold nanorod-mediated near-infrared laser ablation: in vivo experiments on mice and theoretical analysis at different settings,” Int J Hyperthermia 1–10 (2016). 10.1080/02656736.2016.1230682 [DOI] [PubMed]
- 15.Paulides M. M., Stauffer P. R., Neufeld E., Maccarini P., Kyriakou A., Canters R. A. M., Diederich C., Bakker J. F., Van Rhoon G. C., “Simulation techniques in hyperthermia treatment planning,” Int. J. Hyperthermia 29(4), 346–357 (2013). 10.3109/02656736.2013.790092 [DOI] [PMC free article] [PubMed] [Google Scholar]
- 16.Rijnen Z., Bakker J. F., Canters R. A., Togni P., Verduijn G. M., Levendag P. C., Van Rhoon G. C., Paulides M. M., “Clinical integration of software tool VEDO for adaptive and quantitative application of phased array hyperthermia in the head and neck,” Int. J. Hyperthermia 29(3), 181–193 (2013). 10.3109/02656736.2013.783934 [DOI] [PubMed] [Google Scholar]
- 17.Hand J. W., “Modelling the interaction of electromagnetic fields (10 MHz – 10 GHz) withe the human body: methods and applications,” Phys. Med. Biol. 53(16), 243–286 (2008). 10.1088/0031-9155/53/16/R01 [DOI] [PubMed] [Google Scholar]
- 18.Deuflhard P., Schiela A., Weiser M., “Mathematical cancer therapy planning in deep regional hyperthermia,” Acta Numerica 21, 307–378 (2012). 10.1017/S0962492912000049 [DOI] [Google Scholar]
- 19.Jensen J. A., Svendsen N. B., “Calculation of pressure fields from arbitrarily shaped, apodized, and excited ultrasound transducers,” IEEE Transactions on Ultrasonics, Ferroelectrics and Frequency Control 39(2), 262–267 (1992). 10.1109/58.139123 [DOI] [PubMed] [Google Scholar]
- 20.Jensen J. A., “Field: a program for simulating ultrasound systems,” Med. Biol. Eng. Computing 34(1), 351–353 (1996). [Google Scholar]
- 21.McGough R. J., Wang H., Ebbini E. S., Cain C. A., “Mode scanning: heating pattern synthesis with ultrasound phased arrays,” Int. J. Hyperthermia 10(3), 433–442 (1994). 10.3109/02656739409010289 [DOI] [PubMed] [Google Scholar]
- 22.Treeby B. E., Cox B. T., “k-Wave: MATLAB toolbox for the simulation and reconstruction of photoacoustic wave-fields,” J. Biomed. Opt. 15(2), 021314 (2010). 10.1117/1.3360308 [DOI] [PubMed] [Google Scholar]
- 23. http://www.comsol.com
- 24.Yona G., Meitav N., Kahn I., Shoham S., “Realistic numerical and analytical modeling of light scattering in brain tissue for optogenetic applications,” eNeuro 3(1), 59 (2016). 10.1523/ENEURO.0059-15.2015 [DOI] [PMC free article] [PubMed] [Google Scholar]
- 25.Jan S., Santin G., Strul D., Staelens S., Assié K., Autret D., Avner S., Barbier R., Bardiès M., Bloomfield P. M., Brasse D., Breton V., Bruyndonckx P., Buvat I., Chatziioannou A. F., Choi Y., Chung Y. H., Comtat C., Donnarieix D., Ferrer L., Glick S. J., Groiselle C. J., Guez D., Honore P-F., Kerhoas-Cavata S., Kirov A. S., Kohli V., Koole M., Krieguer M., van der Laan D. J., Lamare F., Largeron G., Lartizien C., Lazaro D., Maas M. C., Maigne L., Mayet F., Melot F., Merheb C., Pennacchio E., Perez J., Pietrzyk U., Rannou F. R., Rey M., Schaart D. R., Schmidtlein C. R., Simon L., Song T. Y., Vieira J-M., Visvikis D., Van de Walle R., Wiëers E., Morel C., “GATE: a simulation toolkit for PET and SPECT,” Phys. Med. Biol. 49, 4543–45461 (2004). 10.1088/0031-9155/49/19/007 [DOI] [PMC free article] [PubMed] [Google Scholar]
- 26.Jan S., Benoit D., Becheva E., Carlier T., Cassol F., Descourt P., Frisson T., Grevillot L., Guigues L., Maigne L., Morel C., Perrot Y., Rehfeld N., Sarrut D., Schaart D. R., Stute S., Pietrzyk U., Visvikis D., Zahra N., Buvat I., “GATE V6: a major enhancement of the GATE simulation platform enabling modeling of CT and radiotherapy,” Phys. Med. Biol. 56, 881–901 (2011). 10.1088/0031-9155/56/4/001 [DOI] [PubMed] [Google Scholar]
- 27.Cuplov V., Buvat I., Pain F., Jan S., “Extension of the GATE Monte Carlo simulation package to model bioluminescence and fuorescence imaging,” J. Biomed. Opt. 19(2), 026004 (2014). 10.1117/1.JBO.19.2.026004 [DOI] [PubMed] [Google Scholar]
- 28.Babbs C. F., DeWitt D. P., “Physical principles of local heat therapy for cancer,” Medical instrumentation 15(6), 367–373 (1980). [PubMed] [Google Scholar]
- 29.Huanga X., El-Sayeda M. A., “Gold nanoparticles: Optical properties and implementations in cancer diagnosis and photothermal therapy,” J. Adv. Res. 1(1), 13–28 (2010). 10.1016/j.jare.2010.02.002 [DOI] [Google Scholar]
- 30.Qin Z., Bischof J. C., “Thermophysical and biological responses of gold nanoparticle laser heating,” Chem. Soc. Rev. 41(3), 1191–1217 (2012). 10.1039/C1CS15184C [DOI] [PubMed] [Google Scholar]
- 31.Pennes H. H., “Analysis of tissue and arterial blood temperatures in the resting human forearm,” Journal of Applied Physiology 1(2), 93–122 (1948). [DOI] [PubMed] [Google Scholar]
- 32.Wissler E. H., “Pennes’ 1948 paper revisited,” J. Appl. Physiol. 85(1), 35–41 (1998). [DOI] [PubMed] [Google Scholar]
- 33.Insight Segmentation and Registration Toolkit http://www.itk.org.
- 34.Quarteroni A., Veneziani A., Zunino P., “A domain decomposition method for advection-diffusion processes with application to blood solutes,” Siam J. Sci. Comput. 23(6), 1959–1980 (2002). 10.1137/S1064827500375722 [DOI] [Google Scholar]
- 35.Khaled A.-R. A., Vafai K., “The role of porous media in modeling flow and heat transfer in biological tissues,” International Journal of Heat and Mass Transfer 46, 4989–5003 (2003). 10.1016/S0017-9310(03)00301-6 [DOI] [Google Scholar]
- 36.Azzimonti L., Sangalli L. M., Secchi P., Domanin M., Nobile F., “Blood flow velocity field estimation via spatial regression with PDE penalization,” J. American Statistical Association 110(511), 1057 (2015). 10.1080/01621459.2014.946036 [DOI] [Google Scholar]
- 37.Hasgall P. A., Di Gennaro F., Baumgartner C., Neufeld E., Gosselin M. C., Payne D., Klingenböck A., Kuster N., “IT’IS database for thermal and electromagnetic parameters of biological tissues,” (2015) www.itis.ethz.ch/database.
- 38.Murthy Z. V. P., Mungray A. A., Singh J., “Preparation and characterization of acrylonitrile butadiene styrene and trifluoroacetylethyl cellulose blend nanofiltration membrane and performance in the separation of mercury,” Lecture Notes in Engineering and Computer Science (2012).
- 39.Tsukada R., Sumimoto S., Ozawa T., “Thermal conductivity and heat capacity of ABS resin composites,” Journal of Applied Polymer Science 63(10), 1279–1286 (1997). [DOI] [Google Scholar]
- 40.Nguyen T. T. A., Le H. N. D., Vo M., Wang Z., Luu L., Ramella-Roman J. C., “Three-dimensional phantoms for curvature correction in spatial frequency domain imaging,” Biomed. Opt. Express 3(6), 1200–1214 (2012). 10.1364/BOE.3.001200 [DOI] [PMC free article] [PubMed] [Google Scholar]
- 41.Segars W. P., Tsui B. M. W., Frey E. C., Johnson G. A., Berr S. S., “Development of a 4D digital mouse phantom for molecular imaging research,” Mol. Imaging Biol. 6, 149–159 (2004). 10.1016/j.mibio.2004.03.002 [DOI] [PubMed] [Google Scholar]
- 42.Zhang Q. Q., Wu X. J., Wang C., Zhu S. W., Wang Y. L., Gao B. Z., Yuan X.-C., “Scattering coefficients of mice organs categorized pathologically by spectral domain optical coherence tomography,” BioMed Research International 2014, 13 (2014). 10.1155/2014/471082 [DOI] [PMC free article] [PubMed] [Google Scholar]
- 43.Sabino C. P., Deana A. M., Yoshimura T. M., da Silva D. F., França C. M., Ribeiro M. S., “The optical properties of mouse skin in the visible and near infrared spectral regions,” Journal Photochem. Photobiol. B 160, 72–78 (2016). 10.1016/j.jphotobiol.2016.03.047 [DOI] [PMC free article] [PubMed] [Google Scholar]
- 44.Holmes K. R., “Thermal conductivity of selected tissues,” Biotransport: Heat and Mass Transfer in Living Systems”, Ann. NY Acad. Sci. 858, 18–20 (1998). [Google Scholar]
- 45.Manuchehrabadi N., Chen Y., LeBrun A., Ma R., Zhu L., “Computational simulation of temperature elevations in tumors using Monte Carlo method and comparison to experimental measurements in laser photothermal therapy,” Journal of Biomechanical Engineering B 135, 121007 (2013). 10.1115/1.4025388 [DOI] [PubMed] [Google Scholar]
- 46.Faber P., Garby L., “Fat content affects heat capacity: a study in mice,” Acta Physiol. Scand. 153(2), 185–187 (1995). 10.1111/j.1748-1716.1995.tb09850.x [DOI] [PubMed] [Google Scholar]
- 47.Hindman J. C., “Proton resonance shift of water in the gas and liquid states,” J. Chem. Phys. 44, 4582–4592 (1996). 10.1063/1.1726676 [DOI] [Google Scholar]