Abstract
Photoacoustic (PA) spectral analysis (PASA) is a recently developed approach for quantifying molecular components and microscopic architectures in tissue. The PASA relies on signals with sufficient temporal length and narrow dynamic range for statistics based analysis. However, the optical and acoustic attenuation within the biological tissue make it difficult to acquire desirable signals from deep locations in biological tissue for PASA. This study proposes an interstitial PASA approach. By combining a fiber optics diffuser and a small aperture needle hydrophone, a fine needle PA probe facilitates PASA in deep tissue. A prototype probe has been fabricated and tested in quantifying the prostate cancer cell concentrations in vitro and lipid infiltrated hepatocyte in liver ex vivo. Experiment results show that the needle probe could potentially provide pathologic information of the tissues.
OCIS codes: (110.5125) Photoacoustics; (170.6510) Spectroscopy, tissue diagnostics
1. Introduction
Photoacoustic (PA) spectral analysis (PASA) is a recently developed technology with the capability of quantifying the histologic information in biological tissue [1–6]. By frequency domain analysis of the radiofrequency PA signals, the repetitive microscopic architectures and the content of molecular components in the assessed tissue volume can be statistically quantified. In our previous studies, we have successfully quantified the microscopic architectures in mouse livers in situ [6] and human prostate tissues ex vivo [7]. A key challenge in PA technology is the attenuation of optical energy and the high frequency components in the PA signals in deep tissue. Interstitial measurement approaches were attempted [8–10]. Using flat end [10] or conical tip [8, 9] fiber optics, previous studies have successfully generated PA signals in biological tissues with sufficient sampling volume. However, the light diffusion in biological tissue leads to rapid photon fluence decay away from the illumination source. Delicate signal components in tissue region far from the illumination source are lost due to the limited dynamic range of the data acquisition system.
Cylindrical fiber optics diffuser is commonly used for medical application, including photodynamic therapy, interstitial photocoagulation and interstitial hyperthermia [11]. The treated tip of the fiber optics diffuser, with length up to centimeters, can deliver relatively uniform optical energy along its longitudinal direction. A fiber optics diffuser thereby possesses the potential of generating low dynamic range PA signals with sufficient temporal/spatial length for statically analysis of the signal frequency components. The PA signals generated within a tissue volume by a fiber optics diffuser, when quantified by PASA, could thereby provide a more reliable tissue characterization than that generated at a random point by a flat end fiber optics. PA measurements using fiber optics diffuser have recently shown the capability of monitoring tissue temperature [12].
On the other hand, a highly sensitive and broadband ultrasound transducer close to the illumination location is essential for receiving the high frequency signal components. Needle hydrophones with high sensitivity, small aperture and thereby large receiving angle could be the ideal candidates.
The purpose of this study is to examine the feasibility of quantifying the diffusive changes of molecular component and microarchitecture in biological tissue by interstitial PASA. A prototype needle PA probe has been examined in phantoms and tissue samples. The advantages and limitations of the proposed measurement approach geometry are discussed.
2. Method and material
In this section, the fabrication of a prototype needle PA probe is described. The performance of the needle PA probe has been initially tested using phantoms made of fresh blood and canine prostate. The capability of the needle PA probe in producing effective PA signals for PASA has also been demonstrated with prostate cancer cells in vitro and with mouse livers ex vivo.
2.1 Measurement components and PASA
As shown in Fig. 1(a), a prototype needle probe has been fabricated by positioning the two measurement elements, a fiber optics diffuser and a needle hydrophone, in parallel. To avoid optical illumination at the surface of the hydrophones, the hydrophone tips were positioned 2 mm away from the illumination segment of the fiber optical diffuser. The fiber optics diffuser was fabricated following the procedures described in a previous study [11]. A fiber optics with 0.39 numerical aperture and 600 µm core was used. The coating of the 15 mm segment at the end of a fiber optics was removed. One end of the fiber optics was abraded into a cone shape and soaked in 48% hydrofluic acid for two hours. Figure 1(b) shows the etched fiber tip. The tiny etched surfaces allow for the exit of optical energy in the radial direction of the fiber optics. The other end of the fiber optics was polished for optical energy coupling. Figure 1(c) shows the light illumination pattern of the treated fiber. Other characteristics of the fiber optics diffuser are specified in [11].
Fig. 1.
A prototype needle PA probe. (a) A photograph of the probe. (b) A microscopic photograph of the etched surface of the fiber optics diffuser. (c) The light emission pattern of the fiber optics diffuser.
Two needle hydrophones were used in this study. A customized hydrophone with a center frequency of 35 MHz and a −6 dB bandwidth of 100% was first used to examine our best achievable performance in section 2.2. The hydrophone has a sensing surface with a diameter of 600 µm. Estimated by the directional sensitivity calculation methods in [13], the hydrophone has a −30dB sensitivity at ± 80 degree aperture. Another commercially available hydrophone (HNC1500, ONDA Corp., Sunnyvale, CA) with lower bandwdith (1-20MHz effective bandwidth) was used in the cell and tissue sample tests. The bandwidth of this hydrophone covers the microarchitectures at the dimensions of tens to hundreds of microns in the samples. The hydrophone has a nominal sensitivity of −239 dB re 1V/µPa and a −6dB sensitivity at 15 degrees. The acoustic signals from both hydrophones were preamplified by 20 dB (ZFL-1000 + , Mini-Circuits, Brooklyn, NY for the customized hydrophone and AH-1100, ONDA Corp., Sunnyvale, CA for the commercially available hydrophone). The signals were afterwards amplified by 40dB (5072PR, Olympus NDT, Waltham, MA) before recorded by an oscilloscope (TDS 540, Tektronix, Beaverton, OR).
The optical energy coupled into the fiber optics diffuser was monitored by an optical power meter for signal magnitude normalization in all experiments. The procedures of PASA are described in our previous studies [3, 6] and is briefly reviewed here. The power spectra of the PA signals within a selected frequency range are fit to linear models. The areas under the power spectra within the linear fitting range and the slopes of the linear models are quantified. The areas under the power spectra, namely total spectral magnitudes, within the frequency range of linear fitting are the representation of the content of molecular components inside the specimen. The slopes (illustrated later in section 3.4) are the quantitative representation of the heterogeneities of the microscopic architectures in the observed specimen.
2.2 Examining the detectable volume of the needle probe
As shown in Fig. 2(a), a transparent plastic tube with outer diameter of 1.5 mm and inner diameter of 1mm was positioned perpendicular to the prototype needle probe. The plastic tube was filled with fresh blood. Both the plastic tube and prototype needle probe were submerged in 1% intralipid solution to mimic the optical turbidity in biological tissue. 590 nm illumination was used as both blood and the optical contrast agents used later in the study have strong optical contrast at this wavelength. 7 mJ optical energy was focused at the coupling end of the fiber optics. Considering an approximated 70% coupling efficiency, the optical energy density at the fiber optics diffuser surface was 17 mJ/cm2. The customized hydrophone with a large receiving angle was used in this study.
Fig. 2.
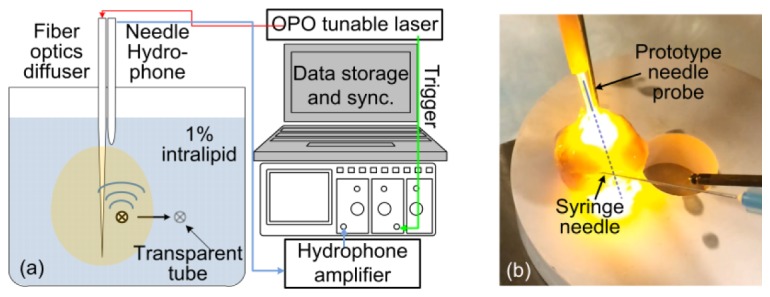
Experiment setups for understanding the detection range of the prototype probe. (a) A transparent plastic tube containing blood was positioned at varied longitudinal and radial positions with respect to the prototype probe. The background material was 1% intralipid. (b) The prototype needle PA probe was inserted at the center of a canine prostate ex vivo. The radial detection range of the needle probe was examined by injecting NP solution 1mm below the prostate surface.
The longitudinal and radial sensitivity was tested by positioning the plastic tube filled with whole blood at varied locations with respect to the fiber optics diffuser. The prototype needle probe was also tested with a prostate of a 1-year-old beagle ex vivo. The prostate was in a spherical shape and with a diameter of approximately 2.5 cm. As shown in Fig. 2(b), the fiber optics diffuser was positioned at the center of the prostate. The needle tip of a syringe was fixed approximately 1mm below the surface of the prostate. A coomassie blue (CB) nanoparticles (NP) solution at the concentration of 0.2 mg/ml, which is equivalent to pure CB dye at the concentrations of 1.4 µg/ml or 1.68 µmol/ml, was injected to simulate the tumors stained by systematical delivery [14]. The PA measurements were taken before and after the NP injection.
2.3 Quantifying cell density using needle probe
The needle probe has been tested in assessing the density of cells in vitro. As reported in a previous study [15], at 266 nm, cell nucleus acid has strong optical absorption yet water has relatively weak optical absorption. The optical illumination at 266 nm was generated by the fourth harmonics of an Nd:YAG laser (SureLite OPO, Continuum, CA). DU145, a prostate cancer cell line, was used. According to previous study [16], prostate cancer tumor cell density is within the range of 0-8000 cells/mm2, equivalent to 0 to 7 × 10⁵ cells/mm3. Cell densities of 8, 4, 2, 1 and 0.5 × 10⁵ per cm3 were attempted to simulate the spectrum of the normal to cancerous cell densities. A vortex mixer was used to produce homogeneous PCa cell suspension in phosphate buffered saline. The needle based PA measurements were taken. For each concentration, 10 measurements were taken. The absolute signal magnitudes were recorded. The power spectra of the PA signals and the total spectral magnitudes (i.e. area under the curve) within the frequency range of 0-10 MHz were calculated.
2.4 Quantifying lipid content in liver
Our previous study has shown that normal and fatty liver tissues can be differentiated by PASA slopes and magnitudes at 1220 nm [5, 6]. In this study, identical animal model was used to test the needle based PA measurement geometry. The fatty liver samples were generated in C57BL/6J wild type mice from Jackson laboratory. The mice were fed with chow diet for the first 8 weeks, followed by 60% high-fat diet (Research diet, D12492) for the 12 weeks thereafter. The control mice were fed with chow diet for 20 weeks. The livers of the mice were harvested at 20 weeks. As shown in Fig. 3(a) and 3(b), compared to the compact cell architecture in normal livers, fatty livers contain the heterogeneously distributed clusters of lipid infiltrated liver cells. As show in Fig. 3(c), the prototype needle probe was inserted at the center of the liver samples. The liver samples were thin and thereby submerged in water to avoid acoustic reflection at the tissue-air interface. The 1220 nm illumination was generated by an OPO laser (Vibrant, OPOTEK, Carlsbad, CA). Approximate 13 mJ/cm2 optical power was delivered at the fiber optics diffuser surface. The maximum absolute signal magnitudes were recorded. The PASA slopes and the total spectral magnitudes were calculated.
Fig. 3.

Interstitial PA measurements of normal and fatty livers in a mouse model ex vivo. (a) and (b) are histology photographs of normal and fatty livers, respectively. The photographs were reproduced from our previous work [6]. This is because the same batch of samples was measured by the need probe. (c) The needle probe was inserted into the liver samples. Both the prototype needle probe and the liver sample were submerged in water during the measurement to avoid acoustic reflection at tissue-air interface.
3. Results
3.1 Phantom study
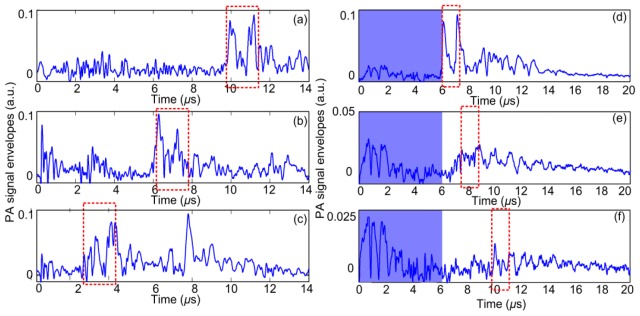
Figures 4(a)-4(c) show the PA signal envelopes acquired in the setup in Fig. 2(a) with the plastic tube containing whole blood located at three longitudinal positions along the fiber optics diffuser and 1 mm away from the fiber surface. The correlation between the tube positions and the PA signals were confirmed by continuously moving the tube. The signal intensities are relatively uniform at the three test locations, although an artifact signal appeared at 8 µs in Fig. 4(c), which could be a reflection signal by the wall of the water tank. Such observation supports our hypothesis that PA signals with low dynamic range can be generated along the longitudinal direction of the fiber optics diffuser. Figure 4(d)-4(f) are the PA signal envelopes acquired with the tube positioned at 5, 10 and 15 mm away from the center of the fiber optics diffuser. It can be observed that the tube can be detected at all the three positions, although at 15 mm [Fig. 4(f)], the PA signals from the blood are only approximately twice of the noise level. By converting the PA signals into frequency domain, the high frequency noise signals are spontaneously separated from the low frequency signal contours. Such advantage of PASA will be demonstrated later.
Fig. 4.
Examining (a)-(c) the longitudinal measurement uniformity and (d)-(f) the radial detection range of the prototype needle probe in the experiment setup in Fig. 2(a). The correlation between the tube positions and the PA signals were confirmed by continuously moving the tube. Red dashed boxes marks the signals correlated to the transparent plastic tube containing whole blood. The artifact signals generated due to the illumination of the needle hydrophone surface are shaded in blue. The magnitudes of the artifact signals become significant when the blood containing tube is far from the needle probe surface. An artifact probably due to the reflection by the water container can be observed in (c) at 8 µs. The artifact does not appear in other experiment results and is thereby not expected to affect the PASA procedures.
3.2 NP injection in canine prostate ex vivo
Figure 5 shows the envelope of PA signals before and after the NP solution injection in the experiment setup in Fig. 2(b). The signal increases marked by the green arrows were observed. The overlapping signal envelope at the beginning of the signal confirmed that the NP injection does not introduce significant displacement between the prototype needle probe and the prostate. The small signal magnitude increases were due to the low concentration (1.68 µmol/ml) of the NP solution.
Fig. 5.
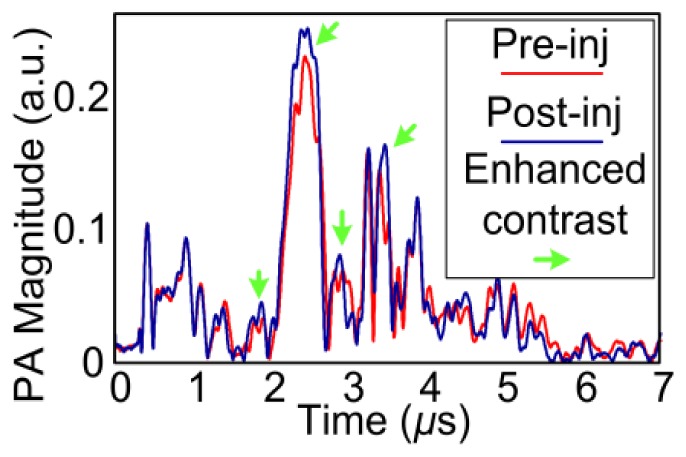
PA signal envelope acquired in the geometry shown in Fig. 2(b) before and after the NP injection. Inj = injection.
3.3 Assessing prostate cancer cell density in vitro
Figure 6(a) shows the representative PA signals generated by illuminating prostate cancer cell suspensions at varied concentrations at 266 nm. Since the cell concentrations are theoretically linearly correlated to the PA signal power, i.e. the square of signal magnitude, the correlation between the squares of the data points in Fig. 6(b) and the cell concentrations were calculated. A correlation of 0.87 (p<10−10) was found. A correlation of 0.90 (p<10−10) was found between the total spectral magnitude and the cell concentrations in Fig. 6(d) in logarithmic scale.
Fig. 6.
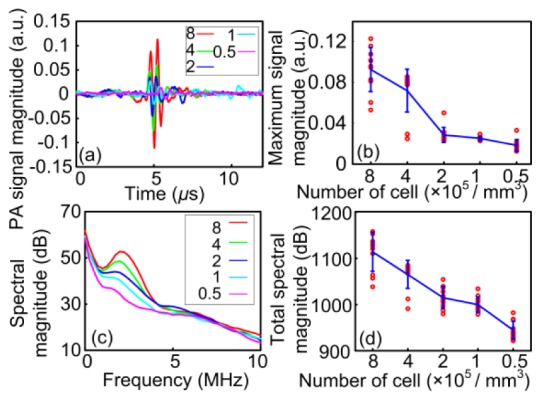
Assessing cancer cell density with the prototype needle probe. (a) PA signals acquired at the varied cell concentrations. The cell densities are the numbers in the legends multiplied by105 per cm3. (b) Statistics of the maximum absolute magnitudes of the signal acquired from all samples. (c) Power spectra of the PA signals in (a). (d) The total spectral magnitudes derived from 10 samples at each cell concentration.
3.4 Assessing the lipid content and distribution in mouse livers ex vivo
As shown in Fig. 7(a) and 7(b) for normal and fatty livers, respectively, PA signals at 1220 nm generated by fatty liver samples have larger signal magnitudes and more fluctuations. The maximum absolute signal magnitudes were quantified. Overlapping between the two liver conditions can be observed, although difference between the two data sets can still be found in a two tailed t-test (p = 0.002). Representative power spectra of the PA signals were shown in Fig. 7(d). The slopes and total magnitudes of the signal power spectra were quantified. Statistically significant difference (p<1 × 10⁻⁷ for both the spectral slopes and the total spectral magnitudes) can be observed between the slopes derived from the normal and fatty liver samples in a two-tailed t-test in Fig. 7(d) and 7(e).
Fig. 7.
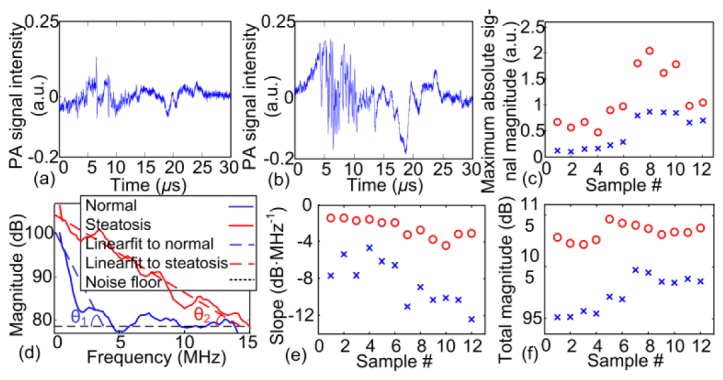
Differentiating normal and fatty mouse livers ex vivo using the prototype needle probe. (a) and (b) are representative signals generated by normal and fatty livers, respectively. (c) shows the statistics of the maximum absolute signal magnitudes. (d) shows the power spectra of the PA signals in (a) and (b). PASA slopes are illustrated. (e) and (f) are the slopes and total spectral magnitudes quantified from the measurements of 12 normal and 12 fatty liver samples.
4. Discussion
Due to the imperfect fabrication, the optical energy distribution along the longitudinal dimension of the fiber optics diffuser was not perfectly uniform. However, relatively low signal dynamic range along the longitudinal dimension allows for sufficient signal duration for statistics based PASA. Commercially available fiber optics diffusers fabricated by more advanced procedure could provide better illumination uniformity and delivery efficiency. Two hydrophones were used in this study. We initiated the investigation with the PCa cell and liver tissue experiments with the ONDA hydrophone. We later upgraded to a customized hydrophone with wider frequency range for better measurement performance.
The directional sensitivity and field of view are determined by both the wavelength-specific optical properties of the measured tissue volume and the characteristics of the hydrophones. In Figs. 4 and 5, objects as far as 15 mm away from the prototype needle probe were detected using 590 nm illumination. The optical absorption of intralipid monotonically decreases with respect to the increase of optical wavelengths. We thereby expect broader detection range at higher wavelengths. The detection range of the needle probe is also limited by the reception angle and the sensitivity of the hydrophone. A small aperture, i.e. effective detector surface area, provides large reception angle yet low sensitivity, and vice versa. Hydrophones with varied aperture size will be tested in search for a balanced performance in the future works. Since the needle PA hydrophone can only acquire one dimensional measurement, the localization capability of a single needle PA probe is limited. If the assessed tissue volume has uniformly diffusive disease condition comparable to the fatty liver condition shown in Fig. 3(b), localization is less of an issue. Using multiple probes and triangulation for localization might be a feasible approach, which will be investigated in the future works.
The total spectral magnitudes in Fig. 6(d) showed a slightly stronger correlation with the cell densities over the maximum absolute signal magnitudes in Fig. 6(b). Statistics of the data shown in Fig. 7 shows that the quantification of molecular contents by total spectral magnitude provides more significant differentiation between the two types of liver conditions. These observations are due to the fact that the total spectral magnitudes represent the overall signal magnitude information whereas the signal magnitudes are quantified at individual time points. PASA by the needle PA probe thereby provides more reliable quantification of the molecular content. Another advantage of the needle based PA measurement is to quantify the microscopic tissue architecture using the spectral slopes, as shown in Fig. 7(e). The PASA slope is a representation of the relative ratio between high and low frequency components and is thereby independent of the absolute signal magnitudes. PASA slope is thereby found more robust in tissue characterization in our other studies [5, 6]. The accurate quantification of both the total spectral magnitude and the PASA slopes relies on the sufficient temporal signal extension provided by the needle PA probe.
Low signal-to-noise ratio has been found in some of the time-domain measurements. However, the relatively low frequency fluctuations correlated to the microscopic architectures can potentially be separated from the high frequency background noise in frequency domain. Quantification of the tissue characteristics in frequency domain is thereby more reliable.
The two-element prototype needle PA probe can be potentially miniaturized and integrated into a fine needle. Such fine needle PA probe could be an ideal tool for acquiring the physio-chemical spectra developed in our previous study [6]. By interstitially observing and quantifying the microscopic architecture and molecular components with such fine needle PA probe, one could achieve minimally invasive assessment of the histopathologic information in vivo. Besides the advantage of avoiding unnecessary tissue extractions and the accompanied complications [17, 18], the extensive detection range of the needle probe could cover a tissue volume much larger than that of a biopsy core. Such comprehensive diagnostic approach could resolve the limited sampling issue of the biopsy procedures and minimize the number of false negative cases [19–22].
5. Conclusion
Purposed at producing PA signals with sufficient temporal length and narrow dynamic range, this study proposes an interstitial PA measurement approach with a fiber optics diffuser and a needle hydrophone. The performance of a prototype needle probe has been validated with phantom and tissue sample studies. The “in vivo biopsy” approach facilitated by such needle probe, if ultimately translated to clinics, could benefit the patients by minimizing the necessity of the conventional tissue biopsies.
Acknowledgments
We would like to thank Ms. Marilia Takada and Dr. Paulo Vilar Saavedra in Veterinary Medical Center at Michigan State University for providing the canine prostate sample. We would also like to thank Drs. Zhuo-Xian Meng and Dr. Jian-Die Lin in the Life Sciences Institute at University of Michigan for providing the mouse liver samples.
Funding
National Institute of Allergy and Infectious Diseases under grant number: 1R21AI12209801A1, American Gastroenterological Association Boston Scientific Career Development Technology and Innovation Award, National Institute of Arthritis and Musculoskeletal and Skin Diseases under grant number: 5R01AR060350, National Natural Science Foundation of China under grant numbers: 11374231, 11574231, and National High Technology Research and Development Program of China under grant number 2012AA022606.
References and links
- 1.Chitnis P. V., Mamou J., Feleppa E. J., “Spectrum analysis of photoacoustic signals for characterizing lymph nodes,” J. Acoust. Soc. Am. 135(4), 2372 (2014). 10.1121/1.4877828 [DOI] [Google Scholar]
- 2.Hysi E., Saha R. K., Kolios M. C., “Photoacoustic ultrasound spectroscopy for assessing red blood cell aggregation and oxygenation,” J. Biomed. Opt. 17(12), 125006 (2012). 10.1117/1.JBO.17.12.125006 [DOI] [PubMed] [Google Scholar]
- 3.Xu G., Dar I. A., Tao C., Liu X., Deng C. X., Wang X., “Photoacoustic spectrum analysis for microstructure characterization in biological tissue: A feasibility study,” Appl. Phys. Lett. 101(22), 221102 (2012). 10.1063/1.4768703 [DOI] [PMC free article] [PubMed] [Google Scholar]
- 4.Xu G., Fowlkes J. B., Tao C., Liu X., Wang X., “Photoacoustic spectrum analysis for microstructure characterization in biological tissue: analytical model,” Ultrasound Med. Biol. 41(5), 1473–1480 (2015). 10.1016/j.ultrasmedbio.2015.01.010 [DOI] [PMC free article] [PubMed] [Google Scholar]
- 5.Xu G., Meng Z.-X., Lin J. D., Yuan J., Carson P. L., Joshi B., Wang X., “The functional pitch of an organ: quantification of tissue texture with photoacoustic spectrum analysis,” Radiology 271(1), 248–254 (2014). 10.1148/radiol.13130777 [DOI] [PMC free article] [PubMed] [Google Scholar]
- 6.Xu G., Meng Z. X., Lin J. D., Deng C. X., Carson P. L., Fowlkes J. B., Tao C., Liu X., Wang X., “High resolution physio-chemical tissue analysis: towards non-invasive in vivo biopsy,” Sci. Rep. 6, 16937 (2016). 10.1038/srep16937 [DOI] [PMC free article] [PubMed] [Google Scholar]
- 7.Xu G., Davis M. C., Siddiqui J., Tomlins S. A., Huang S., Kunju L. P., Wei J. T., Wang X., “Quantifying Gleason scores with photoacoustic spectral analysis: feasibility study with human tissues,” Biomed. Opt. Express 6(12), 4781–4789 (2015). 10.1364/BOE.6.004781 [DOI] [PMC free article] [PubMed] [Google Scholar]
- 8.Mitcham T., Dextraze K., Taghavi H., Melancon M., Bouchard R., “Photoacoustic imaging driven by an interstitial irradiation source,” Photoacoustics 3(2), 45–54 (2015). 10.1016/j.pacs.2015.02.002 [DOI] [PMC free article] [PubMed] [Google Scholar]
- 9.Lediju Bell M. A., Kuo N. P., Song D. Y., Kang J. U., Boctor E. M., “In vivo visualization of prostate brachytherapy seeds with photoacoustic imaging,” J. Biomed. Opt. 19(12), 126011 (2014). 10.1117/1.JBO.19.12.126011 [DOI] [PMC free article] [PubMed] [Google Scholar]
- 10.Piras D., Grijsen C., Schütte P., Steenbergen W., Manohar S., “Photoacoustic needle: minimally invasive guidance to biopsy,” J. Biomed. Opt. 18(7), 070502 (2013). 10.1117/1.JBO.18.7.070502 [DOI] [PubMed] [Google Scholar]
- 11.George R., Walsh L. J., “Performance assessment of novel side firing flexible optical fibers for dental applications,” Lasers Surg. Med. 41(3), 214–221 (2009). 10.1002/lsm.20747 [DOI] [PubMed] [Google Scholar]
- 12.Li Z., Chen H., Zhou F., Li H., Chen W. R., “Interstitial photoacoustic sensor for the measurement of tissue temperature during interstitial laser phototherapy,” Sensors (Basel) 15(3), 5583–5593 (2015). 10.3390/s150305583 [DOI] [PMC free article] [PubMed] [Google Scholar]
- 13.Harris L. A., “Element directivity in ultrasonic imaging systems,” IEEE Trans. Sonics Ultrason. 22(5), 336–339 (1975). 10.1109/T-SU.1975.30815 [DOI] [Google Scholar]
- 14.Ray A., Wang X., Lee Y.-E. K., Hah H. J., Kim G., Chen T., Orringer D. A., Sagher O., Liu X., Kopelman R., “Targeted blue nanoparticles as photoacoustic contrast agent for brain tumor delineation,” Nano Res. 4(11), 1163–1173 (2011). 10.1007/s12274-011-0166-1 [DOI] [PMC free article] [PubMed] [Google Scholar]
- 15.Yao D.-K., Maslov K., Shung K. K., Zhou Q., Wang L. V., “In vivo label-free photoacoustic microscopy of cell nuclei by excitation of DNA and RNA,” Opt. Lett. 35(24), 4139–4141 (2010). 10.1364/OL.35.004139 [DOI] [PMC free article] [PubMed] [Google Scholar]
- 16.M. Weingant, H. M. Reynolds, A. Haworth, C. Mitchell, S. Williams, and M. D. DiFranco, “Ensemble prostate tumor classification in H&E whole slide imaging via stain normalization and cell density estimation,” in Machine Learning in Medical Imaging: 6th International Workshop, MLMI 2015, Held in Conjunction with MICCAI 2015, Munich, Germany, October 5, 2015, Proceedings, L. Zhou, L. Wang, Q. Wang, and Y. Shi, eds. (Springer International Publishing, Cham, 2015), pp. 280–287. 10.1007/978-3-319-24888-2_34 [DOI] [Google Scholar]
- 17.Zisman A., Leibovici D., Kleinmann J., Siegel Y. I., Lindner A., “The impact of prostate biopsy on patient well-being: a prospective study of pain, anxiety and erectile dysfunction,” J. Urol. 165(2), 445–454 (2001). 10.1097/00005392-200102000-00023 [DOI] [PubMed] [Google Scholar]
- 18.Buscarini L., Fornari F., Bolondi L., Colombo P., Livraghi T., Magnolfi F., Rapaccini G. L., Salmi A., “Ultrasound-guided fine-needle biopsy of focal liver lesions: techniques, diagnostic accuracy and complications. A retrospective study on 2091 biopsies,” J. Hepatol. 11(3), 344–348 (1990). 10.1016/0168-8278(90)90219-H [DOI] [PubMed] [Google Scholar]
- 19.Fleshner N. E., O’Sullivan M., Fair W. R., “Prevalence and predictors of a positive repeat transrectal ultrasound guided needle biopsy of the prostate,” J. Urol. 158(2), 505–508 (1997). 10.1016/S0022-5347(01)64518-X [DOI] [PubMed] [Google Scholar]
- 20.Rabbani F., Stroumbakis N., Kava B. R., Cookson M. S., Fair W. R., “Incidence and clinical significance of false-negative sextant prostate biopsies,” J. Urol. 159(4), 1247–1250 (1998). 10.1016/S0022-5347(01)63574-2 [DOI] [PubMed] [Google Scholar]
- 21.Taira A. V., Merrick G. S., Galbreath R. W., Andreini H., Taubenslag W., Curtis R., Butler W. M., Adamovich E., Wallner K. E., “Performance of transperineal template-guided mapping biopsy in detecting prostate cancer in the initial and repeat biopsy setting,” Prostate Cancer Prostatic Dis. 13(1), 71–77 (2010). 10.1038/pcan.2009.42 [DOI] [PMC free article] [PubMed] [Google Scholar]
- 22.Regev A., Berho M., Jeffers L. J., Milikowski C., Molina E. G., Pyrsopoulos N. T., Feng Z.-Z., Reddy K. R., Schiff E. R., “Sampling error and intraobserver variation in liver biopsy in patients with chronic HCV infection,” Am. J. Gastroenterol. 97(10), 2614–2618 (2002). 10.1111/j.1572-0241.2002.06038.x [DOI] [PubMed] [Google Scholar]


